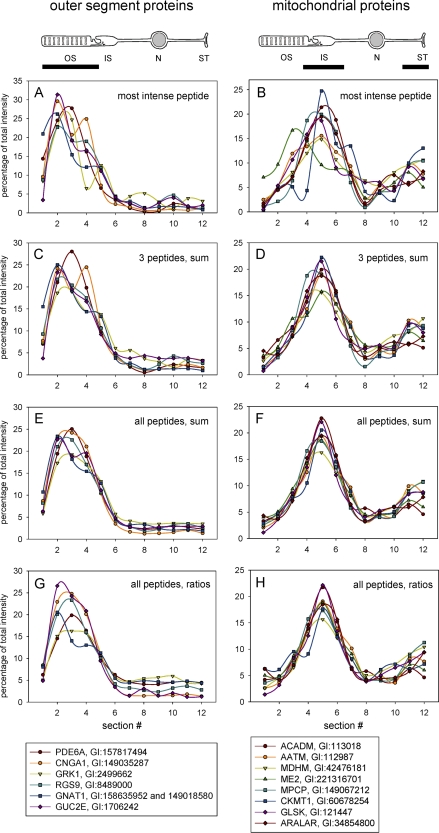
Fig. 2.
Distribution profiles of rod outer segment and mitochondrial proteins calculated by four peptide-to-protein quantification algorithms. Data obtained for outer segment-specific proteins are shown on the left (A–G) and for mitochondrial proteins on the right (B–H). The plots are color-coded according to descriptions in the legends below the panels. Quantification algorithms used in each case are indicated in the panels. The subcellular localization of each protein group is indicated by black bars below the photoreceptor cell cartoons on the top. Abbreviations: OS, outer segment; IS, inner segment; N, nucleus; ST, synaptic terminal.

