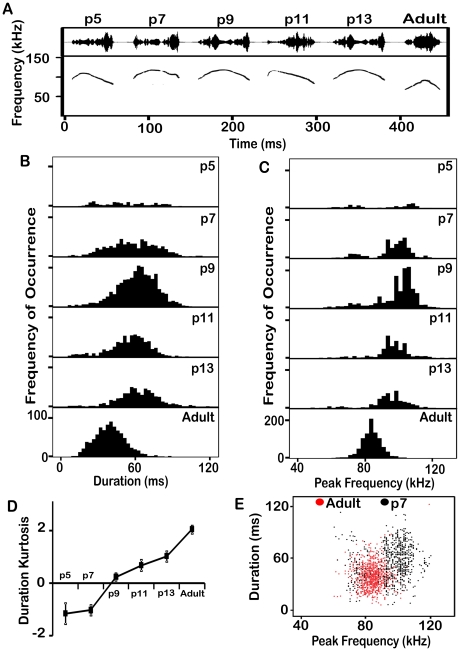
Figure 6. Analysis of the duration and frequency of chevron syllables across ages.
(A) The most typical chevron syllable at each age. Note the similarity of pup syllables. (B) Distributions of durations of the chevron syllable at each age. The mean duration changes only slightly. (D) The Kurtosis of the distribution increases with age. Bars represent the standard error of the mean. (C) Distributions of the dominant frequency of the chevron syllable at each age. At p5 and p7 there are two clear peaks in the distribution, but by p9 there are fewer low frequency syllables being produced. The frequency of the higher peak gradually reduces with age. (E) Scatter plots of duration against frequency from animals aged p7 and adults. Although there is some overlap, the spectro-temporal features of adult syllables are distinct from pup syllables.

