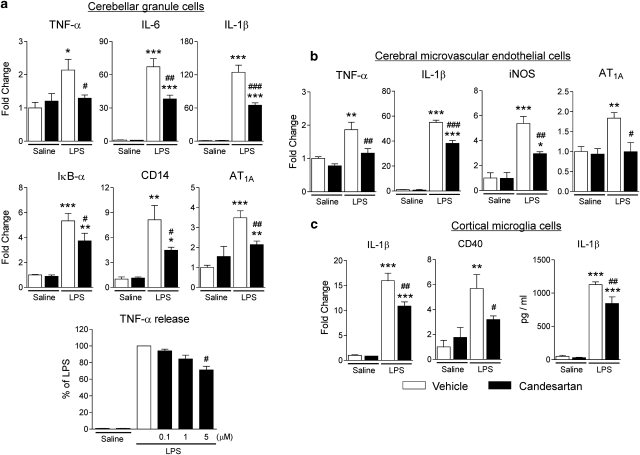
Figure 6.
Angiotensin II AT1 receptor blockade decreases LPS-induced inflammation markers in cerebellar granule cells (a), cerebral microvascular endothelial cells (b) and cortical microglia in culture (c). Cells were isolated and cultured as described in Materials and Methods. Expression of mRNAs was detected by real-time PCR and normalized to the level of GAPDH mRNA. Results are expressed as a fold change relative to vehicle-saline group. The release of TNF-α and IL-1β was determined by ELISA in the incubation media as described in Materials and Methods. Data are presented as means±SEM of three independent experiments performed in duplicates. *P<0.05, **P<0.01, ***P<0.001 compared with vehicle-saline group; #P<0.05, ##P<0.01, ###P<0.001 compared with vehicle-LPS group.

