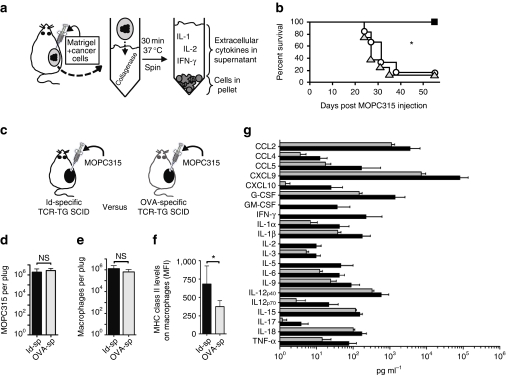
Figure 1. Role of tumour-specific CD4+ T cells for myeloma immunosurveillance.
(a) The Matrigel cytokine assay. Cancer cells are mixed with cold liquid Matrigel before s.c. injection. Matrigel gelifies in vivo and forms a gel plug. The plug contains the injected cancer cells, infiltrating immune cells and cytokines that are secreted locally. At various time points after injection, the Matrigel plug is excised and dissolved with collagenase. Following centrifugation, cytokines in supernatant are quantified by Luminex technology. Cells in the pellet are analysed by various techniques such as flow cytometry, Luminex technology and gene expression microarrays. (b) Tumour challenge experiment. Id-specific TCR-TG SCID mice (squares), OVA-specific TCR-TG SCID mice (triangles) and SCID mice (circles) were injected s.c. with MOPC315 myeloma cells in phosphate-buffered saline (PBS). Tumour development and survival were followed over time. *P=0.0004 for difference in survival between Id-specific and OVA-specific TCR-TG SCID mice (log-rank test). (c) Design of the first experimental situation for cytokine analysis (myeloma±specific T cells). Id-specific TCR-TG SCID mice and OVA-specific TCR-TG SCID mice were injected s.c. with MOPC315 myeloma cells in Matrigel. The plugs were analysed individually at day +8. (d) Total number of MOPC315 cells per plug. (e) Total number of CD11b+ macrophages per plug. (f) MHC class II levels on Matrigel-infiltrating CD11b+ macrophages. MFI, mean fluorescence intensity. *P=0.009, Mann–Whitney test. (g) The concentration of 33 cytokines in the extracellular matrix of the Matrigel plugs was quantified for Id-specific (black bars) and OVA-specific (grey bars) TCR-TG SCID mice. Only cytokines with significantly (P<0.05, Mann–Whitney test) higher levels in one group compared with the other are included in the bar graph. (b) n=6–8. (c–g) n=11. Id-sp, Id-specific TCR-TG SCID mice; NS, not significant; OVA-sp, OVA-specific TCR-TG SCID mice. All data are presented as mean±s.d. G-CSF, granulocyte colony-stimulating factor; GM-CSF, granulocyte-macrophage colony-stimulating factor; TNF-α, tumor necrosis factor α.

