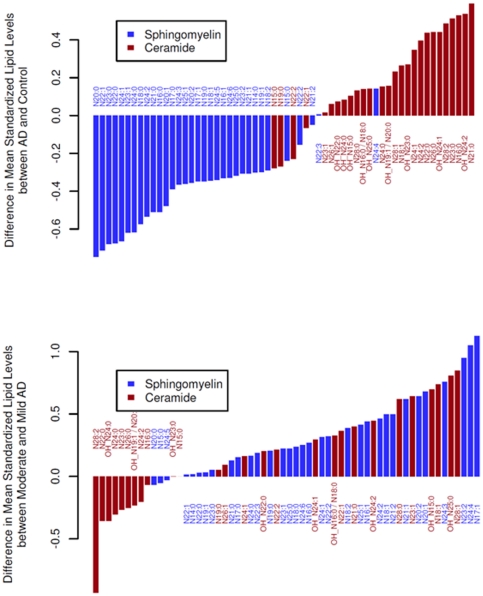
Figure 6. Rank of the changed mean mass levels of individual sphingomyelin and ceramide molecular species in all AD patients relative to the normal controls (panel A) and the differences in sphingomyelins and ceramides between patients with moderate Alzheimer's disease (MMSE<20) and patients with mild Alzheimer's disease (MMSE> = 20) (panel B).
The Y axes show the standardized differences in lipid level: lipid levels were standardized to a mean of 0 and standard deviation of 1 across all samples before ranking and plotting. For Alzheimer's disease versus controls, P = 1.6×10⁻⁹ for sphingomyelins and P = 0.00034 for ceramides (Wilcoxon signed rank test two sided on means over the standardized data). For moderate versus mild Alzheimer's disease, P = 7.1×10⁻⁸ for sphingomyelins and P = 0.10 for ceramides.

