
Figure 2.

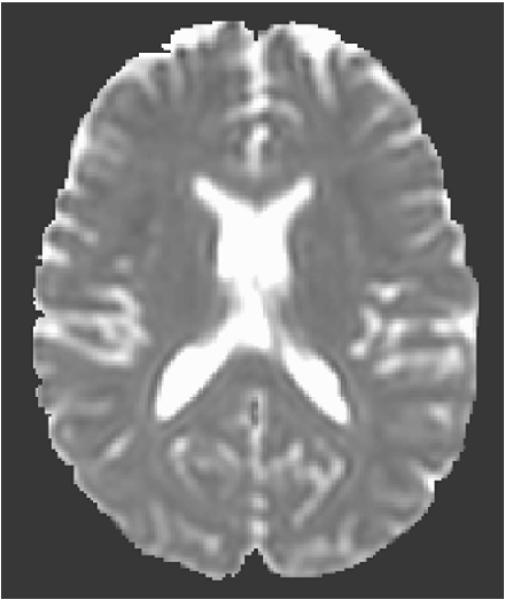
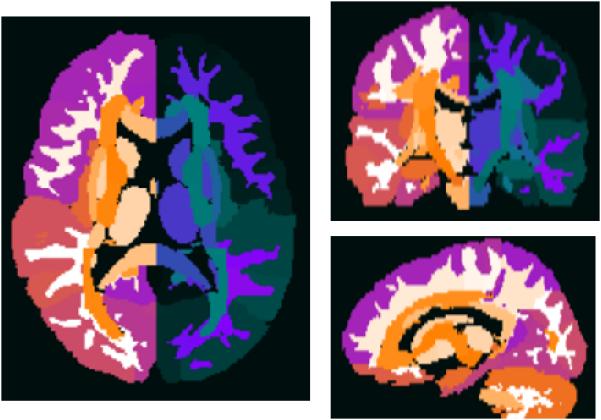
Figure showing sample (a) FA and (b) MD maps computed from DTI image. (c) ROI map of the EVE template showing 176 structures. These regions are implemented as the basis for the features used to construct the pattern classifier. Details about the Eve template can be found at (Mori, Oishi et al. 2008).