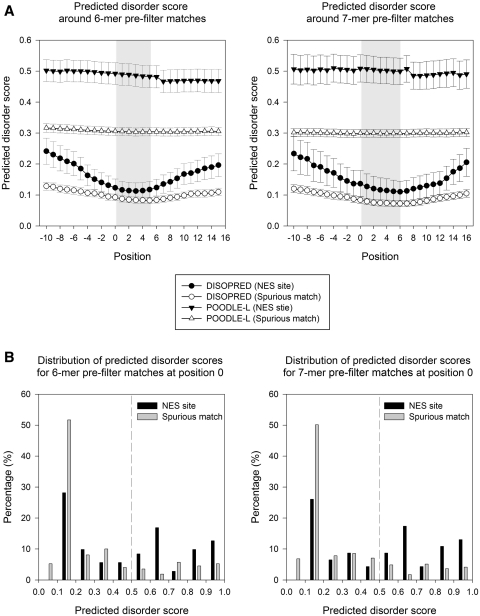
Figure 2.
Predicted disorder scores by POODLE-L and DISOPRED2 of NES sites and spurious matches (training data). (A) The mean score and its standard error are shown at each position, where position 0 represents the first residue of 6-mer (ΦxxΦxΦ) or 7-mer (ΦxxxΦxΦ) pre-filter matches. The regions corresponding to ΦxxΦxΦ and ΦxxxΦxΦ are shaded in gray [where Φ denotes (LIVFM) and x denotes any amino acid]. (B) The distribution of POODLE-L disorder scores at the first position of 6-mer and 7-mer are shown. The vertical dashed line indicates the threshold of POODLE-L (0.5).

