Figure 2.
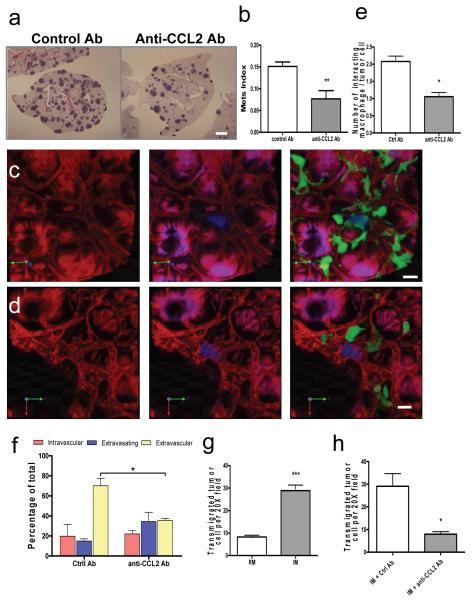
CCL2-recruited monocytes promote metastatic seeding.
a, Representative H&E stained sections showing Met-1 metastasis with Ab treatment. Bar=1 mm. b, Met-1 metastasis (Mets) burden with different Ab treatment. n=6, p=0.006. c and d, Representative snapshots of 3D reconstructed confocal images of tumor cells (blue) and macrophages (green) in lung vasculature (red) 24 hours after tumor cell tail vein injection in mice treated with control (c) or anti-mouse CCL2 Ab (d). Bar = 20 um. e, Number of macrophage-tumor cell interactions in mice with Ab treatment. f, Tumor cell extravasation in mice with different Ab treatment. (e, p= 0.0066 and f, p=0.00163 are based upon 3D images of 15-20 tumor clusters per mouse, n=3 mice/group.) g, Number of transmigrated Met-1 cells in presence of RMs or IMs. n=5, p<0.0001. h, Number of transmigrated Met-1 cells in presence of IMs with different Ab. n=3, p=0.0204. All bars shown are mean + s.e.m.

