

Abstract
Hair follicle harbors a rich stem cell pool with mesenchymal lineage differentiation potential. Although previous studies with rodent cells demonstrated that hair follicle sheath and papilla cells possess multi-lineage differentiation potential, human hair follicle derived mesenchymal stem cells (hHF-MSCs) have not been characterized in detail in terms of their multipotency. In addition, it is not clear whether these cells are true stem cells that can differentiate along multiple lineages or whether they represent a collection of progenitor cells with restricted differentiation potential. Here we report that hHF-MSCs are highly proliferative cells that can be maintained in culture for ~45 population doublings before they start to show signs of cellular senescence. Under appropriate culture conditions, hHF-MSCs differentiated along the myogenic, osteogenic, adipogenic and chondrogenic lineages, as demonstrated by kinetic gene expression profiling and functional assays. Interestingly, the differentiation potential decreased with time in culture in a lineage-specific manner. Specifically, myogenesis and chondrogenesis showed a moderate decrease over time; osteogenesis was maximum at intermediate passages and adipogenesis was highly sensitive to long-term culture and was diminished at late passages. Finally, hHF-MSCs were clonally multipotent as the majority of hHF-MSCs clones (73%) demonstrated bi- or tri-lineage differentiation potential. These results suggest that hHF-MSCs may present an alternative source of easily accessible, autologous stem cells for tissue engineering and regenerative medicine.
Keywords: Mesenchymal stem cells, hair follicle, clonal differentiation potential, gene expression profiling, long term in-vitro expansion
INTRODUCTION
Skin is the largest organ and plays a key role in maintaining the body’s homeostasis. One of the skin appendages, the hair follicle, is an easily accessible mini-organ with a number of important functions such as protection against cold, injuries and pathogens [1]. The hair follicle undergoes numerous cycles of growth and retraction throughout the adult life, prompting scientists to hypothesize that this mini-organ might be a rich source of stem cells. However, the anatomic location where stem cells resided remained elusive until 1990 when Cotsarelis et al. first demonstrated that label-retaining cells resided in the bulge of the hair follicle [2], a finding that was later verified using transgenic mice [3, 4]. During the hair growth phase (anagen) bulge stem cells are activated and migrate to the base of the hair follicle, the bulb region, where they proliferate and differentiate to regenerate the inner and outer root sheath, matrix and hair shaft [5]. In addition to hair growth, bulge derived stem cells also contribute to epidermal regeneration in response to skin injury [6]. Interestingly, bugle stem cells exhibited robust multipotency as they could differentiate to multiple cell types including neurons, glia, keratinocytes and melanocytes [7, 8].
Although the bulge derives from the ectoderm, a cell population of mesodermal origin is also present within the hair follicle tissue [9]. Mesodermal derived cells are located in the dermal papilla and dermal sheath and appear to regulate hair follicle development and cycling through cross-talk with the epithelium [9]. Hair follicle dermal papilla/sheath cells promote hair restoration upon transplantation [10, 11] and have been reported to be immunoprivileged [12]. Previous studies showed that rodent dermal papilla/sheath cells have broad differentiation potential, similar to bone marrow derived mesenchymal stem cells [13, 14]. Notably, transplantation experiments showed that cells derived from the dermal papilla/sheath of mouse hair follicles reconstituted multiple lineages of the hematopoietic system of lethally irradiated mice, suggesting that these mesenchymal cells have very broad differentiation potential [15]. Recently our group demonstrated that dermal papilla/sheath cells from human hair follicles exhibited mesenchymal stem cell (MSC) immunophenotype and differentiated to all mesenchymal lineages and therefore, they were termed human hair follicle derived mesenchymal stem cells (hHF-MSCs) [16]. In addition, using a smooth muscle α-actin promoter we derived functional smooth muscle cells (SMC) from human and ovine HF-MSCs, which were used to engineer small-diameter vascular constructs exhibiting robust contractility in response to vasoactive agonists [17, 18].
In contrast to MSCs from bone marrow or adipose tissue, human hair follicle derived MSCs have not been characterized in terms of their multipotency. Specifically, it is not known whether hHF-MSCs are clonally multipotent or whether they represent a collection of progenitor cells with restricted differentiation potential. In addition, it is not known how the hHF-MSCs differentiation potential changes over time in culture. Here we addressed these questions using gene expression analysis, functional assays and clonal analysis and found that hHF-MSCs are highly proliferative and multipotent stem cells with great potential for tissue regeneration and cell therapies.
RESULTS
hHF-MSCs maintain their proliferative capacity over long culture period
hHF-MSCs were isolated from human scalp hair follicles and expanded in DMEM supplemented with 10% FBS and 1 ng/mL bFGF. The cells exhibited small, elongated, fibroblast-like morphology (Fig. 1A), had normal karyotype (Fig. 1B) and expressed surface markers characteristic of mesenchymal stem cells (Fig. S1). To examine their proliferation capacity, hHF-MSCs were seeded at 3,000 cells/cm2 and passaged every fourth day. In each passage the total cells were counted and the number of divisions was calculated. The number of population doublings remained relatively constant for 11–12 passages (approximately 2.5 to 3.5 divisions per passage) and declined sharply thereafter, reaching less than one doubling over a 4-day period by passage 14 (Fig. 1C). At the same time the cells appeared larger and flatter possibly as a result of cellular senescence. Indeed, staining for the senescence associated β-galactosidase (SA β-Gal) revealed that the fraction of SAβ-gal positive cells increased over time in culture (Fig. 1D, E). While, only a small fraction of cells (<5%) appeared SA β-Gal positive on passages 5 and 8, this number increased to 91±7% by passage 14 (n=3) (Fig 1E).
Figure 1. hHF-MSCs exhibited high proliferation potential.

(A) hHF-MSCs morphology. (B) Karyotype analysis of hHF-MSCs shows no chromosomal abnormality. (C) HF-MSCs were plated at 3000 cells/cm2 and passaged every 4 days. The number of cells was counted at each passage and the number of cell divisions was calculated for 14 passages (n=3). (D) Senescence associated β-Galactosidase (SA-β-Gal) staining of HF-MSCs at passage 5 (P5) and 14 (P14). (E) Quantitative analysis of SA-β-Gal positive cells as a function of the number of passages (n=3). Bars=400μm.
Kinetics of gene expression during differentiation of hHF-MSCs
Next we evaluated the multi-lineage differentiation potential of hHF-MSCs toward myogenic, osteogenic, adipogenic and chondrogenic lineages using quantitative real time PCR. Myogenic differentiation was induced by treatment with 2 ng/mL TGF-β1 [17, 19, 20] and total mRNA was isolated daily for a period of 6 days. The expression level of three smooth muscle specific genes, smooth muscle α-actin (αSMA), SM22 and myocardin [21, 22], was measured as a function of time. As illustrated in Fig. 2A all three genes were significantly up-regulated upon TGF-β1 treatment as compared to non-treated cells (p<0.05). More specifically, SMA exhibited the highest expression on the first two days of treatment (day 2: 10±1.8 fold, n=3, p<0.05 as compared to day 0) and decreased thereafter to 4.4±0.78 fold on day 6 (n=3, p<0.05 as compared to day 2). Similar to αSMA the level of SM22 increased on day 2 (day2: 11.2±3.7 fold, n=3, p<0.01 as compared to day 0) and decreased significantly on day 6 (day 6: 5.9 ±0.5 fold, n=3, p<0.05 as compared to day 2). Interestingly, expression of myocardin increased dramatically and showed a periodic kinetic pattern, demonstrating maxima on days 3 and 5 (day 3: 731±172 fold, n=3; and day 5: 932±204, n=3) and minima on days 2, 4 and 6 (day 2: 10.4±3.8 fold, n=3; day 4: 220±11, n=3; and day 6: 495±181, n=3). It is worth noting that medium was changed every 2 days, suggesting a transient increase in myocardin expression concomitant with TGF-β1 stimulation.
Figure 2. Transcriptional profile of lineage specific genes during differentiation.

RT-PCR fr the indicated genes in (A) myogenic; (B) adipogenic; (C) osteogenic; and (D) chondrogenic lineages. The ribosomal gene RPL32 served as a reference gene. The data at each time was normalized to that of undifferentiated cells (day 0) and plotted as mean SD (n=3).
During adipogenic induction hHF-MSCs rounded up and at later stages, started accumulating oil droplets signifying terminal adipogenic differentiation. To monitor the transcriptional profile of adipogenesis, RNA was isolated at days 2, 4, 8, 14, 16 and 21 and the relative expression levels of PPARγ, lipoprotein lipase and leptin were measured by RT-PCR (Fig. 2B). Statistical analysis demonstrated significant upregulation of lineage specific markers during adipogenesis (p<0.001). More specifically, the regulatory transcription factor PPARγ increased continuously reaching expression levels of 7.2±0.8 fold on day 21 (n=3, p<0.001 as compared to day 0). Early marker, lipoprotein lipase [23] and late marker, leptin [24] are secreted by adipocytes and their expression is believed to be highly up-regulated during adipogenesis [25]. Both markers showed a sharp increase after day 8 reaching the highest levels of expression on day 21. In particular, the level of leptin increased to 231±26 fold on day 21 and lipoprotein lipase increased dramatically to 45,600±2,114 fold as compared to non-differentiated cells (n=3).
hHF-MSCs cultured under osteogenic conditions increased the expression of osteogenic genes such as RUNX-2, alkaline phosphatase, and osteonectin (p<0.001) (Fig. 2C). RUNX-2, a key transcription factor for osteogenesis [26], showed a steady expression throughout the differentiation period reaching 3.9±0.8 fold on day 21 (n=3, p<0.05 as compared to day 0). Osteonectin increased to a similar level reaching maximum on day 8 (3.09 ±0.18 fold, n=3, p<0.05 as compared to day 21). On the other hand, alkaline phosphatase was highly induced throughout the differentiation period, reaching maximum level on day 21 (301±70 fold, n=3, p<0.05 as compared to day 0).
Chondrogenic differentiation conditions induced expression of three lineage specific genes, namely SOX-9, aggrecan and collagen type X (p<0.001) (Fig. 2D). In 2D cultures, mesenchymal condensation occurred rapidly and became apparent under the microscope by day 4. The transcription factor SOX-9 that regulates chondrogenic differentiation [27] was up-regulated early on and was expressed at 159±31fold on day 21 (n=3, p<0.05 as compared to day 0). Aggrecan, a mature marker of chrondrogenesis [28], was expressed at later stages of differentiation reaching maximum levels on day 16 (day 16: 10,171±2,166 fold, n=6, p<0.05 as compared to day 14) and remained constant thereafter (day 21: 8,314±3,454 fold, n=3, p>0.05 as compared to day 16). Another chondrogenic marker, collagen type X also increased upon chondrogenic induction (day 4: 23.4±4 fold, n=3, p<0.05 as compared to day 0) and continued to increase at later times (day 21: 60.1 ±20.3 fold, n=3, p<0.05 as compared to day 4).
Long-term in vitro expansion reduces the differentiation potential of hHF-MSCs
Next we examined the effect of prolonged in vitro expansion on the differentiation potential of hHF-MSCs. To this end, hHF-MSCs were differentiated towards the osteogenic, adipogenic, chondrogenic or myogenic lineage at different passages (passage 5, 8 and 11). The degree of differentiation was assessed by lineage specific functional assays, namely Oil Red O stain for adipogenesis, Von Kossa stain for osteogenesis, Alcian Blue stain for chondrogenesis and α-SMA expression and fibrin gel compaction for myogenesis.
As shown in Fig. 3A hHF-MSCs that were differentiated to smooth muscle cells (SMC) showed increased expression of α SMA, calponin and myosin heavy chain (MHC). hHF-MSCs that were cultured in proliferation medium (PM) showed low levels and diffuse staining of all three proteins. On the other hand in differentiation medium (DM), all three proteins showed robust expression and filamentous organization that is characteristic of SMC phenotype. To determine the effect of in vitro expansion on myogenesis we performed two independent experiments. First, we measured the fraction of cells expressing α SMA at different passages using flow cytometry. As shown in Fig. 3B the fraction of α SMA positive cells was 8–15 times higher in myogenic DM as compared to PM for all passages. Interestingly, the fraction of α SMA+ cells was higher at passage 8 (P5: 67.5 ±2% vs. P8: 83.7 ±3%; n=3, p<0.001) and decreased at passage 11 (P11: 51.4 ±3.2; n=3, p<0.001 as compared to P8). Second, since the quintessential attribute of SMC is their ability to generate force, we also measured fibrin gel compaction by hHF-MSCs as a function of time in culture. As shown in Fig. 3C, prolonged in vitro culture had a small but statistically significant effect on gel compaction. After 96hr, P5 hHF-MSCs decreased the area of fibrin hydrogels to 7.7 ±1% of the initial area compared to P11 hHF-MSCs which compacted the hydrogels to 19±2% of the initial area (n=3; p<0.05) suggesting that hHF-MSCs maintain their ability to contract even at late passages (Fig 3C). Taken together these results suggest that myogenic differentiation potential and contraction of hHF-MSCs appear to be largely unaffected by in-vitro expansion up to passage 11.
Figure 3. Effect of long-term in vitro expansion on myogenic differentiation of hHF-MSCs.

(A) Immunocytochemistry of P8 hHF-MSCs for αSMA, Calponin and MHC. At the indicated passage (P5, P8, P11) hHF-MSCs were induced to differentiate and the extent of myogenic differentiation was quantified by αSMA expression using flow cytometry (B); and fibrin gel compaction assay (C). Representative plots from three independent experiments are shown (n=3). Results are expressed as mean ± SD. αSMA: Smooth muscle α-Actin, MHC: Myosin Heavy Chain, DM: differentiation media, PM: proliferation media. Bar=50μm; * denotes p<0.05.
Osteogenesis showed similar trend with myogenesis as evidenced by Von Kossa staining, which is the standard method of identifying matrix mineralization. Mineralization was found to be the highest for P8 cells and then decreased significantly by P11 (Fig 4A). Von Kossa positive area (quantified using ImageJ) showed that 85±7% area was mineralized in P8 hHF-MSCs compared to 36±7% (p=1.8×10⁻⁷) and 17±4% (p=1.3×10⁻⁸) in P5 and P11 hHF-MSCs, respectively (Fig 4A). Chondrogenesis was examined through alcian blue staining that positively stains sulfated glycosaminoglycans (GAG) (blue color). Measurements of the area that was stained blue revealed that chondrogenic potential decreased gradually over time, reaching approximately half of its initial value by P11 (42±6% blue area) (Fig 4B). GAG deposition was highest in P5 hHF-MSCs (74±7% blue area) compared to P8 hHF-MSCs (61±11% blue area, p<0.05) (Fig 4B). In contrast, adipogenesis showed dramatic reduction between P5 and P11 as demonstrated by Oil Red O staining and oil droplet quantitation (15±3% oil droplet area in P5 compared to 1±0.6% in P11, p=1.6×10⁻⁶) (Fig. 4C). These results demonstrate that the adipogenic and osteogenic differentiation potential of hHF-MSCs were more sensitive to prolonged in vitro culture compared to myogenic and chondrogenic potential.
Figure 4. Effect of long-term in vitro expansion on hHF-MSC differentiation potential.

At the indicated passage (P5, P8, P11) hHF-MSCs were induced to differentiate and the extent of differentiation was assessed by Von Kossa stain for osteogenic lineage (A), Alcian Blue stain for chondrogenic lineage (B) and Oil Red O stain for adipogenic lineage (C). Multiple pictures were acquired from each alcian blue or von Kossa stained sample and used to generate mosaic images. The stained area in each image was quantified using Image J. (DM: Differentiation Media, PM: Proliferation Media). (A, B) Bar=2mm; (C) Bar=200μm. * denotes p<0.05.
Clonal populations of hHF-MSCs exhibited multipotent differentiation potential
Although these results demonstrated the multi-lineage differentiation potential of hHF-MSCs, it was not clear whether hHF-MSCs were true multipotent stem cells or a collection of various progenitors each with unipotent differentiation ability. To address this issue, we plated hHF-MSCs as single cells in each well of five 96-well plates. Wells containing more than one cell were discarded, whereas single cells were allowed to expand. Thirty seven clones were selected and evaluated for adipogenic, osteogenic and chondrogenic differentiation potential. (Since the vast majority of hHF-MSCs could differentiate to SMCs (>80% of P8 cells were α SMA+) the clones were not examined for myogenic potential. These results are summarized in Table 1 and representative images for tri-potent, bi-potent and uni-potent clones are shown in Fig 5.
Table 1. Clonal analysis of hHF-MSC differentiation potential.
hHF-MSC clones were generated from single cells in 96-well plates using the limited dilution method. HF-MSC clones were differentiated towards adipogenic, osteogenic and chondrogenic lineages and their differentiation potential was assessed by Oil red O, Von Kossa and Alcian Blue staining, respectively.
| Clonal differentiation potential | Number of Clones | % in total clone number |
|---|---|---|
| 3 Lineages | 13 | 35.14 |
| 2 lineages. | 14 | 37.84 |
| 1 lineage | 7 | 18.92 |
| no differentiation | 3 | 8.11 |
| Total | 37 |
| Adipogenic | Chondro genie | Osteogenic | #of clones |
|---|---|---|---|
| + | + | + | 13 |
| + | + | − | 1 |
| + | − | − | 2 |
| − | + | + | 11 |
| − | − | + | 1 |
| − | + | − | 4 |
| + | − | + | 2 |
Figure 5.
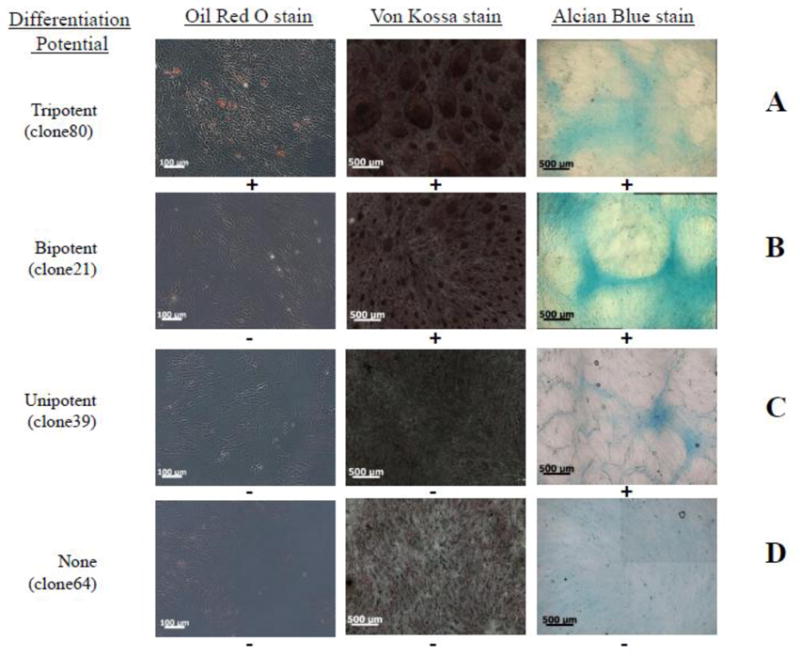
Representative images of tripotent (A), bipotent (B) unipotent (C) clones and clones lacking differentiation capacity (D). Each clone was stained for Oil Red O, von Kossa and alcian blue. Bars = 100μm (oil Red O); bar=500μm (Von Kossa and Alcian Blue).
Interestingly, 13 out of 37 clones (~35%) demonstrated tri-lineage differentiation potential and 14 out of 37 clones (~38%) exhibited bi-potent differentiation to chondrogenic and osteogenic lineages. Seven clones (~19%) showed unipotent characteristics, whereas only three clones (~8%) failed to differentiate to any of the three lineages. It is worth noting that these experiments were carried out with passage 4 cells that were expanded from single cells, and therefore, underwent approximately 20 population doublings (corresponding to passage 10–11) before the differentiation potential was evaluated. Therefore, our results demonstrate that a significant fraction of hHF-MSCs retained multipotency even after prolonged culture times.
DISCUSSION
The hair follicle is an easily accessible organ that covers large areas of the skin and harbors distinct populations of stem cells, probably owing to its diverse developmental (ecto-mesodermal) origin [2–4, 13, 29]. Previous studies showed that cells from the dermal papilla/sheath of rodent [13, 14] and human hair follicles [16, 17] displayed characteristics of mesenchymal stem cells but human HF-MSCs have not been investigated in detail. Here we addressed two questions: (i) how does in vitro culture affect the proliferation and multi-lineage differentiation potential of hHF-MSCs; and (ii) are hHF-MSCs clonally multipotent? We found that hHF-MSCs are highly proliferative cells that can be maintained in culture for ~45 population doublings before they begin to show signs of cellular senescence. Gene expression profiling and functional assays demonstrated that hHF-MSCs can differentiate to myogenic, osteogenic, adipogenic and chondrogenic lineages. Interestingly, although adipogenesis decreased significantly over time in culture, myogenesis and chondrogenesis decreased to a much lesser extent even after 11 passages, while osteogenic capacity was highest at intermediate passages. In addition, the majority of hHF-MSCs were clonally multipotent, suggesting that they may present an alternative source of easily accessible, autologous stem cells for tissue engineering and regenerative medicine.
hHF-MSCs displayed high proliferation potential over several passages. Based on the average number of population doublings per passage (2.5–3.5), it was estimated that hHF-MSCs underwent ~36 population doublings during the first 12 passages. Addition of 8–10 population doublings that took place during the initial isolation and expansion phase brings the total number between 44–46 population doublings. This compares favorably with previous reports estimating 13–25 population doublings for human BM-MSCs [30], although admittedly more accurate comparison would require that both HF-MSCs and BM-MSCs be isolated from the same donors and account for sex and age differences. Regardless, during the first two weeks of cell isolation a single scalp hair follicle can give rise to approximately 5×10⁴ MSCs, which then undergo ~36 additional population doublings yielding ~1015 cells. Given that the density of hair follicles in the scalp is over 200 follicles/cm2 [31] and that most of them are in the anagen phase for prolonged times, the potential of hHF-MSC as a stem cell source for regenerative medicine is very promising.
As expected, there was significant upregulation of early and late lineage-specific genes during hHF-MSCs differentiation. Smooth muscle specific genes such as α SMA, SM22 and myocardin were upregulated significantly during myogenic induction. Interestingly, expression of myocardin displayed a periodic kinetic pattern with maxima on days 3 and 5 following the change of culture medium on days 2 and 4. This kinetic pattern suggested that myocardin was highly induced by TGF-β1 (several hundred fold induction on days 3 and 5) but decreased fast (within one day), suggesting that its message might be highly unstable. Similarly, Runx2, ALP and osteonectin were significantly upregulated during osteogenic induction, which is consistent with their role in osteogenesis [26, 32]. Interestingly, ALP increased by more than 200-fold during the first week of osteogenic induction and was further increased to 300-fold during the third week. During chondrogenic induction, the transcription factor Sox9 exhibited a two-step upregulation. Within the first 3–4 days it increased quickly by 50-fold, where it was maintained for two weeks before it increased again to 150-fold within two days. Interestingly, the second induction coincided with increased aggrecan message, suggesting that a threshold concentration of Sox9 may be required to promote aggrecan expression, possibly by binding of Sox9 to the aggrecan promoter [33]. Type X collagen was also highly expressed during chondrogenic differentiation. Interestingly, the adipose-specific peroxisome proliferator-activated receptor gamma (PPARγ), the master regulator of adipogenic differentiation [34, 35], the early marker, lipoprotein lipase [23] and the late marker, leptin [24] were sequentially upregulated during adipogenic induction of hHF-MSCs. PPARγ was observed immediately and increased moderately by about 8-fold. Lipoprotein lipase was observed during the second week and continued to increase during the third week reaching a very high expression level of about 50,000-fold. Finally, leptin was expressed during the third week of induction and increased 250-fold by day 21. These gene expression profiles suggested that hHF-MSCs possesses multi-lineage expression potential similar to other MSCs from bone marrow or adipose tissue.
Previous studies reported that the differentiation potential of human MSCs from bone marrow, umbilical cord or adipose tissue decreased with time in culture [30, 36–38], prompting us to determine the differentiation potential of hHF-MSCs as a function of time in culture and examine whether the differentiation ability of hHF-MSCs varied among the four lineages. Differentiation to the myogenic lineage was examined by flow cytometry, immunostaining and hydrogel compaction - a measure of the SMC force generation ability. Surprisingly, these experiments revealed a relatively limited decrease in myogenic differentiation potential even after 11 passages in culture (more than 33 population doublings). Interestingly, the fraction hHF-MSCs expressing αSMA - a key smooth muscle cell marker - increased to more than 80% at P8 and a significant fraction of cells (~50%) continued to be αSMA+ even at P11. In agreement with the biochemical assays, fibrin gel compaction showed that hHF-MSCs maintained the ability to generate force and contract hydrogels even at P11, suggesting that hHF-MSCs may be a good source of functional SMCs for tissue engineering.
The chondrogenic differentiation of hHF-MSCs decreased gradually over time in culture but a significant fraction of cells maintained their chondrogenic potential even at P11 as evidenced by alcian blue staining. On the other hand, the hHF-MSCs osteogenic potential was highest at intermediate passages (P8) and decreased significantly at P11, as evidenced by calcium phosphate deposition. Finally, the adipogenic differentiation ability of hHF-MSCs was most sensitive to in vitro culture; it decreased rapidly with every passage and almost diminished by P11. These results are in agreement with a recent study demonstrating that BM-MSCs lost their adipogenic ability quickly but maintained their osteogenic potential even at late passages [30]. Interestingly, loss of adipogenic differentiation potential was prevented by the adhesion of human BM-MSCs to denatured type I collagen, suggesting a critical role of extracellular matrix in maintenance of stem cell multipotency [39]. It remains to been seen whether a combination of extracellular matrix and diffusible signals can also maintain the multipotency of hHF-MSCs, even after prolonged culture times as required to obtain the number of cells necessary for cellular therapies.
Notably, clonal analysis of hHF-MSCs demonstrated that the majority of clones (73%) possessed bi- or tri-lineage differentiation potential, which was significantly higher compared to clones derived from dermal fibroblasts [40], suggesting that the hair follicle may be a richer source of multipotent cells than the dermis. Interestingly, 78% of the bi-potent clones (11 out of 14) displayed both chondrogenic and osteogenic potential, in agreement with previous studies reporting that factors promoting (or decreasing) osteogenic potential promoted (or decreased) chondrogenic potential as well [41]. A recent study reported that cells originating from the dermal compartment of the follicle are the precursors of the dermal stem cell and can contribute to dermal maintenance and wound healing [42]. Accordingly, it would be interesting to examine whether hHF-MSCs can differentiate into the different skin cell types such as epidermal keratinocytes. In addition, previous studies showed that skin derived precursors that were isolated from neurospheres in a suspension culture gave rise to both neural and mesodermal progenitors [43], suggesting that hHF-MSCs might possess similar potential as well. Collectively, our results suggest that hHF-MSCs are highly proliferative and clonally multipotent stem cells that may provide an easily accessible stem cell source for tissue engineering and regenerative medicine.
MATERIALS AND METHODS
Isolation and cultivation of human Hair Follicle Mesenchymal Stem Cells (hHF-MSCs)
Isolation of hHF-MSCs was performed as described previously [16, 17]. Briefly human scalp skin tissues were obtained from the Cooperative Human Tissue Network (CHTN, Philadelphia, PA). Small (2mm × 4mm) pieces of skin were digested with 0.5% Collagenase Type I (Invitrogen, Carlsbad, CA) in DMEM (Dulbecco’s Modified Eagle Medium, GIBCO, Grand Island, NY) at 37ºC with occasional agitation for 3–4 hr. Single hair follicles were unplugged, washed extensively and seeded each in a well of a 24-well plate (BD Biosciences, San Jose, CA) with 500 μL of DMEM supplemented with 10%FBS (Fetal Bovine Serum; GIBCO). Over the next 7–10 days, cells migrated out onto the culture plate and proliferated. Only wells containing cells originating from the dermal sheath or papilla (fibroblast-like cells) were used in this study, whereas wells containing epithelial cells (keratinocytes) were discarded. Wells containing cells far from the hair follicle were also discarded to ensure that cells originated from the follicle and not from remnants of dermal tissue that might have been carried over accidentally. Expanded cells were cultured in proliferation media (DMEM supplemented with 10% MSC FBS (GIBCO) and 1 ng/mL bFGF, (BD Biosciences)) and the medium was replenished every other day unless otherwise indicated.
For determining the proliferation potential of hHF-MSCs, 3000 cells/cm2 were seeded in triplicates at the indicated passage number. On the fourth day, cells were counted and the number of population doublings was calculated assuming geometric growth. To identify senescent cells in culture, we performed senescence associated β-Galactosidase (SA-β-Gal) staining (Cell Signaling, Danvers, MA) according to manufacturer’s instructions and the ratio of total peri-nuclear blue cells to total number cells was determined in 10 images per passage (each image contains approximately 50 cells).
Adipogenic, Chondrogenic, Myogenic and Osteogenic differentiation of hHF-MSCs
To determine the differentiation capacity of hHF-MSCs towards the myogenic, osteogenic, chondrogenic or adipogenic lineage, 6×10³ cells/cm2 were seeded in tissue culture plates and cultured in proliferation medium until they reached confluence. The next day, the proliferation medium was replaced with the appropriate differentiation medium as indicated. Thereafter, the differentiation medium was replenished every two days for myogenic lineage and every 3 days for adipogenic, chondrogenic and osteogenic lineage.
For adipogenesis, hHF-MSCs were cultured in DMEM supplemented with 10% MSC FBS (Invitrogen), 0.5 mM of isobutyl-methylxanthine (Sigma, St Louis, MO), 1 μM of dexamethasone (Sigma), 10 μM of insulin (Sigma) and 200 μM of indomethacin (MP Biomedicals, Solon, OH) for 14 days. For chondrogenesis, differentiation was performed on cell culture dishes as previously described [44]. Briefly, hHF-MSCs were cultured in DMEM supplemented with 10% MSC FBS, 6.25 μg/ml insulin, 10 ng/ml TGF-β 1 (US Biological, Swampscott, MA) and 50 nM of ascorbate-2-phosphate (Sigma) for 21 days. For myogenic induction, hHF-MSCs were cultured in DMEM supplemented with 10% MSC FBS and 2 ng/mL TGF-β1(US biological) for 6 days. For osteogenesis, hHF-MSCs were cultured in DMEM supplemented with 10% MSC FBS, 0.1 μM dexamethasone, 50 μM ascorbate-2-phosphate and 10mM β-glycerolphosphate (Alfa Aesar, Ward Hill, MA) for 28 days.
Oil Red O staining
After two weeks in culture in adipogenic medium cells were fixed with 10% formalin at room temperature for 60 min and then incubated with 60% (v/v) isopropanol for 5 min at room temperature. Then hHF-MSCs were dried and incubated with 0.6% (w/v) filtered Oil red O in 60% isopropanol/40% water (Alfa Aesar) at room temperature for 10 min and washed four times with water to remove any unbound dye. The cells were imaged using a Zeiss Axio Observer (Zeiss, Thornwood, NY) inverted microscope and photographed with an ORCA-ER CCD camera (Hamamatsu, Japan). Quantification of images containing oil droplets was performed using ImageJ software [45].
Alcian Blue staining
After 3 weeks of culture in chondrogenic differentiation medium, the cells were fixed with 4% para-formaldehyde (RT; 10 min), stained with 0.5% Alcian Blue (Sigma) in 0.1N HCl (PH=1.0) overnight and washed with water. Mosaic images were taken using a Zeiss Axio Observer inverted microscope. Alcian blue stained area was quantified using ImageJ software.
Von Kossa staining
The degree of osteogenesis of hHF-MSCs was evaluated by Von Kossa staining (Diagnostic Biosystems, Pleasanton, CA). Briefly, after 28 days in osteogenic differentiation medium cells were fixed in 4% paraformaldehyde (RT; 60min) and incubated with 1% (w/v) silver nitrate solution in dark (RT;30 min). After several washes cells were exposed to UV light for 60 min followed by incubation with 5% (w/v) of sodium thiosulfate (RT; 5min) to remove any un-reacted silver nitrate. Mosaic images were taken using a Zeiss Axio Observer inverted microscope. Calcium phosphate deposition area was quantified using Image J.
Gel compaction assay
To compare the ability of differentiated smooth muscle cells to generate force at different passages we performed fibrin gel compaction assay as described previously [17]. Briefly, 1×10⁶ cells were mixed with 800μL of fibrinogen, which was induced to polymerize with addition of 200μL thrombin in a 24-well plate at 37°C. The concentrations of fibrinogen and thrombin in the resulting fibrin gel were 2.5mg/mL and 2.5 U/mL respectively. After one hour incubation, the gels were released from the surface of the plate and the initial area of the gel (t=0 hr) was captured by an imaging system (UVP, Upland, CA) and measured using Image J. Fibrin gels were cultured in myogenic medium and at the indicated times the area (A) of each gel was measured and normalized to the initial area (A0).
Immunocytochemistry
Immunocytochemistry was performed as described previously [17]. Briefly, cells were fixed (4% paraformaldehyde), permeabilized (PBS with 0.1% triton X-100), blocked (1%BSA/0.01% triton X-100 ) and incubated with one of the following antibodies: mouse anti-human αSMA (1:50; 4°C overnight; Serotec, Raleigh, NC), mouse anti-human calponin (1:50; 4°C overnight; Dako, Carpinteria, CA) or rabbit anti-human myosin heavy chain (1:100; 4°C overnight; Biomedical Technologies, Stoughton, MA,) diluted in blocking buffer. Subsequently the cells were incubated with Alexa Fluor 488 or 594-conjugated goat anti-mouse (1:100; 1 hr at RT; Invitrogen) and counter-stained with Hoechst nuclear dye (1:400 in PBS; 10 min; Sigma). Cells that were incubated with only secondary antibody served as negative controls.
Flow Cytometry
Cells expressing αSMA were measured by flow cytometry as described previously [17]. Briefly, on the fourth day of myogenic differentiation cells were resuspended in 4% ice cold paraformaldehyde, permeabilized with PBS containing 0.1% w/v saponin (MP Biomedical, Inc., Irvine, CA, USA) and 0.05% w/v NaN3 (Fisher Scientific, PA, USA) for 10 min and blocked with blocking buffer (0.1% w/v saponin, 0.05% w/v NaN3, 1% BSA in PBS) for 30 min. Cells were then incubated for 1 hr with mouse anti-human αSMA (1:50 in blocking buffer, Serotec) followed by incubation with Alexa Fluor 488-conjugated goat anti-mouse secondary antibody (1:100 dilution, Invitrogen) for 30 min. As a negative control, cells were incubated with only secondary antibody. After secondary antibody incubation cells were resuspended in PBS and run in a FACS Calibur flow cytometer (Becton Dickinson).
RNA isolation and cDNA synthesis
At the indicated times total RNA was isolated using Promega’s RNA isolation kit (Promega Corporation, Madison, WI) according to manufacturer’s instructions. First strand cDNA was synthesized from total RNA using superscript III reverse transcriptase (GIBCO) and oligo dT primer (GIBCO).
Quantitative real time PCR
To determine the kinetics of gene expression during differentiation, quantitative real time PCR was performed with the SYBR Green Kit (Bio-Rad, Hercules, CA) according to manufacturer instructions (see Supplemental Table 1 for primer sets). The level of each mRNA was quantified using the ΔCT method and normalized with the expression level of the housekeeping gene, RPL32. The specificity of each product was verified by gel electrophoresis.
Clonal differentiation potential of hHF-MSCs
Passage 4 hHF-MSCs were plated using the limiting dilution method (1 cell/well) in 96-well plates. All wells were examined daily and those containing more than one cell were discarded for further analysis. Single cell clones were cultured for 15–20 days in proliferation medium. Selected clonal populations showing the highest proliferation capacity were further expanded into 48 well plates. Finally, thirty seven clones in total were induced towards osteogenic, adipogenic or chondrogenic lineage and the degree of differentiation was assessed by Von Kossa, Oil Red O and Alcian Blue staining, respectively.
Statistical analysis
Data were expressed as mean ± standard deviation and statistical significance (defined as p<0.05) was determined using Student’s t-test. For the kinetics of gene expression, we performed one way ANOVA (statistical significance defined as p<0.05) followed by post-hoc analysis (Fisher’s method with statistical significance defined as p<0.05).
Supplementary Material
Flow cytometry for MSC specific surface marker proteins as indicated. (A) hHF-MSCs; (B) hBM-MSCs. Representative histograms from three independent experiments are shown here.
Highlights.
Hair follicle derived mesenchymal stem cells (HF-MSC) are clonally multipotent, and therefore, they constitute a population of true stem cells.
hHF-MSC show higher proliferation potential than bone marrow (BM)-MSC.
Gene expression profiling shows that upon differentiation HF-MSC express lineage specific genes in chronological order and to a high extent.
The ability of hHF-MSC to differentiate towards the myogenic and chondrogenic lineages is maintained over time in culture.
The ability of hHF-MSC to differentiate towards the osteogenic and especially the adipogenic lineage is significantly compromised by long-term culture.
Acknowledgments
This work was supported by grants from the National Institutes of Health (R01 HL086582) and the New York State Stem Cell Science (NYSTEM Contract #C024316) to S.T. Andreadis.
Footnotes
Publisher's Disclaimer: This is a PDF file of an unedited manuscript that has been accepted for publication. As a service to our customers we are providing this early version of the manuscript. The manuscript will undergo copyediting, typesetting, and review of the resulting proof before it is published in its final citable form. Please note that during the production process errors may be discovered which could affect the content, and all legal disclaimers that apply to the journal pertain.
References
- 1.Paus R, Cotsarelis G. The biology of hair follicles. N Engl J Med. 1999;341:491–497. doi: 10.1056/NEJM199908123410706. [DOI] [PubMed] [Google Scholar]
- 2.Cotsarelis G, Sun TT, Lavker RM. Label-retaining cells reside in the bulge area of pilosebaceous unit: implications for follicular stem cells, hair cycle, and skin carcinogenesis. Cell. 1990;61:1329–1337. doi: 10.1016/0092-8674(90)90696-c. [DOI] [PubMed] [Google Scholar]
- 3.Morris RJ, Liu Y, Marles L, Yang Z, Trempus C, Li S, Lin JS, Sawicki JA, Cotsarelis G. Capturing and profiling adult hair follicle stem cells. Nat Biotechnol. 2004;22:411–417. doi: 10.1038/nbt950. [DOI] [PubMed] [Google Scholar]
- 4.Tumbar T, Guasch G, Greco V, Blanpain C, Lowry WE, Rendl M, Fuchs E. Defining the epithelial stem cell niche in skin. Science. 2004;303:359–363. doi: 10.1126/science.1092436. [DOI] [PMC free article] [PubMed] [Google Scholar]
- 5.Alonso L, Fuchs E. The hair cycle. J Cell Sci. 2006;119:391–393. doi: 10.1242/jcs.02793. [DOI] [PubMed] [Google Scholar]
- 6.Taylor G, Lehrer MS, Jensen PJ, Sun TT, Lavker RM. Involvement of follicular stem cells in forming not only the follicle but also the epidermis. Cell. 2000;102:451–461. doi: 10.1016/s0092-8674(00)00050-7. [DOI] [PubMed] [Google Scholar]
- 7.Amoh Y, Li L, Katsuoka K, Penman S, Hoffman RM. Multipotent nestin-positive, keratin-negative hair-follicle bulge stem cells can form neurons. Proc Natl Acad Sci U S A. 2005;102:5530–5534. doi: 10.1073/pnas.0501263102. [DOI] [PMC free article] [PubMed] [Google Scholar]
- 8.Yu H, Kumar SM, Kossenkov AV, Showe L, Xu X. Stem cells with neural crest characteristics derived from the bulge region of cultured human hair follicles. J Invest Dermatol. 2010;130:1227–1236. doi: 10.1038/jid.2009.322. [DOI] [PMC free article] [PubMed] [Google Scholar]
- 9.Schneider MR, Schmidt-Ullrich R, Paus R. The hair follicle as a dynamic miniorgan. Curr Biol. 2009;19:R132–142. doi: 10.1016/j.cub.2008.12.005. [DOI] [PubMed] [Google Scholar]
- 10.Jahoda CA, Horne KA, Oliver RF. Induction of hair growth by implantation of cultured dermal papilla cells. Nature. 1984;311:560–562. doi: 10.1038/311560a0. [DOI] [PubMed] [Google Scholar]
- 11.McElwee KJ, Kissling S, Wenzel E, Huth A, Hoffmann R. Cultured peribulbar dermal sheath cells can induce hair follicle development and contribute to the dermal sheath and dermal papilla. J Invest Dermatol. 2003;121:1267–1275. doi: 10.1111/j.1523-1747.2003.12568.x. [DOI] [PubMed] [Google Scholar]
- 12.Reynolds AJ, Lawrence C, Cserhalmi-Friedman PB, Christiano AM, Jahoda CA. Trans-gender induction of hair follicles. Nature. 1999;402:33–34. doi: 10.1038/46938. [DOI] [PubMed] [Google Scholar]
- 13.Jahoda CA, Whitehouse J, Reynolds AJ, Hole N. Hair follicle dermal cells differentiate into adipogenic and osteogenic lineages. Exp Dermatol. 2003;12:849–859. doi: 10.1111/j.0906-6705.2003.00161.x. [DOI] [PubMed] [Google Scholar]
- 14.Hoogduijn MJ, Gorjup E, Genever PG. Comparative characterization of hair follicle dermal stem cells and bone marrow mesenchymal stem cells. Stem Cells Dev. 2006;15:49–60. doi: 10.1089/scd.2006.15.49. [DOI] [PubMed] [Google Scholar]
- 15.Lako M, Armstrong L, Cairns PM, Harris S, Hole N, Jahoda CA. Hair follicle dermal cells repopulate the mouse haematopoietic system. J Cell Sci. 2002;115:3967–3974. doi: 10.1242/jcs.00060. [DOI] [PubMed] [Google Scholar]
- 16.Liu JY, Peng HF, Gopinath S, Tian J, Andreadis ST. Derivation of functional smooth muscle cells from multipotent human hair follicle mesenchymal stem cells. Tissue engineering Part A. 2010;16:2553–2564. doi: 10.1089/ten.tea.2009.0833. [DOI] [PMC free article] [PubMed] [Google Scholar]
- 17.Liu JY, Peng HF, Andreadis ST. Contractile smooth muscle cells derived from hair-follicle stem cells. Cardiovascular research. 2008;79:24–33. doi: 10.1093/cvr/cvn059. [DOI] [PubMed] [Google Scholar]
- 18.Peng HF, Liu JY, Andreadis ST, Swartz DD. Hair follicle-derived smooth muscle cells and small intestinal submucosa for engineering mechanically robust and vasoreactive vascular media. Tissue engineering Part A. 2011;17:981–990. doi: 10.1089/ten.tea.2010.0109. [DOI] [PMC free article] [PubMed] [Google Scholar]
- 19.Kinner B, Zaleskas JM, Spector M. Regulation of smooth muscle actin expression and contraction in adult human mesenchymal stem cells. Exp Cell Res. 2002;278:72–83. doi: 10.1006/excr.2002.5561. [DOI] [PubMed] [Google Scholar]
- 20.Narita Y, Yamawaki A, Kagami H, Ueda M, Ueda Y. Effects of transforming growth factor-beta 1 and ascorbic acid on differentiation of human bone-marrow-derived mesenchymal stem cells into smooth muscle cell lineage. Cell Tissue Res. 2008;333:449–459. doi: 10.1007/s00441-008-0654-0. [DOI] [PubMed] [Google Scholar]
- 21.Owens GK. Regulation of differentiation of vascular smooth muscle cells. Physiol Rev. 1995;75:487–517. doi: 10.1152/physrev.1995.75.3.487. [DOI] [PubMed] [Google Scholar]
- 22.Wang Z, Wang DZ, Pipes GC, Olson EN. Myocardin is a master regulator of smooth muscle gene expression. Proc Natl Acad Sci U S A. 2003;100:7129–7134. doi: 10.1073/pnas.1232341100. [DOI] [PMC free article] [PubMed] [Google Scholar]
- 23.Ailhaud G. Early adipocyte differentiation. Biochem Soc Trans. 1996;24:400–402. doi: 10.1042/bst0240400. [DOI] [PubMed] [Google Scholar]
- 24.MacDougald OA, Hwang CS, Fan H, Lane MD. Regulated expression of the obese gene product (leptin) in white adipose tissue and 3T3-L1 adipocytes. Proc Natl Acad Sci U S A. 1995;92:9034–9037. doi: 10.1073/pnas.92.20.9034. [DOI] [PMC free article] [PubMed] [Google Scholar]
- 25.Gregoire FM, Smas CM, Sul HS. Understanding adipocyte differentiation. Physiol Rev. 1998;78:783–809. doi: 10.1152/physrev.1998.78.3.783. [DOI] [PubMed] [Google Scholar]
- 26.Komori T, Yagi H, Nomura S, Yamaguchi A, Sasaki K, Deguchi K, Shimizu Y, Bronson RT, Gao YH, Inada M, Sato M, Okamoto R, Kitamura Y, Yoshiki S, Kishimoto T. Targeted disruption of Cbfa1 results in a complete lack of bone formation owing to maturational arrest of osteoblasts. Cell. 1997;89:755–764. doi: 10.1016/s0092-8674(00)80258-5. [DOI] [PubMed] [Google Scholar]
- 27.Akiyama H, Chaboissier MC, Martin JF, Schedl A, de Crombrugghe B. The transcription factor Sox9 has essential roles in successive steps of the chondrocyte differentiation pathway and is required for expression of Sox5 and Sox6. Genes Dev. 2002;16:2813–2828. doi: 10.1101/gad.1017802. [DOI] [PMC free article] [PubMed] [Google Scholar]
- 28.Zuscik MJ, Hilton MJ, Zhang X, Chen D, O’Keefe RJ. Regulation of chondrogenesis and chondrocyte differentiation by stress. J Clin Invest. 2008;118:429–438. doi: 10.1172/JCI34174. [DOI] [PMC free article] [PubMed] [Google Scholar]
- 29.Yu H, Fang D, Kumar SM, Li L, Nguyen TK, Acs G, Herlyn M, Xu X. Isolation of a novel population of multipotent adult stem cells from human hair follicles. Am J Pathol. 2006;168:1879–1888. doi: 10.2353/ajpath.2006.051170. [DOI] [PMC free article] [PubMed] [Google Scholar]
- 30.Wagner W, Horn P, Castoldi M, Diehlmann A, Bork S, Saffrich R, Benes V, Blake J, Pfister S, Eckstein V, Ho AD. Replicative senescence of mesenchymal stem cells: a continuous and organized process. PLoS One. 2008;3:e2213. doi: 10.1371/journal.pone.0002213. [DOI] [PMC free article] [PubMed] [Google Scholar]
- 31.Barman JM, Astore I, Pecoraro V. THE NORMAL TRICHOGRAM OF THE ADULT. J Invest Dermatol. 1965;44:233–236. doi: 10.1038/jid.1965.42. [DOI] [PubMed] [Google Scholar]
- 32.Ducy P, Zhang R, Geoffroy V, Ridall AL, Karsenty G. Osf2/Cbfa1: a transcriptional activator of osteoblast differentiation. Cell. 1997;89:747–754. doi: 10.1016/s0092-8674(00)80257-3. [DOI] [PubMed] [Google Scholar]
- 33.Sekiya I, Tsuji K, Koopman P, Watanabe H, Yamada Y, Shinomiya K, Nifuji A, Noda M. SOX9 enhances aggrecan gene promoter/enhancer activity and is up-regulated by retinoic acid in a cartilage-derived cell lineTC6. J Biol Chem. 2000;275:10738–10744. doi: 10.1074/jbc.275.15.10738. [DOI] [PubMed] [Google Scholar]
- 34.Chawla A, Schwarz E+, Dimaculangan DD, Lazar MA. Peroxisome proliferator-activated receptor (PPAR) gamma: adipose-predominant expression and induction early in adipocyte differentiation. Endocrinology. 1994;135:798–800. doi: 10.1210/endo.135.2.8033830. [DOI] [PubMed] [Google Scholar]
- 35.Tontonoz P, Hu E, Graves RA, Budavari AI, Spiegelman BM. mPPAR gamma 2: tissue-specific regulator of an adipocyte enhancer. Genes Dev. 1994;8:1224–1234. doi: 10.1101/gad.8.10.1224. [DOI] [PubMed] [Google Scholar]
- 36.Kern S, Eichler H, Stoeve J, Kluter H, Bieback K. Comparative analysis of mesenchymal stem cells from bone marrow, umbilical cord blood, or adipose tissue. Stem Cells. 2006;24:1294–1301. doi: 10.1634/stemcells.2005-0342. [DOI] [PubMed] [Google Scholar]
- 37.Banfi A, Bianchi G, Notaro R, Luzzatto L, Cancedda R, Quarto R. Replicative aging and gene expression in long-term cultures of human bone marrow stromal cells. Tissue Eng. 2002;8:901–910. doi: 10.1089/107632702320934001. [DOI] [PubMed] [Google Scholar]
- 38.Kretlow JD, Jin YQ, Liu W, Zhang WJ, Hong TH, Zhou G, Baggett LS, Mikos AG, Cao Y. Donor age and cell passage affects differentiation potential of murine bone marrow-derived stem cells. BMC Cell Biol. 2008;9:60. doi: 10.1186/1471-2121-9-60. [DOI] [PMC free article] [PubMed] [Google Scholar]
- 39.Mauney JR, Volloch V, Kaplan DL. Matrix-mediated retention of adipogenic differentiation potential by human adult bone marrow-derived mesenchymal stem cells during ex vivo expansion. Biomaterials. 2005;26:6167–6175. doi: 10.1016/j.biomaterials.2005.03.024. [DOI] [PubMed] [Google Scholar]
- 40.Chen FG, Zhang WJ, Bi D, Liu W, Wei X, Chen FF, Zhu L, Cui L, Cao Y. Clonal analysis of nestin(-) vimentin(+) multipotent fibroblasts isolated from human dermis. J Cell Sci. 2007;120:2875–2883. doi: 10.1242/jcs.03478. [DOI] [PubMed] [Google Scholar]
- 41.Mastrogiacomo M, Cancedda R, Quarto R. Effect of different growth factors on the chondrogenic potential of human bone marrow stromal cells. Osteoarthritis Cartilage. 2001;9(Suppl A):S36–40. doi: 10.1053/joca.2001.0442. [DOI] [PubMed] [Google Scholar]
- 42.Biernaskie J, Paris M, Morozova O, Fagan BM, Marra M, Pevny L, Miller FD. SKPs derive from hair follicle precursors and exhibit properties of adult dermal stem cells. Cell Stem Cell. 2009;5:610–623. doi: 10.1016/j.stem.2009.10.019. [DOI] [PMC free article] [PubMed] [Google Scholar]
- 43.Toma JG, Akhavan M, Fernandes KJ, Barnabe-Heider F, Sadikot A, Kaplan DR, Miller FD. Isolation of multipotent adult stem cells from the dermis of mammalian skin. Nat Cell Biol. 2001;3:778–784. doi: 10.1038/ncb0901-778. [DOI] [PubMed] [Google Scholar]
- 44.Asahina I, Sampath TK, Nishimura I, Hauschka PV. Human osteogenic protein-1 induces both chondroblastic and osteoblastic differentiation of osteoprogenitor cells derived from newborn rat calvaria. J Cell Biol. 1993;123:921–933. doi: 10.1083/jcb.123.4.921. [DOI] [PMC free article] [PubMed] [Google Scholar]
- 45.Abramoff MD, Magelhaes PJ, Ram SJ. Image Processing with ImageJ. Biophotonics International. 2004;11:36–42. [Google Scholar]
Associated Data
This section collects any data citations, data availability statements, or supplementary materials included in this article.
Supplementary Materials
Flow cytometry for MSC specific surface marker proteins as indicated. (A) hHF-MSCs; (B) hBM-MSCs. Representative histograms from three independent experiments are shown here.