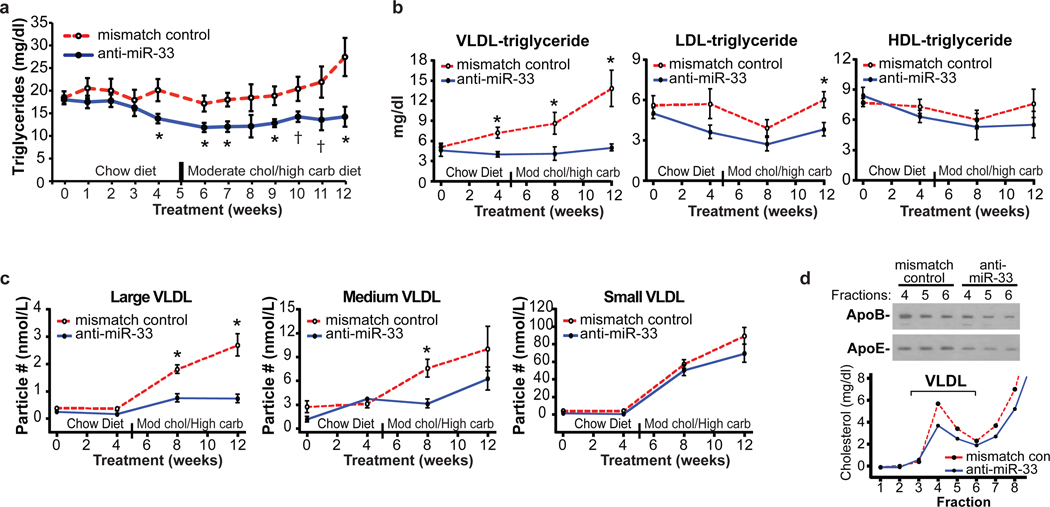
Figure 4. Triglyceride and VLDL Particle Analysis.
Levels of plasma (a) total triglyceride, (b) VLDL-triglyceride, LDL-triglyceride or HDL-triglyceride from anti-miR treated monkeys. *P ≤ 0.05; † P ≤ 0.1. (c) Quantification of small, medium and large VLDL particle number by NMR spectroscopy. *P ≤ 0.05. (d) Western blot of apoE and apoB in VLDL fractions obtained from FPLC fractionation of plasma.

