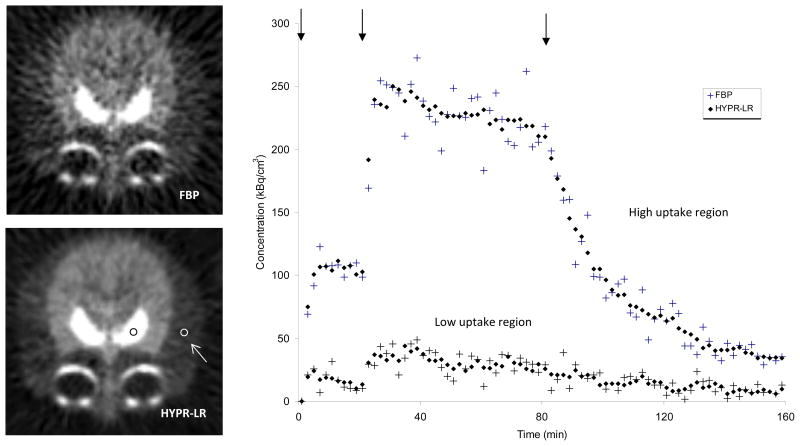
FIGURE 5.
HYPR-LR processing in study with rapid changes in PET signal. PET images represent single 2-min time frame (at 28 min after injection) of 18F-fallypride in brain of rhesus monkey. This PET study consisted of 3 injections with radiolabeled and unlabeled fall-ypride at 0 (168 MBq, 4.2 nmol), 20 (189 MBq, 10.3 nmol), and 80 min (0 MBq, 100 nmol), as indicated by arrows in graph. Graph represents time–activity curves from 4-voxel ROI with high and low radiotracer uptake, indicated by circles in bottom image.

