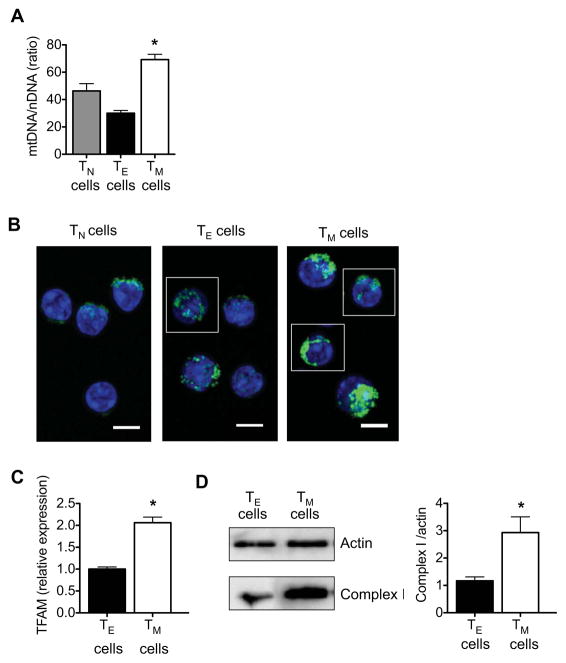
Figure 4. CD8+ TM cells have greater mitochondrial mass than CD8+ TE cells.
Spleens and lymph nodes were harvested from naive and LmOVA infected mice, and TN, TE, and TM cells were isolated. (A) mtDNA/nDNA ratio (data are shown as mean ± SEM, figure generated from 2 independent experiments) *P < 0.01 for TE vs TM cells, and < 0.05 for TN vs TM cells. (B) Confocal images show TN, TE and TM cells stained with Mitotracker (green) and Hoechst (blue), scale bars are 5 microns. (C) Relative mitochondrial transcription factor A (TFAM) mRNA expression (data are shown as mean ± SEM, figure generated from 2 independent experiments) *P = 0.01, and (D) Western analysis for complex I expression (bars depict quantification of densitometry from 3 blots) *P = 0.008. Data are representative of 2 independent experiments.

