

Abstract
Mutations in the postsynaptic scaffolding gene SHANK2 have recently been identified in individuals with autism spectrum disorder (ASD) and intellectual disability. However, the cellular and physiological consequences of these mutations in neurons remain unknown. We have analyzed the functional impact caused by two inherited and one de novo SHANK2 mutations from ASD individuals (L1008_P1009dup, T1127M, R462X). Although all three variants affect spine volume and have smaller SHANK2 cluster sizes, T1127M additionally fails to rescue spine volume in Shank2 knock-down neurons. R462X is not able to rescue spine volume and dendritic branching and lacks postsynaptic clustering, indicating the most severe dysfunction. To demonstrate that R462X when expressed in mouse can be linked to physiological effects, we analyzed synaptic transmission and behavior. Principal neurons of mice expressing rAAV-transduced SHANK2-R462X present a specific, long-lasting reduction in miniature postsynaptic AMPA receptor currents. This dominant negative effect translates into dose-dependent altered cognitive behavior of SHANK2-R462X-expressing mice, with an impact on the penetrance of ASD.
INTRODUCTION
Autism spectrum disorder (ASD) comprises a group of genetically heterogeneous neurodevelopmental disorders with an estimated prevalence of 1% in the childhood population. ASD is characterized by an impairment of social interaction and communication, accompanied by a pattern of repetitive and restrictive behavior, typically diagnosed in the first 3 years of life (1). It can either occur as a single entity, in combination with intellectual disability (ID) or associated with genetic syndromes such as Fragile X and Rett syndrome (2). Rare variants seem to play a much greater role in autism risk than common variants (3).
Autism manifests before the age of 3 years and persists throughout life. The first few years of life are also the time during which synaptic contacts between neurons are established, strengthened and remodeled. The formation and maturation of synapses is a tightly regulated process ensuring correct connections between neurons and a defined balance between excitatory and inhibitory input. A remarkable number of genes that are crucial for synaptogenesis and synapse function have been reported in recent years to cause various psychiatric and neurological disorders including ASD (4,5), promoting the hypothesis that synaptic plasticity in the brain is essential for our ability to learn, memorize and socially communicate.
In previous studies, mutations and copy number variations in the scaffolding gene SHANK2 have been reported in individuals with ASD and ID (6,7). SHANK2 is a member of a family of scaffold proteins (comprising SHANK1, 2 and 3) that localize to the postsynaptic site of excitatory synapses in the central nervous system (8). SHANKs are among the most abundant scaffolding proteins which co-ordinate the organization of the postsynaptic density (PSD). They interact with each other and other core scaffolding proteins of the PSD (e.g. PSD95, Homer and GKAP) and form a mesh-like structure for the assembly of various postsynaptic proteins and signaling molecules (9). SHANK proteins also link iono- and metabotropic glutamate receptor complexes together and to the cytoskeleton. The largest neuronal isoform of SHANK2 (6,10) is specifically expressed in the brain and contains an SH3 domain followed by a PDZ domain, a long proline-rich region and a C-terminal SAM domain (Fig. 1A).
Figure 1.

Overexpression of SHANK2 mutants R462X, L1008_P1009dup and T1127M in primary hippocampal neurons. (A) SHANK2 WT and mutant constructs fused N-terminal with mCherry. SH3 (Src homology 3), PDZ (postsynaptic density 95/discs large/zona occludens-1), proline-rich region and SAM (sterile alpha motif) indicate the functional domains of SHANK2. Binding motifs for Homer (H), Dynamin 2 (D) and Cortactin (C) are indicated. (B) Western blot analysis displaying the sizes of the different SHANK2 constructs. Endogenous SHANK2 is not present in HEK293 cells. (C) Representative hippocampal neurons transfected with GFP in addition to overexpression with mCherry-SHANK2 WT, mCherry-SHANK2-R462X, mCherry-SHANK2-L1008_P1009dup or the mCherry-SHANK2-T1127M mutant. Scale bars: 10 µm (main panels); 2.5 µm (insets). (D) SHANK2 WT, the T1127M and the L1008_P1009dup mutant are located at functional synapses opposed to the presynaptic marker synapsin 1 (indicated by arrows). In contrast, the truncated SHANK2 mutant R462X did not cluster at functional synapses. Scale bars: 2 µm. (E) Quantitative analysis of the clustering behavior of the SHANK2 mutants shown in (A). The average pixel intensity in dendrites versus spine heads was measured to determine the SCR for WT and mutants. SCR = 1 indicates no clustering or even distribution, SCR = 0 indicates complete clustering. (F) Cumulative distribution of SHANK2 WT, L1008_P1009dup and T1127M cluster sizes. The R462X mutant did not cluster at all. SHANK2 WT clusters are larger compared with the two mutants. Kolmogorov–Smirnov test: WT/L1008_P1009dup P< 10−9 D = 0.121; WT/T1127M P< 10−7 D = 0.077 (n = 3, 18 neurons for each condition).
To unravel the functional activity of SHANK2 variants, we have carried out a comprehensive functional analysis of variants with low (L1008_P1009dup, T1127M) and high (R462X) penetrance (6). The analysis ranged from morphological studies in cultured hippocampal neurons to virus-based gene expression in mice for electrophysiological and behavioral analyses of the SHANK2 variants ex vivo and in vivo, respectively. We here report that previously identified SHANK2 mutations have distinct consequences on morphological (L1008_P1009dup, T1127M, R462X) and electrophysiological (R462X) properties of synapses that are paralleled by behavioral abnormalities in the intact animal.
RESULTS
SHANK2 variants are misplaced and functionally altered
To uncover the functional activity of rare SHANK2 variants, we investigated the effects of an R462X stop mutation, an L1008_P1009 duplication and a T1127M missense variant that were all detected in patients with ASD (6). The R462X mutation occurred de novo while the duplication and the missense variants were both inherited from apparently healthy mothers. We selected these two inherited variants because they localize at highly conserved positions in SHANK2; the T1127M mutation resides in the highly conserved Dynamin-2-binding motif and the L1008_P1009dup mutation in direct vicinity to the Homer-binding motif, suggesting that this may alter SHANK2 protein function. Mothers with the T1127M and L1008_P1009dup variants had a family history of learning difficulties or developmental delay.
To study the effects of the SHANK2 variants on the morphology of primary neurons, we overexpressed all three variants and the SHANK2 wild-type (WT) in primary hippocampal neurons as mCherry fusion proteins (Fig. 1A). Western analysis in HEK293 cells indicated an identical size of SHANK2 WT and variant L1008_P1009dup and T1127M using a SHANK2 primary antibody, whereas the stop mutation (R462X) resulted in the truncation of the protein (Fig. 1B).
In primary hippocampal neurons, SHANK2-WT exclusively accumulated in dendritic spines and localized postsynaptically to synapsin 1 (Fig. 1C and D). In contrast, the truncated SHANK2 (R462X) was evenly distributed throughout the dendrites and accumulated in the cell soma. The R462X variant did not co-localize with synapsin 1, suggesting that it is not efficiently targeted to functional synapses (Fig. 1C and D). The T1127M and the L1008_P1009dup variant still localized to synapses (Fig. 1C and E) but displayed smaller protein accumulations in the spines, compared with WT (Fig. 1F).
To analyze the effect of the variants on dendritic spine volume, we transfected primary hippocampal neurons with GFP and mCherry-SHANK2 fusion constructs (Supplementary Material, Fig. S1A). High-resolution z-stack images of GFP-positive neurons were taken with a confocal laser scanning microscope to measure the fluorescence intensity of GFP within the three-dimensional projections, which in turn allowed us to calculate the relative spine volumes. Overexpressing SHANK2-WT, we detected a significant increase in dendritic spine volume, similar to previously described findings (11) (Supplementary Material, Fig. S1A and B). For the SHANK2 mutants, we found in three independent experiments, analyzing more than 3600 spines from 18 neurons for each condition, that the SHANK2-R462X stop mutant entirely lacks the potential to increase spine volume (Supplementary Material, Fig. S1A and B). Similarly, also the SHANK2-T1127M and the L1008_P1009dup variants had no significant effect on the increase in spine volume (Supplementary Material, Fig. S1C). The lack of SHANK2 protein function of the stop mutant (R462X) might be caused by its misplaced localization due to the loss of the C-terminal SAM domain and the adjacent binding motifs for the interaction with Homer, Cortactin and Dynamin 2. In contrast, SHANK2-T1127M and the L1008_P1009dup might affect SHANK2 protein function rather than localization because they both still localize to dendritic spines but display significantly smaller clusters that might result in an altered PSD organization. These results provide first evidence that all three variants are impaired in function, with the most striking defect seen for the displaced R462X mutant.
SHANK2 variants fail to rescue Shank2 knock-down in primary hippocampal neurons
To investigate the effect of reduced SHANK2 protein levels as predicted for individuals with ASD with a de novo microdeletion of the SHANK2 gene (6), we performed RNAi-mediated knock-down of Shank2 in primary hippocampal neurons. We used two shRNAs (#1, #2), which target different regions of Shank2 efficiently. HEK293 cells were co-transfected with either of the two shRNAs and Shank2 from Rattus norvegicus or human SHANK2. Rat Shank2 expression was specifically reduced but the expression of rat Shank1, rat Shank3 and human SHANK2 was not altered, indicating specificity (Supplementary Material, Fig. S2A). In shRNA#2-transfected cortical neurons, the endogenous Shank2 protein level was almost 50% reduced as indicated by western blot analysis (Supplementary Material, Fig. S2B). Similarly, in cultured hippocampal neurons, endogenous Shank2 protein levels were reduced by approximately half with both shRNAs, as measured by counting the number of Shank2 puncta along the dendrites (Fig. 2A and D). The reduced Shank2 expression significantly decreased spine volume (Fig. 2A and E), but had no effect on spine density (Fig. 2G). Reduced spine volume was accompanied by a significant decrease in the number of functional synapses along the dendrites indicated by co-localization of the postsynaptic marker PSD95 and the presynaptic marker Synapsin 1 (Fig. 2C and F). Under control conditions (control-shRNA), the majority of dendritic spines show a mature mushroom-shaped morphology, whereas the knock-down of Shank2 presented thin filopodia-like immature spines in the majority of cells (Fig. 2A). Hippocampal neurons with reduced Shank2 expression furthermore showed an increase of dendritic complexity (Fig. 2B). We performed Sholl analysis by counting the intersections of dendrites with overlay of concentric rings at 25 µm intervals centered on the cell soma, to describe the amount and distribution of dendrites. The total number of dendritic branches was significantly increased in Shank2 knock-down neurons compared with the GFP control conditions (Fig. 2H), with an accelerated growth of dendrites close to the cell soma (Fig. 2I).
Figure 2.

shRNA-mediated knock-down of endogenous Shank2 reduces spine volume and increases dendritic arborization. (A) Representative figures of rat hippocampal neurons co-transfected with GFP and control shRNA (co-shRNA), shRNA#1 or shRNA#2, directed against Shank2. Knock-down of Shank2 results in many thin filopodia-like dendritic spines, most of them do not contain Shank2, whereas most spines under control conditions are mushroom-shaped and express Shank2 in their spine heads (indicated by arrows). Scale bar, 4 µm. (B) Representative neurons demonstrating that loss of Shank2 increases the complexity of the dendritic arbor. Scale bar, 23 µm. (C) Co-staining of primary hippocampal neurons with the presynaptic marker synapsin 1 (blue) and the postsynaptic marker PSD 95 (red). Shank2 knock-down neurons show a decrease in synaptic density. Scale bar, 2.5 µm. (D) Quantification of the Shank2 knock-down in primary hippocampal neurons. Bars represent the overall density of Shank2 puncta within a defined dendritic area. Both shRNAs significantly reduce the Shank2 puncta density (shRNA#1 P = 2.2 × 10⁻⁷; shRNA#2 P = 8.9 × 10⁻⁹). (E) Quantitative analysis of the relative dendritic spine volume. The shRNAs significantly reduce spine volume (shRNA#1 P = 2 × 10⁻¹⁸; shRNA#2 P = 2 × 10⁻¹⁹) (n = 3, 4200 spines from 21 neurons for each condition). (F) Shank2 knock-down reduces the synaptic density in primary hippocampal neurons. Synapse number was determined by counting the number of dendritic spines positive for PSD-95/synapsin that co-cluster along the dendritic area (shRNA#1 P = 4.3 × 10⁻¹²; shRNA#2 P = 4.4 × 10⁻¹¹). (G) Knock-down of Shank2 had no effect on dendritic spine density (n = 3 experiments, 18 neurons for each condition). (H and I) Quantification of the dendritic complexity by Sholl analysis. (H) Shank2 knock-down increases the total number of intersections (shRNA#1 P = 2.1 × 10⁻⁵; shRNA#2 P = 0.002). (I) Loss of Shank2 increases dendritic material proximal to the soma relative to control conditions. P-values are still significant across the different groups after correction for multiple testing by the Bonferroni method P ≤ 0.005 (D–I). All values are shown as mean ± SD. **P ≤ 0.01, ***P ≤ 0.001; shRNA values are always compared with the GFP control. Control shRNA has no significant effect on the parameters. ANOVA P< 0.001, P-values of post hoc Scheffé tests are given (D, F, H and I) (n = 3, 30 neurons for each condition).
We next asked whether SHANK2 WT and mutants are able to rescue the Shank2 knock-down phenotype in primary hippocampal neurons by co-transfection of shRNA#2 (directed against rShank2) with either the human SHANK2-WT or one of the three variants, respectively. Human SHANK2-WT and the duplication variant (L1008_P1009dup) were able to rescue the knock-down-mediated phenotype, normalizing both the dendritic spine volume and dendritic arbor development (Fig. 3A and C). In contrast, the R462X and T1127M variant could not rescue the reduced spine volume (Fig. 3A). As shown in Figure 3B, expression of SHANK2-WT reduces the total number of intersections below GFP control levels. In contrast to these findings, overexpression of SHANK2 has no effect on dendritic arbor development. In the Sholl analysis, the distribution of dendritic material throughout the neuron and the total number of intersections was not altered (Supplementary Material, Fig. S3). Comparing the degree of rescue obtained with either human SHANK2-WT or the three variants, we can demonstrate that only the R462X variant fails to rescue the excessive branching to a normal level, an effect that fades out 75 µm away from the cell body (Fig. 3B and C). In this respect, the missense and duplication variants behave like WT normalizing the number of intersections. The R462X mutant has the most severe effect on the neuronal morphology, whereas the duplication shows no functional loss in the rescue experiment. The loss-of-function effect of the T1127M variant is restricted to the dendritic spines. Given the disparate effects of different Shank2 mutants on dendrite and spine morphology, this suggests that either Shank2 is involved in the regulation of two separate pathways controlling dendrite or spine morphology, respectively, or that spine growth is more sensitive to a reduction in Shank2 activity compared with dendrite arborization.
Figure 3.
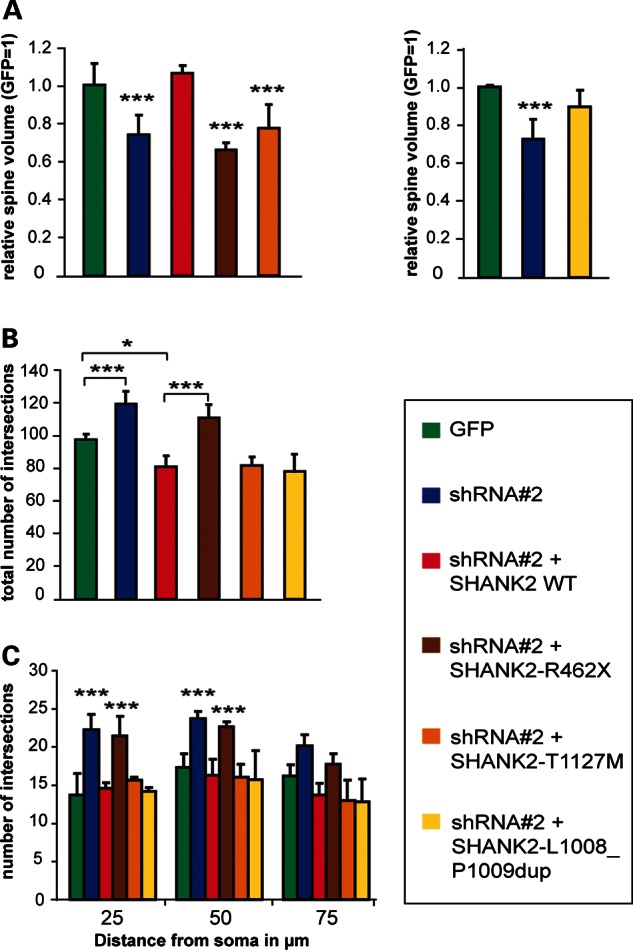
Rescue of Shank2 knock-down. (A) Human SHANK2 WT protein normalizes spine volume in Shank2 knock-down neurons, whereas the SHANK2 R462X and the T1127M mutants have lost this ability (shRNA#2 P = 4.4 × 10⁻⁷; SHANK2-WT P = 0.787; R462X mutant P = 4.7 × 10⁻¹¹, T1127M mutant P = 1.4 × 10⁻⁵; compared against GFP; n = 3, 21 neurons for each condition). The L1008_P1009dup mutant rescues the spine volume to some extent but is not as efficient as WT protein (GFP/shRNA#2 P = 4.4 × 10⁻⁷, GFP/L1008_P1009dup P = 0.066). (B and C) Human WT SHANK2, the T1127M and the duplication variants normalize dendritic arborization in SHANK2 knock-down neurons, as determined by Scholl analysis. In contrast, the R462X mutation is not able to rescue the increased dendritic branching. (B) Analysis of the total amount of intersections. Pair-wise P-values: GFP/shRNA P = 0.001, GFP/SHANK2-WT P = 0.024, SHANK2-WT/R462X P = 2.3 × 10⁻⁶; SHANK2-WT/T1127M and SHANK2-WT/L1008_P1009dup P-values are not significant. Only the R462X mutant fails to rescue the excessive dendritic branching, whereas the two missense variants behave like WT. (C) Distribution of intersections across the neuron. The R462X mutant is not able to rescue the increase in branching near the cell body within a distance of 50 µm (n = 3, 30 neurons for each condition). Values for T1127M, L1008_P1009dup and Shank2-WT are similar to the GFP control. *P ≤ 0.05, ***P ≤ 0.001, ANOVA P< 0.001; P-values of post hoc Scheffé test are given.
Miniature EPSCs are specifically reduced by SHANK2-R462X overexpression
We next studied the physiological effects of R462X in vivo by rAAV-mediated gene delivery of Venus-tagged R462X into the hippocampus of adult mice. Three weeks after rAAV infections, at postnatal day P69 ± 1, the ex vivo recordings of isolated AMPAR-mediated miniature excitatory postsynaptic currents (mEPSCs, see Materials and Methods) of Venus-positive CA1 pyramidal cells showed that the average mEPSC amplitude was significantly reduced by ∼26% in SHANK2-R462X-infected neurons compared with SHANK2-WT overexpressing and WT neurons (Fig. 4A, Supplementary Material, Table S1). Since in age-matched mice the mEPSC amplitude between control and SHANK2-WT expressing cells is not significantly different, we conclude that R462X has a direct pathophysiological effect by reducing the mEPSC amplitude. The mEPSC frequency was similar for all groups, indicating that the SHANK2-R462X expression mainly affects AMPA-receptor-mediated postsynaptic excitatory transmission. No changes in mEPSC decay times between groups were detected. Analysis of inhibitory transmission (12) into the same cells (see Materials and Methods) showed that the amplitude and frequency distributions of spontaneous inhibitory currents (mIPSCs) were similar across experimental groups. Thus, neither the inhibitory drive in principal neurons nor the root mean square (RMS) current noise levels, input resistance and other neuronal control properties were affected by the overexpression of SHANK2-R462X (Fig. 4A, Supplementary Material, Table S1).
Figure 4.

Expression of SHANK2-R462X in the hippocampal CA1 cells is correlated with reduced mEPSCs in mice and causes morphological changes in vivo. (A) Top: Diagram of rAAV constructs containing SHANK2-WT and SHANK2-R462X. Bottom (left): Fluorescence confocal images of the hippocampal area CA1 in brain sections of adult mice injected at P42 with rAAV-Venus2A-SHANK2-WT and rAAV-Venus-SHANK2-R462X. Bottom (center): Cumulative amplitude distributions for mEPSCs and mIPSCs recorded at P69 ± 1 from CA1 pyramidal cells in brain slices from SHANK2-WT (green) and SHANK2-R462X (blue) infected mice. SHANK2-R462X mice display intact inhibitory signaling, but ∼26% reduced AMPAR-mediated transmission. This is reflected as a leftward shift of the distribution of mEPSC amplitudes. Group-average mEPSC and mIPSC traces acquired from the same cells (see Materials and Methods). Decay-time constants for the miniature currents are all similar (mIPSC, control: 14.8 ± 0.3, n = 16; SHANK2-WT: 17.3 ± 1.1, n = 18; SHANK2-R462X: 16.8 ± 1.3, n = 21; F(2,51) = 1.6119, P = 0.1339). Right: Summary graphs for averaged mEPSC and mIPSC amplitudes and frequencies. No differences in mEPSC frequency were detected. This indicates that the mutation affects postsynaptic excitatory transmission. The anti-GFP immunostaining reflects a volume labeling of soluble Venus released in Venus-2A-SHANK2-WT-expressing cells, whereas the Venus-SHANK2-R462X is expressed as Venus fusion protein with an enriched nuclear localization as also noticed in transfected primary neurons. (B) Top: Confocal fluorescence images of Venus-positive pyramidal cells in the hippocampal area CA1 and cortical layer 2/3 (right) injected at P0 with rAAV-Venus2A-SHANK2-WT and rAAV-Venus-SHANK2-R462X. Scale bar, 10 μm. Bottom (left): Cumulative amplitude distributions for mEPSCs and mIPSCs recorded from CA1 pyramidal cells from Shank2-WT (green) and SHANK2-R462X (blue) P0-infected mice at P100 ± 2 (average of 300 mPSCs per cell per mouse). P0-injected mice produced consistent results: SHANK2-R462X displays an ∼33% reduction in AMPAR-mediated transmission without differences in mPSC decay-kinetics [mEPSC (in ms), SHANK2-WT: 4.4 ± 0.6, n = 20; SHANK2-R462X: 3.4 ± 0.3, n = 22; F(1,39) = 1.4303, P = 0.2387; mIPSC decay-time (in ms), SHANK2-WT: 16.1 ± 0.9, n = 20; SHANK2-R462X: 14.0 ± 2.0, n = 22; F(1,39) = 3.0959, P = 0.0861] or in mPSC frequencies [mIPSC frequencies (in Hz), SHANK2-WT: 8.6 ± 0.5, n = 20; SHANK2-R462X: 7.7 ± 0.5, n = 22; F(1,39) = 1.8317, P = 0.1835]. Bottom (right): Cumulative amplitude distributions for mEPSCs and mIPSCs recorded from infected pyramidal neurons in EC layer 2/3 at P69 + 1. SHANK2-R462X mice present an ∼17% reduction of AMPAR but no change in GABAA-R-mediated transmission [mean mIPSC amplitude (in pA), SHANK2-WT: 23.6 ± 1.2, n = 21; SHANK2-R462X: 23.8 ± 1.3, n = 24; one-way ANOVA, F(1,41) = 0.0127, P = 0.9106]. mPSC frequency [mIPSC frequency (in Hz), SHANK2-WT: 5.9 ± 0.6, n = 21; SHANK2-R462X: 5.9 ± 0.4, n = 24; F(1,41) = 0.0090, P = 0.9246] and mPSC decay kinetics [mEPSC-decay time, SHANK2-WT: 6.1 ± 0.3, n = 20; SHANK2-R462X: 5.7 ± 0.6, n = 21; F(1,41) = 0.9733, P = 0.3294; mIPSC-decay time (in ms), SHANK2-WT: 13.3 ± 0.7, n = 21; SHANK2-R462X: 11.2 ± 0.4, n = 24; F(1,41) = 3.9014, P = 0.5119] were similar for both groups. (C) GluA1 cluster staining of SHANK2-R462X mice compared with GFP control overexpressing mice. Left panel shows the overview of GluA1 staining in the CA1 region of a P0 infected hippocampus. Scale bar, 10 μm. Confocal stacks were taken from rAAV-Syn-Venus-SHANK2-R462X and rAAV-Syn-GFP infected stratum radiatum regions of the hippocampus. Center and right panels: Overlaying red dots show the GluA1 stained clusters as they were counted in ImageJ. Scale bar, center, 5 μm; right, 2.5 μm. (D) Statistical analysis shows significant differences of GluA1 cluster number and cluster size between SHANK2-R462X and GFP overexpressing animals (P < 0.0001). (E) Golgi staining of SHANK2-R462X P0 infected hippocampal CA1 neurons and PBS P0 treated hippocampal CA1 neurons. The SHANK2-R462X mice showed densely packed filopodia structures instead of mature spines. Scale bar, 5 μm. *P ≤ 0.05, ***P ≤ 0.001.
Next, we investigated whether viral SHANK2-R462X transduction by injection of rAAV into the brains of newborn mice (13) was long lasting. We injected Venus-tagged SHANK2-WT and Venus-tagged SHANK2-R462X at P0 and recorded mEPSCs and mIPSCs 3 months later in brain slices (Fig. 4B). Venus-positive pyramidal cells located either in the hippocampal CA1 region or in layer 2/3 of the entorhinal cortex (EC) were selected for recordings (Fig. 4B). The average mIPSC amplitude and frequency obtained from Venus-positive CA1 and from layer 2/3 pyramidal cells remained similar between rAAV SHANK2-WT and rAAV SHANK2-R462X mutant infected mice, as in the CA1 cells of adult injected mice (Fig. 4B). In contrast, however, the average mEPSC amplitudes from SHANK2-R462X-expressing CA1 and layer 2/3 pyramidal cells (Fig. 4B) were decreased by ∼33 and ∼17%, respectively, compared with corresponding SHANK2-WT-expressing cells. The mEPSC frequency and other control neuronal parameters were similar across groups (Supplementary Material, Table S1), demonstrating that the persistent expression of SHANK2-R462X leads to a postsynaptically localized reduction of AMPA-receptor-mediated currents.
However, the high-resolution analysis of the AMPA receptor distribution at CA1 synapses in the stratum radiatum revealed an increased size and number of AMPA receptor clusters in adult SHANK2-R462X-expressing mice compared with GFP-expressing controls (Fig. 4C and D). The Golgi stain showed densely packed filopodia structures instead of mature spines at CA1 dendrites of SHANK2-R462X-expressing mice (Fig. 4E), which might indicate that AMPA receptor clusters in the neuropil of SHANK2-R462X mice are not localized at active synapses. This hypothesis is supported by the reduced surface expression of AMPA receptors in primary hippocampal neurons overexpressing SHANK2-R462X. By immunostaining, we observed a subtle but significant decrease in AMPA receptor cluster sizes at spine heads of neurons overexpressing SHANK2-R462X in comparison with GFP/mCherry control conditions (Supplementary Material, Fig. S4). A reduced amount of AMPA receptors at the spines of neurons is consistent with the decrease in mEPSC currents observed in mice.
In summary, we conclude that the expression of SHANK2-R462X for 2–3 weeks in the brain of adult mice has a dominant negative effect. SHANK2-R462X expression is sufficient to reduce the amplitude, but not the kinetics of excitatory AMPAR-mediated transmission. It does not affect the inhibitory drive converging into SHANK2-R462X-expressing cells, and it leads to changes in spine structures and AMPA receptor distribution.
Postnatally expressed SHANK2-R462X mutant alters mouse cognitive behavior
The strong and persistent expression of SHANK2-R462X in the brain of P0 injected mice might permit a first behavioral analysis of mice overexpressing SHANK2-R462X in the neocortex. We used well-established tests for locomotor activity, novel object exploration and executive functions that have been previously shown to be sensitive to altered AMPA receptor signaling (14,15).
The postmortem analysis of the mouse brains showed that the GFP signal in rAAV-injected mice (P0) was 5-fold stronger than the signal for Venus of rAAV-SHANK2-R462X injected mice 7 months after injection (Fig. 5A and C). In both mouse cohorts, the GFP as well as the Venus-SHANK2-R462X expression was prominent in the cortex and hippocampus (Fig. 5B and D). By quantitative immunoblotting, the rAAV-injected mice could be divided into high (H) and low (L) expressing mice (Fig. 5D), whereas the endogenous AMPA receptor subunit levels for GluA1 and GluA2 and the amount of phosphorylated GluA1 isoforms GluA1-S831 and GluA1-S845 were unchanged in both groups (Fig. 5E). Since the viral transduced genes are not expressed ubiquitously, alteration in AMPA receptor expression or phosphorylation cannot be excluded at the cellular level.
Figure 5.
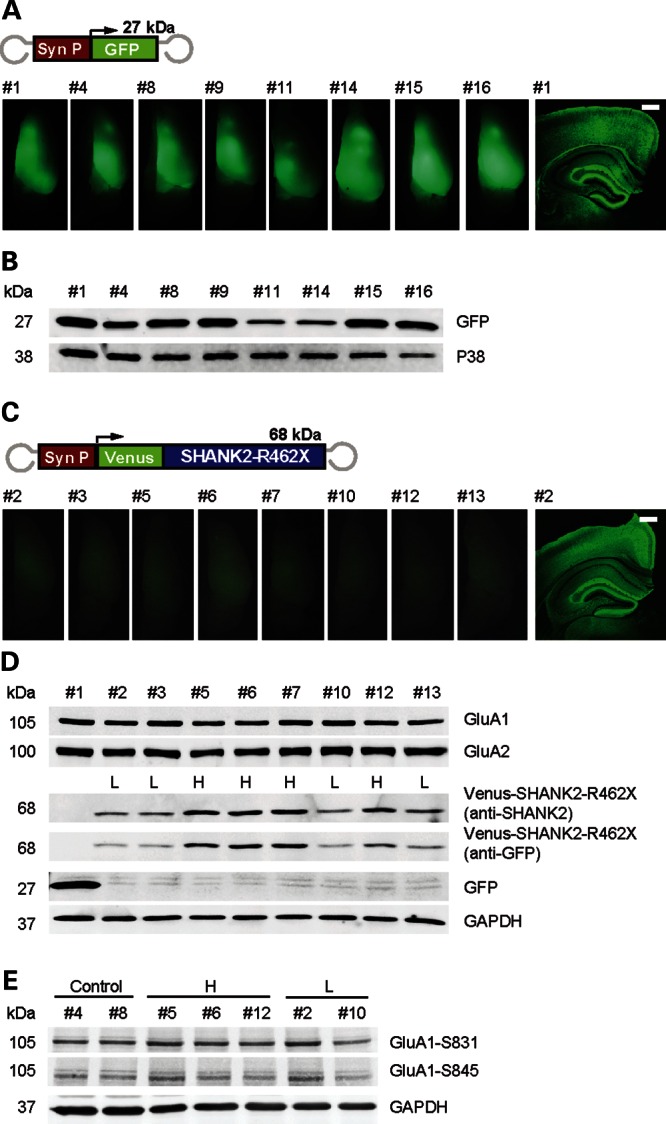
Strong expression of SHANK2-R462X in the forebrain of mice can be monitored by changes in the behavior. (A) Grouping of rAAV-Syn-GFP P0 injected mice. Fluorescence overview images of one brain hemisphere from eight mice at P210 ± 2 (mouse numbers are indicated). Scale bar, 500 µm. On the right, a fluorescence overview image of a coronal brain section from mouse number1 (#1) is depicted. Scale bar, 500 µm. (B) Immunoblot analysis of hippocampal extracts prepared from mice shown in (A). (C) Grouping of rAAV-Syn-Venus-SHANK2-R462X P0 injected mice. Diagram of rAAV-Syn-Venus-SHANK2-R462X vector. Overview image of one brain hemisphere from eight injected mice at P210 ± 2. Exposure conditions were kept constant compared with the middle row in (A). A color-adjusted overview image of the coronal brain section from mouse number 2 (#2) is given on the right. (D) Immunoblot analysis of hippocampal extracts from the mice described in the middle rows. The anti-SHANK2 and anti-GFP antibodies identified relative levels of SHANK2-R462X expression (relative quantification from left to right 2.1, 2.2, 3.4, 3.3, 3.7, 1.9, 3.0, 1.9). Mice were divided into low-expression (L) and high-expression (H) groups. Immunosignals obtained with anti-GluA1, anti-GluA2 were comparable between all animals. (E) Anti-Phospho-Ser831-GluA1 and anti-Phospho-Ser845-GluA1 antibody showed no difference of phosphorylated GluA1 between low-expression and high-expression animals.
For a closer behavioral analysis, we divided the group of rAAV-SHANK2-R462X-expressing mice in high and low expressing animals (Fig. 5) by a post hoc median split. At the age of 3–4 months, all mice showed comparable body weight and regular locomotor behavior in the rotarod and in the open field test (Fig. 6A and data not shown). In the open-field test, however, when a novel object was introduced into the center of the open arena, only AAV-GFP control injected mice showed the expected high exploration rate of the novel object (P< 0.01), whereas both SHANK2-R462X-expressing groups did not exhibit significant increase in object exploration (Fig. 6B). Moreover, we subjected the mice to an escape task testing executive functions [the so-called puzzle box test (15)] in which the animals have to escape from a lit compartment into a dark compartment, with increasing difficulty of escape strategies from trial 1 to 11. In this test, high-level SHANK2-R462X-expressing mice showed a significant impairment (P< 0.01) compared with low level and GFP-expressing mice, respectively, in the more difficult trials requiring elaborated escape strategies (Fig. 6D). This phenotype was not confounded by alterations in anxiety behavior, since all groups showed similar emotional behavior in a standardized light–dark box test with simple escape possibilities (Fig. 6C). In summary, our data demonstrate that the postnatal expression of the SHANK2-R462X in mice can lead to impaired cognitive functions.
Figure 6.

Behavioral analyses of adult mice expressing SHANK2_R462X (shown in Fig. 5). (A) Both SHANK2-R462X-L and -H cohorts showed unaltered activity in the open field when compared with GFP-expressing controls. (B) In the novel object test, group comparisons by two-way ANOVA exhibited differences in the goal region depending on the presence of the novel object (F(1,26) = 7.951; P< 0.01). Post hoc tests demonstrated that only GFP-expressing controls exhibited significantly higher object approaches after introducing the object into the center of the arena. (C) No difference of anxiety-related behavior (time spent in lit compartment) was found in the light–dark box test. (D) In the puzzle box test, the transition from the light to the dark compartment through a gate (trials 1 and 11) or a tunnel (trials 2–9) requires altering strategies as indicated at the bottom. The tunnel is open in trials 2–4, filled with sawdust in trials 5–7 and covered by a plug in trials 8–10, whereas trial 11 corresponds to trial 1. Repeated-measures ANOVA exhibited a significant genotype effect (F(2,130) = 4,298; P< 0.05), whereas Bonferroni-corrected analyses showed a significant impairment of SHANK2-R462X-high expressing mice compared with both other groups during trial 10. *P ≤ 0.01.
DISCUSSION
The neuropathological significance of rare variants in ASD has been difficult to assess in the past. We have now experimentally analyzed two groups of mutations identified in patients with ASD: a de novo stop mutation and a missense and duplication mutant that were inherited from apparently normal mothers. Transmitted variants with variable penetrance are commonly termed ‘unclassified variants’ since the genetic background is critical for their phenotypic expression. To address whether functional differences exist between mutations with high and low penetrance, we carried out overexpression and rescue experiments in primary hippocampal neurons. We can demonstrate that all three analyzed mutants are loss-of-function mutations, yet of variable phenotypic range and intensity with respect to alterations in spine volume, dendritic arbor complexity and postsynaptic clustering. Whereas the duplication variant presented the mildest, the R462X variant presented the most severe phenotype.
What may be the underlying molecular mechanisms of the different phenotypes? The duplication of L1008_P1009dup resides in the prolin-rich region, in the vicinity of the Homer-binding motif. This might translate into only a subtle structural change of minor interference with SHANK2 functions. The T1127M exchange in the highly conserved Dynamin-2-binding site might disturb the interaction of SHANK2 with Dynamin 2. This could result in altered glutamate receptor trafficking and interfere with other processes of postsynaptic membrane turnover (16). SHANK2 is connected to the actin cytoskeleton via Cortactin and to metabotropic glutamate receptors via Homer. The truncated R462X mutant lost the binding motifs for Homer, Cortactin and Dynamin 2 as well as the C-terminal SAM domain, which is essential for the correct localization of the protein (17). R462X is mislocalized and therefore likely lost the connection to metabotropic glutamate receptors and to the actin cytoskeleton, suggesting that multiple functions of the protein are disrupted. In contrast, the T1127M and duplication variants seem to disturb only one functional aspect of the SHANK2 protein and therefore have a more subtle effect on neuronal morphology. Thus, different variants have different limitations: the L1008_1009dup mutation can rescue the Shank2 knock-down, yet in the overexpression experiment it is not able to increase spine volume as much as SHANK2 WT protein. The T1127M mutation is able to rescue the dendritic arbor phenotype but not the spine volume and also cannot increase spine volume when overexpressed. The functional effect of these two variants suggests that they represent a risk factor for ASD rather than being sufficient to cause the full-blown ASD phenotype. These data strongly suggest that more than one variant (of different genes) will need to be affected in these cases to reach the threshold for a fully penetrant phenotype.
To study the effect of the most dysfunctional SHANK2 variant R462X in vivo, overexpression experiments were carried out using a virus-based delivery system in the CNS of mice. We could show that the loss of function of R462X correlates with dominant negative effects, as demonstrated by a reduced average mEPSC amplitude in principal neurons expressing endogenous Shank2 protein. Since the very same neurons showed comparable inhibitory drive and the mEPSC kinetics were similar to those from uninfected cells, a postsynaptic reduction in the density of AMPA receptors might be the primary reason for the reduced amplitude of spontaneous excitatory activity into these neurons. This view is supported by our finding that SHANK2-R462X expression leads to a reduction of AMPA receptors in spine heads. Furthermore, the analysis of the total number of AMPA receptor subunit levels and AMPA receptor clusters in the stratum radiatum of the hippocampus showed that the reduced AMPA receptor currents are not due to a reduced AMPA receptor expression but may be mediated instead by alterations in the distribution of synaptic and extrasynaptic AMPA receptors in those neurons expressing SHANK2-R462X. The direct effect of SHANK2-R462X on AMPA receptor distribution and AMPA receptor currents is supported.
We speculate that the distribution of synaptic AMPA receptors is altered only in those neurons expressing SHANK2-R462X and therefore cannot be biochemically detected by a cell population analysis of neurons on western blot. The direct effect of SHANK2-R462X on AMPA receptor currents is supported by the finding that the reduction of mEPSCs could already be observed in principal neurons 2 weeks after SHANK2-R462X expression in adult mice, excluding that only deficiencies during maturation or activity-dependent modulation of the neuronal networks result in a phenotype.
The dominance of SHANK2-R462X also became apparent in the behavioral performance of mice overexpressing this variant postnatally, leading to impaired cognitive functions. The behavior analysis was used as a read-out for the physiological effect of the variant and should not be considered a model for ASD in the mouse. Impairments were detected in novel object exploration and in the puzzle box, where mice showed reduced interest to novel objects and failed to solve more complex executive functions in a dose-dependent way. It has to be considered, however, that the viral mediated gene transfer leads to a strong mosaic expression of SHANK2-R462X. For this reason, we cannot differentiate whether the number of neurons expressing SHANK2-R462X or its expression level is crucial. Mouse models with well-defined SHANK2-R462X expression or SHANK2 haploinsufficiency are required to reveal whether the observed behavioral phenotypes in our viral transduced SHANK2-R462X mouse models can be recognized as an experimental mirror image for autistic disorder in humans.
Haploinsufficiency of SHANK2 might be one parameter underlying ASD. By RNA interference, we could show that knock-down of Shank2 leads to thin immature and filopodia-like dendritic spines, with a reduced number of synaptic contacts in primary hippocampal neurons of Rattus norvegicus, which is consistent with the findings reported by Grabrucker et al. (18). Spine morphology is known to be intimately linked to synapse function: smaller spines are usually correlated with smaller synapses and reduced synaptic transmission (19). The striking increase in dendritic arbor structures in neurons lacking Shank2 has not been described before and likely reflects a loss of strong synaptic contacts, since dendritic arbor development and stabilization are tied to the strength of synaptic inputs received by the developing neuron (20). Loss of Shank2 might therefore cause defects in synaptic signal processing or result in a misbalance between excitatory and inhibitory signals in the brain of individuals with ASD and ID.
Our data further indicate that the reduction of Shank2 alone is sufficient to elicit a spine phenotype, suggesting that there is no obvious redundancy to the other Shank members in the context of spine morphology. Shank2 is the first family member to appear at PSDs, whereas the recruitment of Shank3 and Shank1 occurs later in development (18). Shank2 is therefore likely involved in the initial steps of PSD assembly, and may have a function in the signal-dependent recruitment and cross-linking of the other Shank paralogs. Although SHANK3 mutations have been shown to cause ASD, ID and schizophrenia (21,22), Shank1 has not been associated with any disease phenotype yet. Mice lacking Shank3 show an autistic-like phenotype with an altered neuronal connectivity (23).
Individuals with ASD often present ID. In postmortem studies of individuals with ASD, effects on the dendritic and spine morphology have been described but the pattern of neuropathology is very heterogenous (24). Comparing the morphological alterations seen in cultured hippocampal neurons by Shank2 knock-down with the literature, an almost identical effect on spine morphology was noted to the RNAi-mediated knock-down of the PAK3 and ARHGEF6 ID genes (25). In addition, postmortem brain material of individuals with Fragile X, the most common inherited cause of ID, displays remarkably similar features with altered dendritic spine morphology and a large proportion of abnormally long, thin, filopodia-like, immature dendritic spines (26). Yet, it is not clear if the excess of filopodia-like spines in Fragile X patients represents functional synapses or immature synaptic precursors.
Proteins like FMRP and SHANK are central regulators of synaptic organization and function and genetic defects of these genes have effects on spine morphology and synaptic function. This may result in an imbalance of excitatory and inhibitory synaptic signaling and thereby disturb the homeostasis of the complex neuronal networks (5), demonstrating how defects in different genes can result in comparable clinical outcomes. Re-establishing the balance between excitatory and inhibitory signaling in the brain might therefore be a suitable therapeutic approach. GABAA receptor agonists and mGluR5 antagonists are presently being tested in clinical studies in both individuals with autism and Fragile X syndrome (27).
MATERIALS AND METHODS
Ethics statement
All experimental procedures were performed according to the animal welfare guidelines of the Max Planck Society (Charles River). Animal experiments were performed under the license at the Regierungspräsidium Karlsruhe 35-915.81/G-71/10, 35-915.81/G-56/02 and 35-915.81/G-49/09.
Plasmid constructs
Cloning of SHANK2, with the partial coding sequence from KIAA1022fg00613 clone (accession number AB028945, Kazusa DNA Research Institute, Japan), into the pENTR2B vector (Invitrogen) was via SalI and EcoRV restriction sites, and SalI and PshAI in the KIAA construct. The N-terminal part of SHANK2 was PCR-amplified from human brain cDNA, introducing a SalI restriction site at the 5′end. The PCR product was inserted into pENTR2B-KIAA1022 using SalI and SacI, resulting in pENTR2B-SHANK2-WT. Mutagenesis was performed using the QuikChange Lightning Site-directed Mutagenesis Kit (Stratagene) on 70 ng of SHANK2 WT plasmid to generate the L1008_P1009dup, T1127M and R462X mutants. Each clone was purified with the Pure Yield Plasmid Midiprep System (Promega) and sequenced to rule out additional mutations. For fluorescence image analysis, the SHANK2 WT and mutant constructs were transferred to pcDNA3.1-mCherry-DEST vector using the Gateway recombinant technology (Invitrogen). The cloning of Shank2 from Rattus norvegicus was performed using cDNA from the rat brain P18 prefrontal cortex as a template for PCR, with the primers amplifying the smallest neuronal isoform of rat-Shank2, introducing an N-terminal BamHI and a C-terminal NotI restriction site. The PCR fragment was cloned into pENTR3C (Invitrogen) and then transferred into pcDNA3.1-FLAG-DEST vector (generated in our laboratory). The pSUPER RNAi expression system was used for siRNA-mediated knock-down of SHANK2. Two independent pSUPER constructs were generated with BglI and HindIII restriction sites (see primer sequences). The co-shRNA is described elsewhere (28). The pGW1-HA-Shank1 and Shank3 expression constructs were used as described (29). For the AAV plasmids, the SHANK2-WT and SHANK2-R462X sequences were sub-cloned into the pAAV-Syn-Venus vector (30), generating pAAV-Syn-Venus-SHANK2-WT and pAAV-Syn-Venus-SHANK2-R462X plasmids.
Cell culture and transfection
Dissociated primary hippocampal neurons from embryonic day 18 (E18) Sprague–Dawley rats (Charles River Laboratories, Sulzfeld, Germany) were prepared and cultured as described elsewhere (28). Neurons were transfected after 10 days in culture (10 DIV) with Lipofectamine 2000 (Invitrogen), using a total of 1 µg of DNA (500 ng SHANK2 construct or mutant, 100 ng of GFP-plasmid, 400 ng of pcDNA3-vector) for each well of a 24-well plate. HEK293 cells were maintained in DMEM (GIBCO) plus 10% FCS, 1 mm glutamine, 100 U/ml penicillin and streptomycin. Transfections of the different constructs were performed with Lipofectamine 2000. For shRNA experiments, pSUPER plasmids were used either at 1.5 µg/ml (HEK293 cells, together with 0.5 µg/ml of the Shank constructs) or at 5 ng/ml (primary neurons). Rescue experiments in primary hippocampal neurons were performed with 5 ng/ml pSUPER-shRNA #2, 125 ng/ml of SHANK2 WT or mutant constructs and 50 ng/ml of GFP plasmid DNA. For the GFP control, we added 125 ng/ml of pcDNA3.1-mCherry-DEST vector and 50 ng/ml of GFP plasmid DNA. pcDNA3.1 vector was calculated to reach a final concentration of 500 ng/ml of total DNA for each reaction.
Virus infection
Recombinant AAVs were generated as described (30), and purified by affinity chromatography (31). Virus titers were determined in hippocampal primary cultures (1.0 × 10⁷–108 particles/ml). For adult infections, viruses were delivered into the brain of deeply anesthetized (ketamine/xylazine mix) 6-week-old C57BL/6N mice (Charles River) by stereotactic injections (30). Stereotactic coordinates relative to the bragma were: anteroposterior (AP) 2.1 mm, lateral ±1.6 mm, depth 0.3–1.6 mm for hippocampal and cortical injections (one purified virus/injection). For P0 injection, mice from two litters of C57BL6/N mice (Charles River) were randomly injected with either rAAV-Syn-GFP or rAAV-Syn-Venus-SHANK2-R462X virus at postnatal day 0. The rAAV viruses were injected in both hemispheres targeted to the hippocampus. Each mouse received two injections on each hemisphere: AP 1.0 mm, lateral ±1.0 mm, depth 1.6 mm; AP 2.0 mm, lateral ±1.0 mm, depth 1.5 mm; 1 (microlitres purified virus/injection site).
After injection, the pups were put back to the home cage with their mothers. The identification of the injected virus in the animal was done postmortem after the behavior analysis by immunoblotting.
Brain sections
Mice were anesthetized with isofluran and either decapitated directly or perfused intracardially with warm 1× PBS (137 mm NaCl, 2.7 mm KCl, 4.3 mm Na2HPO4/2H2O, 1.4 mm KH2PO4) and 4% paraformaldehyde (PFA) in PBS prior to decapitation. Brains were removed and fixed in ice-cold 4% PFA for 2 h, embedded in 2.5% agarose/PBS and sliced on a vibratome into 70–100 μm sections.
Immunocytochemistry
Hippocampal primary neurons were fixed on 18 DIV in 4% PFA for 15 min, permeabilized with PBS plus 0.2% Triton X-100 and blocked in PBS containing 10% normal goat serum. We used a rabbit polyclonal anti-synapsin-1 antibody (1:500, Chemicon), a mouse anti-Shank2 antibody (1:500; NeuroMab, Antibodies, Inc.) or a mouse anti-PSD95 antibody (1:500; NeuroMab, Antibodies, Inc.) together with Alexa Fluor 647 goat anti-rabbit (1:1000; Invitrogen) or Alexa Fluor 568 rabbit anti-mouse (1:1000, Invitrogen). Virus-injected mice were fixed with 4% PFA/PBS, and 70 μm sections were obtained from the brain. Staining of brain sections was done with rabbit anti-GFP antibody (1:5000, Abcam) and FITC-coupled anti-rabbit secondary antibody (1:200, Jackson ImmunoResearch). For the GluA1 cluster staining, the brain sections were treated at 37°C for 10 min with 0.3 mg/ml Pepsin (DAKO Carpinteria) in 0.2 N HCl and washed briefly in PBS before immunostaining. The sections were incubated with rabbit anti-GluA1 (1:1000, Abcam) and followed with Cy3-coupled anti-rabbit secondary antibody (1:500, Jackson ImmunoResearch). The Golgi staining was performed with the commercial FD Rapid GolgiStainTM Kit (FD NeuroTechnologies).
Image analysis
To determine the effect on spine volume in primary hippocampal neurons, the SHANK2 constructs were co-transfected with GFP and processed for confocal microscopy at 18 DIV. High-resolution z-stack images of GFP-positive neurons were taken with the 63× objective of the confocal laser scanning microscope (Zeiss). Neurons displaying pyramidal morphology were chosen randomly and spine volumes were subsequently analyzed with the ImageJ software. Signal intensity levels of each construct were similar, excluding the possibility of effects of transfection efficiencies. The clustering properties of SHANK2 constructs were quantified by calculating the synaptic clustering ratio (SCR), the ratio of the average pixel intensity in dendrites versus spine heads. Transfected neurons were randomly chosen for each construct from two independent transfections (12 cells per construct). The average pixel intensity was measured in dendrites (excluding the spine heads) and in the spine heads by tracing their individual perimeters. The size of SHANK2 construct clusters and the endogeneous Shank2 clusters in dendritic spines as well as the synaptic density measures were determined with the ‘analyze particle’ function of the ImageJ 1.41f software, using threshold images. Particles <0.1 µm2 were excluded from the analysis. For the brain sections, evaluation of the immunostaining and Golgi staining was done with confocal microscopy (SP2, Leica) using either 5× for overview or 63× for high-magnification images. Two mice from each genotype were used for the GluA1 cluster staining. The laser power of confocal microscopy was kept the same during all recordings. In the stratum radiatum region of the hippocampus, 4 stacks containing 40 images each with an area of 29.7 × 29.7 μm2 and an interval of 81 nm were taken for the analysis. All stacks were first restored with the deconvolution software HuygensPro (SVI Systems) applying CMLE with 300 iterations, 0.0001% quality threshold and a theoretical point spread function. Deconvoluted images were then imported to ImageJ for particle counting analysis using a fixed threshold algorithm.
Western blot analysis
Infected hippocampal tissue of mouse brains was collected and homogenized in ice-cold buffer (25 mm HEPES, pH 7.4) containing a protease inhibitor cocktail (Complete, Roche, Pharma AG). After 5 min of 2000 r.p.m. low centrifugation, the supernatnant containing total proteins was collected. For membrane proteins, they were obtained by 13 000 r.p.m. high centrifugation of the pellets. Of total and membrane proteins, 5 μg was separated by SDS–PAGE (10% separating and 4% stacking gels) and transferred to nitrocellulose membranes. Western blots were probed with monoclonal mouse anti-GFP (1:10000, Abcam), polyclonal rabbit anti-GluA1 (1:5000, Abcam), monoclonal mouse anti-GluA2, monoclonal mouse anti-SHANK2 (1:2000), monoclonal rabbit anti-pospho-Ser831-GluA1 (1:8000, Millipore), monoclonal rabbit anti-phospho-Ser845-GluA1 (1:2000, Millipore), polyclonal rabbit anti-P38 (1:2000, Abcam) and monoclonal mouse anti-GAPDH (1:5000, Abcam). Fluorescent coupled secondary antibodies anti-rabbit IgG (IRDye800DX, 1:10 000, Rockland) and anti-mouse IgG (IRDye700DX, 1:5000, Rockland) were used. Fluorescence was detected by the fluorescence imaging scanner (Starion/FLA9000, GE-Healthcare). Quantification of western blots was done using Multi-Gauge (Fuji-Film) and Image J (NIH).
Electrophysiology
The brain of mice was dissected out and combined EC-dorsal hippocampus slices (350 μm) were cut in the horizontal plane (HM 650 V, Microm International, Walldorf, Germany) in a dissection buffer (4°C) containing (in mm): 212.7 sucrose, 5 KCl, 1.25 NaH2PO4, 10 MgCl2, 0.5 CaCl2, 26 NaHCO3, 10 dextrose, saturated with 95% O2/5% CO2 (pH 7.4). Individual slices were gently transferred to normal artificial cerebrospinal fluid (ACSF) for at least 1h prior to recording. Normal ACSF was similar to the dissection buffer except that sucrose was replaced by 119 mm NaCl, MgCl2 lowered to 1 mm and CaCl2 raised to 2 mm. Visualized whole-cell recordings (IR-DIC, Axioskop 2 FS mot, Zeiss International, Germany) were made from EC layer 2/3 (≥ 35% depth from the pia), and from hippocampal CA1 pyramidal cells. Cortical pyramidal cells were identified by their pyramidal shaped, prominent apical dendrites and regular spiking pattern in response to depolarizing current (0.1–0.5 nA, 1 s). A subset of 20 pyramidal-like cells was filled with 0.1% Lucifer yellow and we found that 95% were spine-containing pyramidal cells, validating the selection criteria. Borosillicate glass recording pipettes (4–6 MΩ) were filled with intracellular solution containing (in mm): 130 (Cs)gluconate, 5.5 KCl, 1 EGTA (pH 8), 10 HEPES, 4 (Mg)ATP, 0.5 (Na3)GTP, 10 (Na2)phosphocreatine and 5 QX-314 (lidocaine N-ethyl bromide) (pH 7.25, 280–290 mOsm), and a liquid junction potential of 16.3 mV was compensated (30°C). Only cells with holding currents ≤100 pA, series resistance ≤20 MΩ and input resistance ≥150 MΩ were studied. Cells were discarded if any of these control parameters, monitored with a 100 ms voltage pulse of −10 mV, changed ≥20% between two flanking epochs sampled at the beginning and end of the recordings. Data were filtered at 2 kHz and digitized at 5 kHz using an EPC-10 amplifier controlled by Patchmaster (HekaElektronik, Lambrecht, Germany). We quantified the net excitatory and inhibitory postsynaptic drive from the same recorded cells. Spontaneous miniature excitatory and inhibitory currents (mPSCs) were recorded in the presence of tetrodotoxin citrate (1 μm TTX, Biotrend), (dl)-2-amino-5-phosphonovaleric acid (50 μm d,l-APV, Biotrend) and CGP 55845 (2 μm, Biotrend), all diluted in the ASCF at 2 ml/min, 30 ± 1°C. To isolate AMPAR-mediated miniature currents (hereafter referred to as mEPSCs), neurons were held at Vh= −70 mV [EAMPA= 6.21 ± 0.84 mV, n = 11, in (–)-bicucullinemethiodide; 20 μm, Sigma Aldrich], whereas for GABAA-mediated inhibitory currents (hereafter referred to as mIPSCs), neurons were held at Vh= 0 mV [EGABAA = −67.62 ± 3.10 mV, n = 15, estimated in the presence of 6-nitro-7-sulfamoyl-benzo(f)quinoxaline-2,3-dione, 10 μm, NBQX, Biotrend]. Spontaneous currents were detected and analyzed using the Mini Analysis Program (Synaptosoft, Inc.) with a threshold set at three and five times the RMS of membrane current noise, for mEPSCs and mIPSCs, respectively. Cells showing a negative correlation between mPSC amplitude and rise time were excluded from this analysis (i.e. dendritic filtering present). The first 300 events/cell with rise time ≤3 ms for mEPSCs (≤5 ms for mIPSCs) were used to estimate the cell's mPSC amplitude and frequency distributions. At least two cells per animal were recorded and average amplitude and frequency (per animal) were compared across interleaved experimental conditions.
Mouse behavior analysis
Mice were housed four per cage in an animal room with constant temperature (22 ± 1°C) and adapted to a new 12 h light/dark cycle with free access to food and water. Experiments were performed between 10 a.m. and 5 p.m. during the light phase. One week prior to starting the tests, mice were single-housed and handled extensively (15 min per mouse per day) to reduce their anxiety and get acquainted with the testing environment (32).
Statistical analysis
Data are presented as mean ± SD unless otherwise stated. Testing for normal distribution was made by the Kolmogorov–Smirnov or the Shapiro–Wilk test. Concerning the experiments in primary hippocampal neurons, the comparisons of mean differences between groups were made using the two-way ANOVA test including the different conditions and controlling for the different replicates followed by a Scheffé post hoc test with significance levels for both set at P< 0.05. ANOVA P-values are shown for the different conditions. mPSC amplitudes were statistically compared using an unbalanced one-way ANOVA test and their cumulative distributions with a Kolmogorov–Smirnov test. Average frequencies were compared by using an ANOVA test followed by Fisher's protected least significant difference (PLSD) post hoc test. mPSC kinetics were compared using an unpaired Student's t-test followed by a Scheffé' post hoc test. Significance levels were set at P < 0.05. Group plots are presented as average ± SEM. Tests were performed with programs written in MATLAB 7.8 (R2009a; MathWorks, Inc.) or SPSS 16.0 software for Windows. For the behavior tests, one-way ANOVA was performed for the open-field activity tests; two-way ANOVA followed by post hoc Bonferroni test was done for the open-field novel object exploration test; light/dark box test was compared with one-way ANOVA and both two-way ANOVA and repeated measurement ANOVA were applied for the puzzle box test, showing similar results. Mann–Whitney tests (nonparametric test) were performed for both GluA1 cluster number and size counting analysis.
SUPPLEMENTARY MATERIAL
FUNDING
S.B. was funded by a fellowship of CellNetworks Cluster of Excellence (EXC81) and is a member of HBIGS (Hartmut Hoffmann-Berling International Graduate School). M.T. was supported by a Max Planck Fellowship. S.W.S. holds the GlaxoSmithKline-CIHR Pathfinder Chair in Genetics and Genomic Biology at The Hospital for Sick Children and University of Toronto. G.A.R. is a member of CellNetworks Cluster of Excellence (EXC81) and the Interdisciplinary Center for Neurosciences. This work was supported by the Federal Ministry of Education and Research, Germany via the German Mental Retardation Network (BMBF/NGFNplus 01GS08168 to G.A.R.) and by the ‘Deutsche Forschungsgesellschaft’ (DFG SFB488 to G.A.R., SFB636/A4 to R.S., GA427/8 to R.S. and P.G.). Funding to pay the Open Access publication charges for this article was provided by the DFG (SFB488/B8).
Supplementary Material
ACKNOWLEDGEMENTS
We gratefully thank Christine Fischer for help with the statistical analysis, Tatjana Wuest for technical support, Slavil Peykov for cloning the rShank2 construct and Madeline Bucher for help with the animal experiments. We also thank Hilmar Bading for comments and Carlo Sala and Paul F. Worley for providing us the Shank1 and Shank3 expression constructs and the Nikon Imaging Center Heidelberg for support. We also thank P.H. Seeburg for generous support.
Conflict of Interest statement. The authors declare no competing financial interests.
REFERENCES
- 1.Geschwind D.H. Advances in autism. Annu. Rev. Med. 2009;60:367–380. doi: 10.1146/annurev.med.60.053107.121225. [DOI] [PMC free article] [PubMed] [Google Scholar]
- 2.Kelleher R.J., III, Bear M.F. The autistic neuron: troubled translation? Cell. 2008;135:401–406. doi: 10.1016/j.cell.2008.10.017. [DOI] [PubMed] [Google Scholar]
- 3.Devlin B., Melhem N., Roeder K. Do common variants play a role in risk for autism? Evidence and theoretical musings. Brain Res. 2011;1380:78–84. doi: 10.1016/j.brainres.2010.11.026. [DOI] [PMC free article] [PubMed] [Google Scholar]
- 4.Mitchell K.J. The genetics of neurodevelopmental disease. Curr. Opin. Neurobiol. 2010;21:1–7. doi: 10.1016/j.conb.2010.08.009. [DOI] [PubMed] [Google Scholar]
- 5.Ramocki M.B., Zoghbi H.Y. Failure of neuronal homeostasis results in common neuropsychiatric phenotypes. Nature. 2008;455:912–918. doi: 10.1038/nature07457. [DOI] [PMC free article] [PubMed] [Google Scholar]
- 6.Berkel S., Marshall C.R., Weiss B., Howe J., Roeth R., Moog U., Endris V., Roberts W., Szatmari P., Pinto D., et al. Mutations in the SHANK2 synaptic scaffolding gene in autism spectrum disorder and mental retardation. Nat. Genet. 2010;42:489–491. doi: 10.1038/ng.589. [DOI] [PubMed] [Google Scholar]
- 7.Pinto D., Pagnamenta A.T., Klei L., Anney R., Merico D., Regan R., Conroy J., Magalhaes T.R., Correia C., Abrahams B.S., et al. Functional impact of global rare copy number variation in autism spectrum disorders. Nature. 2010;466:368–372. doi: 10.1038/nature09146. [DOI] [PMC free article] [PubMed] [Google Scholar]
- 8.Sheng M., Kim E. The Shank family of scaffold proteins. J. Cell. Sci. 2000;113:1851–1856. doi: 10.1242/jcs.113.11.1851. [DOI] [PubMed] [Google Scholar]
- 9.Sudhof T.C. Neuroligins and neurexins link synaptic function to cognitive disease. Nature. 2008;455:903–911. doi: 10.1038/nature07456. [DOI] [PMC free article] [PubMed] [Google Scholar]
- 10.McWilliams R.R., Gidey E., Fouassier L., Weed S.A., Doctor R.B. Characterization of an ankyrin repeat-containing Shank2 isoform (Shank2E) in liver epithelial cells. Biochem. J. 2004;380:181–191. doi: 10.1042/BJ20031577. [DOI] [PMC free article] [PubMed] [Google Scholar]
- 11.Haeckel A., Ahuja R., Gundelfinger E.D., Qualmann B., Kessels M.M. The actin-binding protein Abp1 controls dendritic spine morphology and is important for spine head and synapse formation. J. Neurosci. 2008;28:10031–10044. doi: 10.1523/JNEUROSCI.0336-08.2008. [DOI] [PMC free article] [PubMed] [Google Scholar]
- 12.Romo-Parra H., Trevino M., Heinemann U., Gutierrez R. GABA actions in hippocampal area CA3 during postnatal development: differential shift from depolarizing to hyperpolarizing in somatic and dendritic compartments. J. Neurophysiol. 2008;99:1523–1534. doi: 10.1152/jn.01074.2007. [DOI] [PubMed] [Google Scholar]
- 13.Pilpel N., Landeck N., Klugmann M., Seeburg P.H., Schwarz M.K. Rapid, reproducible transduction of select forebrain regions by targeted recombinant virus injection into the neonatal mouse brain. J. Neurosci. Methods. 2009;182:55–63. doi: 10.1016/j.jneumeth.2009.05.020. [DOI] [PubMed] [Google Scholar]
- 14.Bannerman D.M., Deacon R.M., Brady S., Bruce A., Sprengel R., Seeburg P.H., Rawlins J.N. A comparison of GluR-A-deficient and wild-type mice on a test battery assessing sensorimotor, affective, and cognitive behaviors. Behav. Neurosci. 2004;118:643–647. doi: 10.1037/0735-7044.118.3.643. [DOI] [PubMed] [Google Scholar]
- 15.Ben Abdallah N.M., Fuss J., Trusel M., Galsworthy M.J., Bobsin K., Colacicco G., Deacon R.M., Riva M.A., Kellendonk C., Sprengel R., et al. The puzzle box as a simple and efficient behavioral test for exploring impairments of general cognition and executive functions in mouse models of schizophrenia. Exp. Neurol. 2011;227:42–52. doi: 10.1016/j.expneurol.2010.09.008. [DOI] [PubMed] [Google Scholar]
- 16.Okamoto P.M., Gamby C., Wells D., Fallon J., Vallee R.B. Dynamin isoform-specific interaction with the shank/ProSAP scaffolding proteins of the postsynaptic density and actin cytoskeleton. J. Biol. Chem. 2001;276:48458–48465. doi: 10.1074/jbc.M104927200. [DOI] [PMC free article] [PubMed] [Google Scholar]
- 17.Boeckers T.M., Liedtke T., Spilker C., Dresbach T., Bockmann J., Kreutz M.R., Gundelfinger E.D. C-terminal synaptic targeting elements for postsynaptic density proteins ProSAP1/Shank2 and ProSAP2/Shank3. J. Neurochem. 2005;92:519–524. doi: 10.1111/j.1471-4159.2004.02910.x. [DOI] [PubMed] [Google Scholar]
- 18.Grabrucker A.M., Knight M.J., Proepper C., Bockmann J., Joubert M., Rowan M., Nienhaus G.U., Garner C.C., Bowie J.U., Kreutz M.R., et al. Concerted action of zinc and ProSAP/Shank in synaptogenesis and synapse maturation. EMBO J. 2011;30:569–581. doi: 10.1038/emboj.2010.336. [DOI] [PMC free article] [PubMed] [Google Scholar]
- 19.Penzes P., Cahill M.E., Jones K.A., Vanleeuwen J.E., Woolfrey K.M. Dendritic spine pathology in neuropsychiatric disorders. Nat. Neurosci. 2011;14:285–293. doi: 10.1038/nn.2741. [DOI] [PMC free article] [PubMed] [Google Scholar]
- 20.Cline H., Haas K. The regulation of dendritic arbor development and plasticity by glutamatergic synaptic input: a review of the synaptotrophic hypothesis. J. Physiol. 2008;586:1509–1517. doi: 10.1113/jphysiol.2007.150029. [DOI] [PMC free article] [PubMed] [Google Scholar]
- 21.Durand C.M., Betancur C., Boeckers T.M., Bockmann J., Chaste P., Fauchereau F., Nygren G., Rastam M., Gillberg I.C., Anckarsater H., et al. Mutations in the gene encoding the synaptic scaffolding protein SHANK3 are associated with autism spectrum disorders. Nat. Genet. 2007;39:25–27. doi: 10.1038/ng1933. [DOI] [PMC free article] [PubMed] [Google Scholar]
- 22.Gauthier J., Champagne N., Lafreniere R.G., Xiong L., Spiegelman D., Brustein E., Lapointe M., Peng H., Cote M., Noreau A., et al. De novo mutations in the gene encoding the synaptic scaffolding protein SHANK3 in patients ascertained for schizophrenia. Proc. Natl Acad. Sci. USA. 2010;107:7863–7868. doi: 10.1073/pnas.0906232107. [DOI] [PMC free article] [PubMed] [Google Scholar]
- 23.Peca J., Feliciano C., Ting J.T., Wang W., Wells M.F., Venkatraman T.N., Lascola C.D., Fu Z., Feng G. Shank3 mutant mice display autistic-like behaviours and striatal dysfunction. Nature. 2011 doi: 10.1038/nature09965. e-pub ahead of print, 20 March 2011; doi10.1038/nature09965. [DOI] [PMC free article] [PubMed] [Google Scholar]
- 24.Hutsler J.J., Zhang H. Increased dendritic spine densities on cortical projection neurons in autism spectrum disorders. Brain Res. 2010;1309:83–94. doi: 10.1016/j.brainres.2009.09.120. [DOI] [PubMed] [Google Scholar]
- 25.Arikkath J., Peng I.F., Ng Y.G., Israely I., Liu X., Ullian E.M., Reichardt L.F. Delta-catenin regulates spine and synapse morphogenesis and function in hippocampal neurons during development. J. Neurosci. 2009;29:5435–5442. doi: 10.1523/JNEUROSCI.0835-09.2009. [DOI] [PMC free article] [PubMed] [Google Scholar]
- 26.Pfeiffer B.E., Huber K.M. The state of synapses in fragile X syndrome. Neuroscientist. 2009;15:549–567. doi: 10.1177/1073858409333075. [DOI] [PMC free article] [PubMed] [Google Scholar]
- 27.Webb S. Drugmakers dance with autism. Nat. Biotechnol. 2010;28:772–774. doi: 10.1038/nbt0810-772. [DOI] [PubMed] [Google Scholar]
- 28.Siegel G., Obernosterer G., Fiore R., Oehmen M., Bicker S., Christensen M., Khudayberdiev S., Leuschner P.F., Busch C.J., Kane C., et al. A functional screen implicates microRNA-138-dependent regulation of the depalmitoylation enzyme APT1 in dendritic spine morphogenesis. Nat. Cell. Biol. 2009;11:705–716. doi: 10.1038/ncb1876. [DOI] [PMC free article] [PubMed] [Google Scholar]
- 29.Naisbitt S., Kim E., Tu J.C., Xiao B., Sala C., Valtschanoff J., Weinberg R.J., Worley P.F., Sheng M. Shank, a novel family of postsynaptic density proteins that binds to the NMDA receptor/PSD-95/GKAP complex and cortactin. Neuron. 1999;23:569–582. doi: 10.1016/s0896-6273(00)80809-0. [DOI] [PubMed] [Google Scholar]
- 30.Tang W., Ehrlich I., Wolff S.B., Michalski A.M., Wolfl S., Hasan M.T., Luthi A., Sprengel R. Faithful expression of multiple proteins via 2A-peptide self-processing: a versatile and reliable method for manipulating brain circuits. J. Neurosci. 2009;29:8621–8629. doi: 10.1523/JNEUROSCI.0359-09.2009. [DOI] [PMC free article] [PubMed] [Google Scholar]
- 31.Smith R.H., Levy J.R., Kotin R.M. A simplified baculovirus-AAV expression vector system coupled with one-step affinity purification yields high-titer rAAV stocks from insect cells. Mol. Ther. 2009;17:1888–1896. doi: 10.1038/mt.2009.128. [DOI] [PMC free article] [PubMed] [Google Scholar]
- 32.Deacon R.M., Rawlins J.N. T-maze alternation in the rodent. Nat. Protoc. 2006;1:7–12. doi: 10.1038/nprot.2006.2. [DOI] [PubMed] [Google Scholar]
Associated Data
This section collects any data citations, data availability statements, or supplementary materials included in this article.