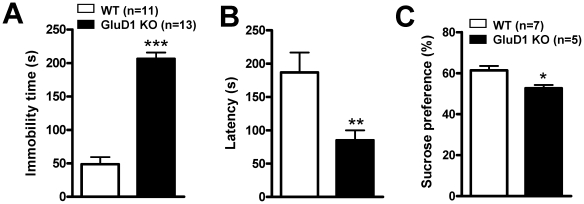
Figure 3. GluD1 KO exhibit depression-like behavior.
A. In a forced swim test GluD1 KO (n = 13) displayed a greater duration of immobility compared to WT mice (n = 11) (unpaired t-test, P<0.0001, F = 1.060). B. GluD1 KO (n = 13) had a significantly shorter latency to immobility compared to WT mice (n = 11) (unpaired t-test, P = 0.0040, F = 3.446). C. GluD1 KO mice (n = 5) manifested significantly lower preference for sucrose compared to WT (n = 7) mice (unpaired t-test, P = 0.0118, F = 2.275). Data are presented as mean ± SEM. *** represents P<0.001 and ** represents P<0.01 and * represents P<0.05.

