
Figure 1.
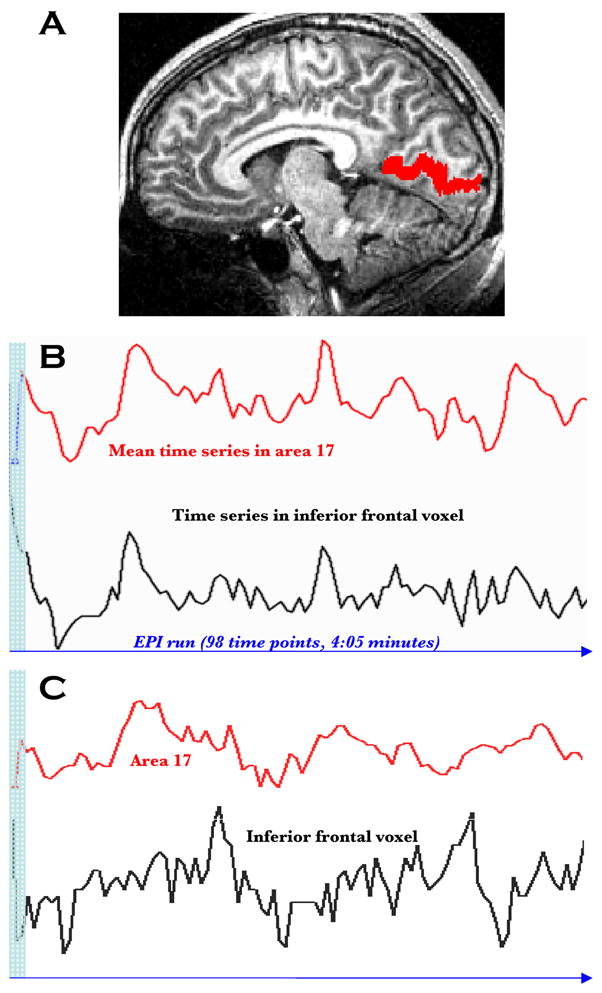
(A) Area 17, as identified on the high-resolution structural image of an individual control subject. (B) Detrended mean time series for primary visual area 17 (top) and time series for a voxel in left inferior frontal area 44 (bottom) for a control subject. The correlation coefficient for this voxel is r=0.78. The shaded column on the left represents the first 3 time points discarded from analyses (see Methods). (C) Detrended mean time series for primary visual area 17 and time series for a voxel in left inferior frontal area 44 for autism subject # 5. The correlation coefficient for this voxel is r=.19