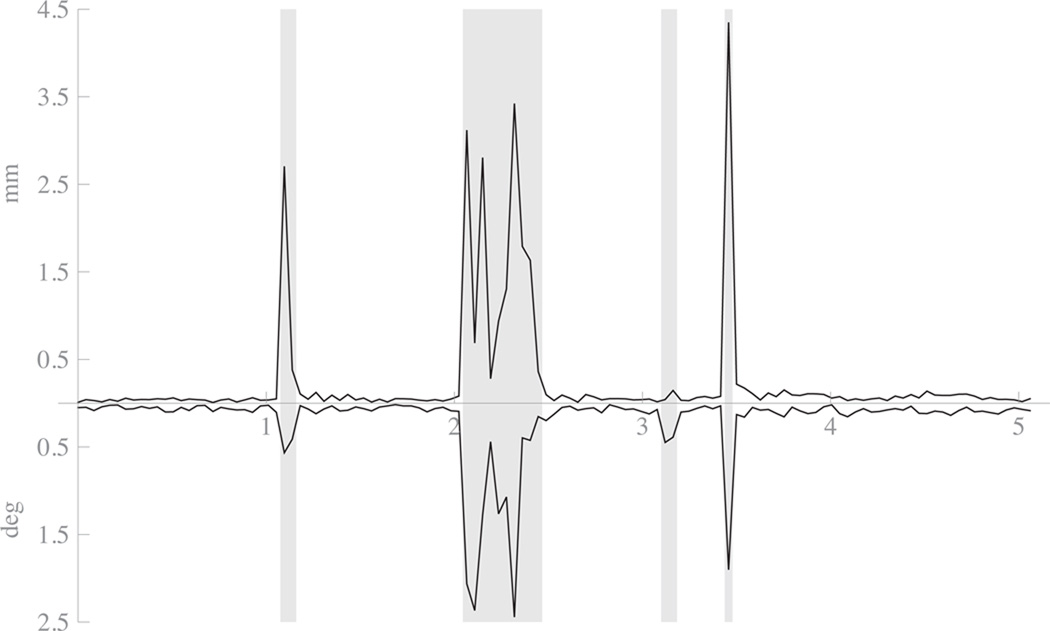
Figure 6.
Plot of motion as estimated from navigators from subject 4 with-motion-and-motion-correction condition. The top path shows absolute displacement in mm from previous TR’s estimated position. The bottom path shows the absolute rotation around the volume center in degrees from the previous TR’s estimated position. The x-axis is in units of minutes. Areas shaded with grey background were the periods automatically selected for reacquisition by the system.

