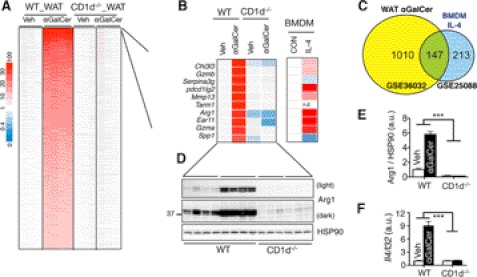
FIGURE 6.
NKT cell activation increases IL-4 signaling in adipose tissue. A, heat map showing the fold-change of gene expression in WAT of WT or CD1d−/− mice on 4-day HFD with or without αGalCer injection. n = 3–4 mice each. A total of 1556 differentially expressed genes with q < 0.001 and fold-change >2 are shown. B, top 10 genes up-regulated by αGalCer and their expression changes in IL-4-treated BMDM (GSE25088). n.d., not detected. Veh, vehicle; CON, control. C, Venn diagrams showing the overlap of significantly up-regulated genes in αGalCer-injected WAT versus IL-4-treated BMDM data sets. As not all αGalCer-induced genes existed in the IL-4_BMDM dataset, only 1157 genes, rather than 1556 genes induced by αGalCer, were included in the Venn diagrams. D, Western blot analysis of Arg1 expression in WAT of WT and CD1d−/− cohorts under 4-day HFD with vehicle or αGalCer treatment. n = 3–4 mice each, two repeats. Each lane represents an independent sample. Quantitation shown in E with the values of the WT + vehicle sample set at 1. F, Q-PCR analysis of Il4 mRNA levels in WAT of WT or CD1d−/− mice on 4-day HFD with or without αGalCer injection. n = 4 mice each. Values represent mean ± S.E. ***, p < 0.005. a.u., arbitrary units.

