

Background: Human brain Tau isoforms differ by the presence or absence of inserts derived from alternative splicing of MAPT transcripts.
Results: Tau inserts modulate Tau aggregation propensity through differing kinetic mechanisms that synergize or compete depending on sequence context.
Conclusion: MAPT splicing patterns associated with tauopathies correlate with aggregation propensity.
Significance: Tau aggregation propensity may contribute to disease pathogenesis.
Keywords: Aggregation, Alzheimer Disease, Kinetics, Neurodegeneration, Tau
Abstract
The risk of developing tauopathic neurodegenerative disease depends in part on the levels and composition of six naturally occurring Tau isoforms in human brain. These proteins, which form filamentous aggregates in disease, vary only by the presence or absence of three inserts encoded by alternatively spliced exons 2, 3, and 10 of the Tau gene (MAPT). To determine the contribution of alternatively spliced segments to Tau aggregation propensity, the aggregation kinetics of six unmodified, recombinant human Tau isoforms were examined in vitro using electron microscopy assay methods. Aggregation propensity was then compared at the level of elementary rate constants for nucleation and extension phases. We found that all three alternatively spliced segments modulated Tau aggregation but through differing kinetic mechanisms that could synergize or compete depending on sequence context. Overall, segments encoded by exons 2 and 10 promoted aggregation, whereas the segment encoded by exon 3 depressed it with its efficacy dependent on the presence or absence of a fourth microtubule binding repeat. In general, aggregation propensity correlated with genetic risk reported for multiple tauopathies, implicating aggregation as one candidate mechanism rationalizing the correlation between Tau expression patterns and disease.
Introduction
Tauopathies, including Alzheimer disease (AD)2 and certain forms of frontotemporal lobar degeneration (FTLD), are neurodegenerative disorders that accumulate intracellular filamentous aggregates composed of the microtubule associated protein Tau (reviewed in Ref. 1). In some disorders, disease risk and aggregate composition vary with expression of MAPT, the sole gene encoding human Tau protein. The human MAPT locus is part of two major chromosome 17 allele combinations (haplotypes) termed H1 and H2 (2), both of which generate transcripts that are alternatively spliced in the central nervous system to include or exclude exons 2, 3, and 10 (reviewed in Ref. 3). Exons 2 and 3 encode 29-residue acidic inserts in the N-terminal projection domain of Tau, whereas exon 10 encodes a 31-residue microtubule binding repeat in the C-terminal domain. The default splicing pattern for exons 2 and 10 is inclusion, whereas the pattern for exon 3 is exclusion. However, exon 3 is transcribed only in the presence of exon 2. As a result, isoforms encoded by 2−3−, 2+3−, and 2+3+ transcripts, termed 0N, 1N, and 2N Tau because of the number of N-terminal inserts expressed, appear in human brain with prevalence 1N > 0N > 2N (4, 5). In normal brain, these are divided between exon 10+ and exon 10− encoding sequences (termed 4R and 3R, respectively, owing to the number of imperfect microtubule-binding repeats), yielding a total of six isoforms that vary in length from 352 to 441 amino acid residues (see Fig. 1A). Despite this canonical expression pattern, the six central nervous system Tau isoforms vary in relative amounts depending on both cis and trans gene regulatory mechanisms. The MAPT haplotype, for example, influences levels of both exon 3 and exon 10 containing transcripts, with the H1 haplotypes that favor inclusion of exon 10 being associated with the corticobasal degeneration and PSP forms of FTLD (6–8), and the H2 haplotype that favors exon 3 inclusion being protective against PSP (7, 8). Exon 10 inclusion also is modulated by certain intronic point mutations, with those that increase exon 10 containing transcripts, causing familial forms of FTLD (9, 10). In addition to cis acting elements, MAPT expression depends on developmental stage and cellular microenvironment. For example, 3R isoforms predominate in fetal brain and in certain adult cell populations, including granule cells of the dentate gyrus (11). These cells resist Tau aggregation in AD but accumulate 3R aggregates in Pick disease (12, 13). Together, these data implicate Tau isoform composition in susceptibility to certain tauopathic neurodegenerative disorders.
FIGURE 1.

Tau isoforms differ in critical concentration. A, six Tau isoforms are expressed in human brain owing to alternative splicing of MAPT exons 2, 3, and 10. B, Tau isoforms 0N3R (○), 1N3R (□), 2N3R (Δ), 0N4R (●), 1N4R (■), and 2N4R (▴) were incubated (24 h at 37 °C) at varying bulk concentrations in the presence of 100 μm Thiazine red inducer and then assayed for total filament length by electron microscopy. Results were then plotted against bulk protein concentration, where each data point represents the mean ± S.D. of triplicate determinations, and the solid lines represent best fit of the data points to linear regression. The abscissa intercept was obtained by extrapolation (dashed lines) and taken as the critical concentration (Kcrit; see Table 1 for values). C, replot of data from B, where each bar represents the ratio of Kcrit determined in the presence relative to the absence of segments encoded by exons 2, 3, or 10. Average ratios were calculated from pairwise comparisons of isoforms 1N3R/0N3R and 1N4R/0N4R (exon 2), 2N3R/1N3R and 2N4R/1N4R (exon 3), and 0N4R/0N3R, 1N4R/1N3R, and 2N4R/2N3R (exon 10) ± propagated SEE. A ratio of 1, corresponding to no difference in Kcrit in the presence or absence of the analyzed segment, is marked by the dashed line. Sequences encoded by exons 2 and 10 depressed Kcrit, whereas the sequence encoded by exon 3 did the opposite. **, p < 0.01; not significant (n.s.), p > 0.05 for comparison of average presence versus absence of each alternatively spliced segment.
Tau isoform composition can affect multiple aspects of Tau biology. For example, the N-terminal (projection) domain mediates interactions between Tau and the plasma membrane (14) and modulates spacing between microtubules (15), whereas the C-terminal (microtubule-binding) domain mediates both microtubule binding affinity (16) and Tau self-association (17). Because the 4R isoforms most strongly associated with familial FTLD affect the C-terminal domain, modulation of microtubule biology and aggregation propensity are leading rationales for association of these isoforms with disease. Nonetheless, current models cannot rationalize the potential role of N-terminal insertions, which do not affect microtubule binding affinity (18) or microtubule dynamics (19). In contrast, both N- and C-terminal inserts that arise from alternative splicing have been reported to modulate Tau aggregation propensity in the presence of heparin and anionic surfactant aggregation inducers (20–24). Under these conditions, which leverage a heterogeneous nucleation mechanism (25), isoform aggregation propensity is differentially influenced by Tau:inducer ratios (22–24). As a result, the reported contribution of segments encoded by alternatively spliced exons to aggregation propensity has been inconsistent. Moreover, the mechanisms through which alternatively spliced sequences act to modulate aggregation propensity are unknown.
Recently we showed that the small-molecule anionic inducer Thiazine red can substitute for macromolecular and surfactant inducers in driving aggregation of full-length 2N4R Tau into filaments with twisted ribbon morphology at submicromolar concentrations (26). The interaction approximates a homogeneous nucleation scheme characterized by initial formation of an unstable dimeric nucleus, followed by filament elongation through monomer addition (27). Under these conditions, the inherent aggregation propensity of full-length, un-modified Tau isoforms may be quantified and mechanistically localized under near physiological Tau protein concentrations, pH, ionic strength, and reducing conditions (28, 29).
Here, we use this approach to characterize the aggregation propensity of all six unmodified human brain Tau isoforms. The results show that all three alternatively spliced segments modulate Tau aggregation propensity and that they can do so at both the nucleation and elongation steps of the pathway.
EXPERIMENTAL PROCEDURES
Materials
Recombinant His-tagged human Tau isoforms were prepared as described previously (23, 30). Aggregation inducer Thiazine red (Chemical Abstract Service registry no. 2150-33-6) was obtained from TCI America (Portland, OR). Formvar/carbon-coated copper grids (300 mesh), glutaraldehyde, and uranyl acetate were obtained from Electron Microscopy Sciences (Fort Washington, PA).
Fibrillization Assays
Tau preparations were incubated (37 °C) without agitation in assembly buffer (10 mm HEPES, pH 7.4, 100 mm NaCl, 5 mm dithiothreitol) in the presence of 100 μm Thiazine red inducer for up to 24 h (unless specified otherwise). Aliquots were removed at indicated time points, fixed with glutaraldehyde, and examined by transmission electron microscopy as described in Ref. 31. Adsorbed filaments >10 nm in length were quantified from at least three fields captured for each condition using Optimas imaging software (version 6.5, Media Cybernetics, Silver Spring, MD). The summed lengths of all completely resolved filaments per field are reported ± S.D.
Analytical Methods
Kcrit values were estimated by linear regression analysis of the Tau concentration dependence of aggregation at interaction plateau (27, 28). The abscissa intercept (x̂) determined by inverse prediction was taken as Kcrit. Higher order approximations of x̂ were obtained from the Taylor series expansion (32),
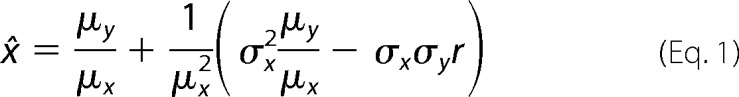 |
where μy ± σy is the ordinate intercept ± SEE, μx ± σx is the regression slope ± SEE, and r is the regression correlation coefficient. The variance (S2) was calculated as shown in Equation 2 (32).
 |
To estimate dissociation rate constant ke−, Tau filaments prepared as described above were diluted 10-fold into assembly buffer containing 100 μm Thiazine red and incubated at 37 °C. Aliquots were withdrawn as a function of time up to 5 h post-dilution and then assayed for filament length. The resultant disaggregation time series was fit to an exponential decay function to obtain kapp, the pseudo-first order rate constant describing the time-dependent decrease in filament length, and L0, the total filament length at time zero. The rate constant ke− was estimated from kapp, L0, and the number of filaments at time zero as described previously (33, 34). The association rate constant for elongation, ke+, was then obtained from the relationship (27).
Aggregation lag times were obtained by Gompertz regression of time series as described in Ref. 35.
Statistical Tests
Estimated kinetic parameters were assumed to resemble normally distributed random variables (Xi) with mean μi and known standard deviation si. As a global test of the null hypothesis H0 (i.e. that all compared μi values were the same), the statistic T based on the maximum likelihood ratio test principle (32) was calculated,
 |
where k is the number of kinetic parameters being compared, T is the 1 − α point of the Chi-square distribution having k − 1 degrees of freedom, wi = 1/σi2, and μ̂, the common mean under the null hypothesis, is the weighted sum of Xi.
 |
If H0 was true, then the probability (p) of obtaining more extreme values of T than actually observed is α.
For pairwise comparisons, the probability (p) of obtaining the observed results, assuming the null hypothesis, was assessed by z-test,
 |
where x1 ± Sx1 and x2 ± Sx2 are the pair of estimates ± SEE being compared, z is the 1 − α point of the standard normal distribution, and p is 2α. All statistical analyses were carried out using JMP (version 9.0, SAS Institute, Cary, NC).
RESULTS
Human Tau Isoforms Differ in Aggregation Propensity
All six Tau isoforms aggregated in the presence of Thiazine red inducer, forming filaments with twisted ribbon morphology (supplemental Fig. 1). To quantify aggregation propensity of each isoform, the minimal concentration required to support filament formation in the presence of Thiazine red inducer was estimated using an electron microscopy assay for total filament length (31). In nucleation-dependent interactions, the minimal concentration is termed the critical concentration (Kcrit) and approximates the dissociation equilibrium constant for elongation (Ke) (27). Results showed that Kcrit values for the six Tau isoforms varied over more than an order of magnitude (Fig. 1B; Table 1). When subjected to a global statistical test (Equations 4 and 5), the null hypothesis was rejected at p < 0.0001. Furthermore, the Fieller 95% confidence intervals for any pair of isoforms did not overlap. These data indicate that naturally occurring human Tau isoforms differed in their ability to support fibrillization in the presence of Thiazine red and that our analytical methods were adequate to detect and quantify the differences.
TABLE 1.
Summary of aggregation parameters
| Isoform | Kcrita | ke− | ke+ | Lag time |
|---|---|---|---|---|
| μm | s−1 | m−1s−1 | h | |
| 0N3R | 1.82 ± 0.03 | 0.051 ± 0.006 | 27,800 ± 3,300 | 1.36 ± 0.43 |
| 1N3R | 0.92 ± 0.03 | 0.053 ± 0.002 | 57,300 ± 2,090 | 1.18 ± 0.13 |
| 2N3R | 1.47 ± 0.05 | 0.048 ± 0.010 | 32,300 ± 7,100 | 0.85 ± 0.20 |
| 0N4R | 0.37 ± 0.03 | 0.021 ± 0.002 | 55,700 ± 7,600 | 0.34 ± 0.06 |
| 1N4R | 0.16 ± 0.01 | 0.021 ± 0.001 | 133,000 ± 8,800 | 0.29 ± 0.08 |
| 2N4R | 0.21 ± 0.01 | 0.019 ± 0.001 | 90,000 ± 5,900 | 0.23 ± 0.02 |
a Overall constant reflecting events at both filament ends.
To determine whether the observed variation in aggregation propensity resulted from differential sensitivity to Thiazine red inducer, the concentration-effect relationship for Thiazine red-mediated fibrillization was quantified for each isoform at constant Tau supersaturation (i.e. the net difference between bulk concentration and Kcrit was held constant, so that the amount of aggregation at plateau was approximately the same for all six isoforms). Results showed that all isoforms resembled one another with respect to both the potency and efficacy of Thiazine red (supplemental Fig. 2). Together, these data indicate that Tau isoforms respond similarly to Thiazine red and that the observed variation in Kcrit reflects intrinsic differences in aggregation propensity among Tau isoforms.
Contributions of Insert Sequences
Visual inspection of Fig. 1B revealed that 4R-containing Tau isoforms aggregated with lower Kcrit than 3R isoforms. Moreover, the rank order of Kcrit within 3R and 4R isoforms consistently was 0N > 2N > 1N, suggesting that the differences resulted from the presence or absence of alternatively spliced segments. To test this prediction, the ratio of Kcrit values observed in the presence and absence of each alternatively spliced segment was calculated for isoform pairs. For example, pairwise comparison of 0N4R with 1N4R, and of 0N3R with 1N3R, gave two estimates of the contribution of the N-terminal segment encoded by exon 2 to Kcrit, whereas comparison of 1N4R with 2N4R and of 1N3R with 2N3R provided two estimates of the effects of the exon 3-encoded sequence. Similarly, comparison of 0N4R with 0N3R, 1N4R with 1N3R, and 2N4R and 2N3R provided three estimates of the contribution of the alternatively spliced microtubule binding repeat to Tau Kcrit. Replot of Kcrit ratios showed that the presence of the exon 2-encoded insert lowered Kcrit ∼ 2-fold in both 3R and 4R backgrounds (Fig. 1C). In contrast, exon 3-encoded sequence increased Kcrit, with stronger effects in 3R than in 4R background (Fig. 1C). The largest effects, however, associated with the exon 10-encoded microtubule repeat, which on average lowered Kcrit 6-fold (Fig. 1C). These data indicate that aggregation propensity is increased by exon 2- and exon 10-encoded segments but antagonized by the segment encoded by exon 3 in a manner that is sensitive to the number of microtubule binding repeats.
Mechanism of Critical Concentration Effects
Kcrit approximates the ratio of dissociation (ke−) and association (ke+) rate constants for filament elongation (Equation 2). Thus, modulation of Kcrit may result from changes in ke− (i.e. filament stability), in ke+ (i.e. the efficiency of monomer association with filament ends), or both. To distinguish these possibilities, ke− was estimated for each Tau isoform by diluting preassembled filaments below Kcrit and estimating the initial rate of filament shortening in the electron microscopy assay. Loss of filament length followed first order kinetics as predicted for endwise depolymerization from a Poisson-like length distribution (27, 34) (supplemental Fig. 3). On the basis of the relationship between Tau mass and filament length established for wild-type 2N4R Tau (27), the dissociation elongation constant ke− was derived from the disaggregation rate of each isoform. Rate constant ke+ was then calculated from estimates of ke− and Kcrit for each isoform through Equation 2. Estimated ke− and ke+ values for all isoforms are summarized in Table 1. Pairwise comparisons among isoforms showed that neither exon 2- nor exon 3-encoded segments exerted their effects at the level of dissociation rate constant ke− (Fig. 2). Rather, the aggregation promoting effects of the exon 2 encoded insert resulted from promotion of extension rate through increase in ke+, whereas the additional presence of exon 3 partially antagonized this effect (Fig. 2). In contrast, the strong aggregation promoting effects of the fourth microtubule binding repeat resulted from coordinated depression of ke− and increase in ke+ (Fig. 2). These data indicate that alternatively spliced segments modulate Kcrit through differing mechanisms that can synergize or compete with one another.
FIGURE 2.

Tau insertions modulate filament extension. Replot of data from Table 1, where each bar represents the ratio of rate constants for filament extension (ke+) and dissociation (ke−) determined in the presence relative to the absence of segments encoded by exons 2, 3, or 10. Average ratios were calculated from pairwise comparisons of isoforms 1N3R/0N3R and 1N4R/0N4R (exon 2), 2N3R/1N3R and 2N4R/1N4R (exon 3), and 0N4R/0N3R, 1N4R/1N3R, and 2N4R/2N3R (exon 10) ± propagated SEE. A ratio of 1, corresponding to no difference in rate constant in the presence versus absence of the analyzed segment is marked by the dashed line. Exon 2 depressed Kcrit by selectively increasing ke+, whereas exon 10 both increased ke+ and decreased ke−. In contrast, exon 3 increased Kcrit by decreasing ke+. **, p < 0.01 for comparison of average presence versus absence of each alternatively spliced segment.
Isoform Structure Influences Nucleation Rate
In the presence of Thiazine red inducer, Tau aggregation approximates an equilibrium nucleation-elongation interaction (27), where assembly-competent monomer rapidly equilibrates with a thermodynamically unstable species termed the nucleus (36). Once the critical nucleus cluster size is reached, subsequent additions to the nascent filament ends are favorable energetically, and elongation proceeds efficiently. As a result, aggregation rate depends not only on the rate of filament elongation (ke− and ke+) but on the efficiency of the nucleation step as well. To assess the effects of primary structure on nucleation rate, the time course of aggregation was quantified for each Tau construct at constant supersaturation. Under these conditions, differences in interaction rates primarily reflect differing rates of nucleation and protein concentrations (37). All resultant progress curves were sigmoidal with lag, exponential growth, and equilibrium phases (Fig. 3A). Lag times, which vary inversely with nucleation rate (38), were obtained ± SEE after fitting each time series to a three-parameter Gompertz growth function as described under “Experimental Procedures.” Resulting values ranged from 0.23–1.36 h, with 4R isoforms having the shortest lags (Table 1). To determine the contribution of each alternatively spliced segment to nucleation rate, the ratio of lag times observed in the presence and absence of exons 2, 3, and 10 encoded segments was calculated and averaged for isoform pairs. Replot of lag time ratios showed that the presence of a fourth microtubule binding repeat depressed lag time >4-fold at p < 0.01 (Fig. 3B), indicating that nucleation rate was promoted strongly by this segment. N-terminal inserts encoded by exons 2 and 3 also weakly decreased lag time (Table 1), but their effects did not reach statistical significance at p < 0.05 in pairwise comparisons (Fig. 3B). However, when 0N, 1N, and 2N isoforms were analyzed in separate 3R and 4R backgrounds, linear correlations between lag time and net Tau charge at assay pH were apparent (Fig. 4). In contrast, no correlation was detected (r2 < 0.2) when isoform lag time was plotted against grand average of hydropathy (calculated by the Kyte and Doolittle algorithm; data not shown). These data are consistent with all three alternatively spliced segments accelerating nucleation rate, with the weak effects of the acidic N-terminal inserts potentially being mediated by decreases in isoelectric point and net protein charge (39).
FIGURE 3.

Tau insertions modulate filament nucleation rate. A, Tau isoforms 0N3R (○), 1N3R (□), 2N3R (Δ), 0N4R (●), 1N4R (■), and 2N4R (▴) were incubated (37 °C) at constant supersaturation (i.e. 0.3 μm above Kcrit) in the presence of 100 μm Thiazine red and then assayed for filament formation as a function of time. Each data point represents average filament lengths/field calculated from triplicate electron microscopy images whereas each normalized curve (solid lines, 4R Tau isoforms; dashed lines, 3R Tau isoforms) represents best fit of the data points to a three parameter Gompertz growth function (31). Values for lag time were estimated from these plots and summarized in Table 1. Three-repeat isoforms aggregated with longer lag times than four-repeat isoforms. B, replot of data from A, where each bar represents the ratio of lag times determined in the presence relative to the absence of segments encoded by exons 2, 3, or 10. Average ratios were calculated from pairwise comparisons of isoforms 1N3R/0N3R and 1N4R/0N4R (exon 2), 2N3R/1N3R and 2N4R/1N4R (exon 3), and 0N4R/0N3R, 1N4R/1N3R, and 2N4R/2N3R (exon 10) ± propagated SEE. A ratio of 1, corresponding to no difference in lag time in the presence or absence of the analyzed segment, is marked by the dashed line. The presence of exon 10 strongly depressed lag time. **, p < 0.01 for comparison of average presence versus absence of each alternatively spliced segment.
FIGURE 4.

Nucleation rate correlates with net charge. Lag times determined for 3R Tau isoforms 0N3R (○), 1N3R (□), 2N3R (Δ) and 4R isoforms 0N4R (●), 1N4R (■), and 2N4R (▴) were plotted against net charge of each isoform, where each data point represents the mean ± S.D. of triplicate determinations, and the solid lines represent best fit of the data points to linear regression. Lag time correlated directly with net protein charge. Extrapolation to zero charge is shown by the dashed line.
4R Tau Can Drive Aggregation of 3R Tau
The above experiments show that 4R Tau isoforms aggregate more efficiently and at faster rates than 3R isoforms. Because human brain expresses both 3R and 4R isoforms in certain neurons (11), the potential for isoform co-assembly (40) exists. To test whether 4R Tau can promote aggregation of 3R Tau, the critical concentrations of 2N4R/0N3R mixtures were determined at varying isoform ratios. These two isoforms were chosen for analysis because they differed by nearly an order of magnitude in Kcrit (Table 1). Measured Kcrit values were then compared with theoretical values for a fully dominant interaction (i.e. where all 3R Tau aggregated like 4R Tau) or no interaction (i.e. where Kcrit values reflected the individual, noninteracting 3R and 4R components). Electron microscopy was used as the assay modality so that measured Kcrit values corresponded to filament formation rather than nonspecific trapping of monomers during aggregation. At high (3:1) 4R:3R ratios, Kcrit approximated the dominant interaction scenario, although it differed from the interaction scenario only at p = 0.07 (Fig. 5). At equimolar and low (1:3) 4R:3R ratios, however, Kcrit shifted to a value intermediate between the fully dominant and non-interacting scenarios (statistical differences when compared with both boundary conditions: p < 0.05 at 1:1 4R:3R ratio, and p < 0.01 at 1:3 4R:3R ratio; Fig. 5). These data indicate that the high aggregation propensity of 4R Tau can be partially dominant over 3R Tau, suggesting that the 4R species can recruit less assembly prone Tau isoforms into aggregates in the submicromolar free Tau concentration regime.
FIGURE 5.

Four-repeat Tau is dominant over 3R Tau. Varying concentrations of 2N4R and 0N3R isoforms were incubated together (24 h at 37 °C) in 3:1 (♦), 1:1 (♢), and 1:3 (▿) molar ratios in the presence of 100 μm Thiazine red inducer and then subjected to filament length measurements by electron microscopy. A, plot of total filament length against bulk protein concentration, where each data point represents the mean ± S.D. of triplicate determinations, and the solid lines represent best fit of the data points to linear regression. The abscissa intercept was obtained by extrapolation (dotted lines) and taken as Kcrit. B, replot of data from A, where each point represents experimentally determined Kcrit ± S.D. at the given isoform ratio, the dashed line represents the boundary prediction for no interaction between isoforms, and the dotted line represents the boundary prediction where interaction is complete and all Tau behave as 0N4R (i.e. Kcrit = 0.21 μm). Under these conditions, 2N4R Tau is dominant and drives a portion of 0N3R Tau into aggregates. Statistical tests for differences between observed values and those predicted for theoretical boundary conditions. *, p < 0.05; **, p < 0.01 compared with the non-interacting scenario. #, p < 0.05; ##, p < 0.01 compared with the fully dominant interaction scenario.
DISCUSSION
These data show that the intrinsic aggregation propensity of naturally occurring, unmodified human Tau isoforms differs owing to the contributions of N- and C-terminal inserts to the nucleation and extension steps of the aggregation pathway (Fig. 6). The Tau isoform lacking all three inserts, 0N3R, aggregates with a slow nucleation rate and relatively high Kcrit. Consistent with this finding, human fetal Tau, which consists of 0N3R Tau (41), is not associated with aggregation despite being hyperphosphorylated during development (42). Aggregation propensity of 3R Tau can be increased, however, by the insert encoded by exon 2, which acts to promote filament extension and modestly increase nucleation rate. Rate enhancement correlates with lowering of net protein charge, an established descriptor of aggregation propensity (39). In contrast, the exon 3-encoded segment, which normally is excluded by default (3), partially antagonizes the effects of exon 2-encoded sequences at the level of filament extension. Considered together, however, all three 3R isoforms required higher concentrations and longer nucleation times to support aggregation than their 4R analogs. These results are consistent with the reported resistance of chimpanzees and other primates that express primarily 3R Tau isoforms to neurofibrillary lesion formation (43, 44) and the need for overexpression to drive the aggregation of human 3R Tau in mouse models (45). Interestingly, chimpanzee MAPT haplotype is primarily H2 (46), which supports increased inclusion of the aggregation-resistant segment encoded by exon 3 (47).
FIGURE 6.

Alternatively spliced segments differentially affect the Tau fibrillization pathway. Once assembly competent species (Uc) form, the rate-limiting step in Tau fibrillization is formation of dimer, which represents the thermodynamic nucleus (N). Following nucleation, extension occurs through further addition of assembly competent monomers to the filament (F) ends. Tau insertions modulate fibrillization at both nucleation and extension steps. See text for details.
Relative to 3R isoforms, the addition of the fourth microtubule binding repeat encoded by exon 10 dramatically lowers critical concentration by stabilizing filaments and by promoting monomer association with filament ends. The nucleation rate is augmented as well through a mechanism that appears to be independent of charge effects. Aggregation propensity of 4R Tau was increased by the N-terminal insert encoded by exon 2, the efficacy of which was indistinguishable in 4R and 3R backgrounds. Although addition of the second N-terminal insert encoded by exon 3 partially antagonized this activity, its efficacy was detectably weaker in the 4R relative to 3R background. These data illustrate how the effects of Tau structure on aggregation propensity can be additive. For example, here we found that 2N3R Tau aggregated with a Kcrit of 1.47 μm and that the addition of a fourth microtubule binding repeat to create 2N4R Tau lowered this parameter ∼7-fold. Previously, we showed that the Kcrit for 2N4R Tau could be decreased an additional ∼2.5-fold by introduction of missense mutations P301L or G272V acting through increases in association rate constant ke+ (29) or by pseudophosphorylation acting through depression of ke− (28). Overall, these constructs illustrate how variation in Tau primary structure and modification state can modulate aggregation propensity over ∼20-fold range at the level of Kcrit. Tau expression in glia has been reported to resemble that of neurons (48), and so these principles likely apply throughout the brain.
Correlation of Aggregation Propensity with Disease
Animal models have shown that neurodegenerative phenotypes can result from high level overexpression of Tau sequences irrespective of filament formation (49, 50). In sporadic AD, however, total levels of all Tau transcripts do not increase relative to cognitively normal cases (51), and neurodegeneration correlates both spatially and temporally with Tau aggregation (52, 53). The discovery of familial forms of FTLD linked to MAPT (reviewed in Ref. 9) has further extended the correlation between Tau aggregation and disease to the level of Tau isoform composition. Intronic mutations that increase exon 10 inclusion are associated with Mendelian inheritance of certain forms of FTLD (54), whereas sub-haplotypes of H1 that increase both exon 10 inclusion and total Tau transcript levels (55) are associated with increased risk for PSP and corticobasal degeneration (6–8). Shift in isoform distribution toward 4R forms also has been observed in mild cognitive impairment and AD (51, 56, 57). On the basis of aggregation propensity investigated herein, exon 10 inclusion will bias Tau isoform distribution toward aggregation-prone species, whereas increases in bulk Tau concentration will accelerate all association steps in the pathway. In particular, the strong increase in aggregation propensity associated with the fourth microtubule binding repeat more than compensates for the depletion of 1N isoforms in AD (56). In contrast, haplotype H2, which is protective against PSP (7, 8), supports increased inclusion of exon 3 as well as decreased inclusion of exon 10 relative to H1 (47, 55). Moreover, levels of 2N forms of Tau are depressed in the Tau aggregates that accumulate in PSP (58–60). These data are consistent with the lower aggregation propensity observed with the insert encoded by exon 3. Overall, the aggregation behavior of naturally occurring Tau isoforms is consistent with the law of mass action in this subset of tauopathies (61).
The aggregation behavior identified herein for unmodified Tau monomers does not account for tauopathies that accumulate aggregates composed primarily of 3R Tau (reviewed in Ref. 1). In myotonic dystrophy, 3R aggregation reflects primarily an abnormal MAPT expression pattern favoring exclusion of exons 2, 3, and 10 (62). In contrast, 3R aggregation in Pick disease occurs in certain cell populations (63), perhaps reflecting selective vulnerability of cells expressing primarily 3R Tau (e.g. neural precursor cells (64)). Post-translational modifications that selectively promote 3R Tau dimerization, including disulfide (21, 65) and dityrosine bond formation (66), may foster 3R Tau aggregation in these cells. These examples indicate that native aggregation propensity is not the only factor underlying neurofibrillary lesion formation in tauopathic neurodegenerative diseases.
In summary, we have provided evidence that naturally occurring Tau isoforms differ in aggregation propensity owing to the contributions of inserts encoded by alternatively spliced exons 2, 3, and 10. The segments differentially modulate rate-limiting steps in the aggregation pathway and can synergize with the effects of missense and pseudophosphorylation mutations. The aggregation propensity of Tau isoforms may influence how Tau misfunction leads to clinically and histopathologically distinct diseases.
Acknowledgments
We thank Ranjan Batra and Lauren Crissman for technical assistance.
This work was supported, in whole or in part, by National Institutes of Health Grant AG14452. This work was also supported by Alzheimer's Association Grant IIRG-05-14288.

This article contains supplemental Figs. 1–3.
- AD
- Alzheimer disease
- FTLD
- frontotemporal lobar degeneration
- PSP
- progressive supranuclear palsy
- 3R
- three repeat
- SEE
- standard error of the estimate
- 4R
- four repeat.
REFERENCES
- 1. Sergeant N., Bretteville A., Hamdane M., Caillet-Boudin M. L., Grognet P., Bombois S., Blum D., Delacourte A., Pasquier F., Vanmechelen E., Schraen-Maschke S., Buée L. (2008) Biochemistry of Tau in Alzheimer disease and related neurological disorders. Expert. Rev. Proteomics 5, 207–224 [DOI] [PubMed] [Google Scholar]
- 2. Baker M., Litvan I., Houlden H., Adamson J., Dickson D., Perez-Tur J., Hardy J., Lynch T., Bigio E., Hutton M. (1999) Association of an extended haplotype in the Tau gene with progressive supranuclear palsy. Hum. Mol. Genet. 8, 711–715 [DOI] [PubMed] [Google Scholar]
- 3. Andreadis A. (2012) Tau splicing and the intricacies of dementia. J. Cell. Physiol. 227, 1220–1225 [DOI] [PMC free article] [PubMed] [Google Scholar]
- 4. Boutajangout A., Boom A., Leroy K., Brion J. P. (2004) Expression of Tau mRNA and soluble Tau isoforms in affected and non-affected brain areas in Alzheimer disease. FEBS Lett. 576, 183–189 [DOI] [PubMed] [Google Scholar]
- 5. Hong M., Zhukareva V., Vogelsberg-Ragaglia V., Wszolek Z., Reed L., Miller B. I., Geschwind D. H., Bird T. D., McKeel D., Goate A., Morris J. C., Wilhelmsen K. C., Schellenberg G. D., Trojanowski J. Q., Lee V. M. (1998) Mutation-specific functional impairments in distinct Tau isoforms of hereditary FTDP-17. Science 282, 1914–1917 [DOI] [PubMed] [Google Scholar]
- 6. Houlden H., Baker M., Morris H. R., MacDonald N., Pickering-Brown S., Adamson J., Lees A. J., Rossor M. N., Quinn N. P., Kertesz A., Khan M. N., Hardy J., Lantos P. L., St George-Hyslop P., Munoz D. G., Mann D., Lang A. E., Bergeron C., Bigio E. H., Litvan I., Bhatia K. P., Dickson D., Wood N. W., Hutton M. (2001) Corticobasal degeneration and progressive supranuclear palsy share a common Tau haplotype. Neurology 56, 1702–1706 [DOI] [PubMed] [Google Scholar]
- 7. Pittman A. M., Myers A. J., Abou-Sleiman P., Fung H. C., Kaleem M., Marlowe L., Duckworth J., Leung D., Williams D., Kilford L., Thomas N., Morris C. M., Dickson D., Wood N. W., Hardy J., Lees A. J., de Silva R. (2005) Linkage disequilibrium fine mapping and haplotype association analysis of the Tau gene in progressive supranuclear palsy and corticobasal degeneration. J. Med. Genet. 42, 837–846 [DOI] [PMC free article] [PubMed] [Google Scholar]
- 8. Rademakers R., Melquist S., Cruts M., Theuns J., Del-Favero J., Poorkaj P., Baker M., Sleegers K., Crook R., De Pooter T., Bel Kacem S., Adamson J., Van den Bossche D., Van den Broeck M., Gass J., Corsmit E., De Rijk P., Thomas N., Engelborghs S., Heckman M., Litvan I., Crook J., De Deyn P. P., Dickson D., Schellenberg G. D., Van Broeckhoven C., Hutton M. L. (2005) High density SNP haplotyping suggests altered regulation of Tau gene expression in progressive supranuclear palsy. Hum. Mol. Genet. 14, 3281–3292 [DOI] [PubMed] [Google Scholar]
- 9. Hutton M., Lendon C. L., Rizzu P., Baker M., Froelich S., Houlden H., Pickering-Brown S., Chakraverty S., Isaacs A., Grover A., Hackett J., Adamson J., Lincoln S., Dickson D., Davies P., Petersen R. C., Stevens M., de Graaff E., Wauters E., van Baren J., Hillebrand M., Joosse M., Kwon J. M., Nowotny P., Che L. K., Norton J., Morris J. C., Reed L. A., Trojanowski J., Basun H., Lannfelt L., Neystat M., Fahn S., Dark F., Tannenberg T., Dodd P. R., Hayward N., Kwok J. B., Schofield P. R., Andreadis A., Snowden J., Craufurd D., Neary D., Owen F., Oostra B. A., Hardy J., Goate A., van Swieten J., Mann D., Lynch T., Heutink P. (1998) Association of missense and 5′-splice site mutations in Tau with the inherited dementia FTDP-17. Nature 393, 702–705 [DOI] [PubMed] [Google Scholar]
- 10. Spillantini M. G., Goedert M., Crowther R. A., Murrell J. R., Farlow M. R., Ghetti B. (1997) Familial multiple system tauopathy with presenile dementia: A disease with abundant neuronal and glial Tau filaments. Proc. Natl. Acad. Sci. U.S.A. 94, 4113–4118 [DOI] [PMC free article] [PubMed] [Google Scholar]
- 11. Goedert M., Spillantini M. G., Potier M. C., Ulrich J., Crowther R. A. (1989) Cloning and sequencing of the cDNA encoding an isoform of microtubule-associated protein Tau containing four tandem repeats: Differential expression of Tau protein mRNAs in human brain. EMBO J. 8, 393–399 [DOI] [PMC free article] [PubMed] [Google Scholar]
- 12. Armstrong R. A., Cairns N. J., Lantos P. L. (1999) Quantification of pathological lesions in the frontal and temporal lobe of ten patients diagnosed with Pick disease. Acta Neuropathol. 97, 456–462 [DOI] [PubMed] [Google Scholar]
- 13. Hof P. R., Bouras C., Perl D. P., Morrison J. H. (1994) Quantitative neuropathologic analysis of Pick disease cases: Cortical distribution of Pick bodies and coexistence with Alzheimer disease. Acta Neuropathol. 87, 115–124 [DOI] [PubMed] [Google Scholar]
- 14. Brandt R., Léger J., Lee G. (1995) Interaction of Tau with the neural plasma membrane mediated by Tau's amino-terminal projection domain. J. Cell Biol. 131, 1327–1340 [DOI] [PMC free article] [PubMed] [Google Scholar]
- 15. Chen J., Kanai Y., Cowan N. J., Hirokawa N. (1992) Projection domains of MAP2 and Tau determine spacings between microtubules in dendrites and axons. Nature 360, 674–677 [DOI] [PubMed] [Google Scholar]
- 16. Lee G., Neve R. L., Kosik K. S. (1989) The microtubule binding domain of Tau protein. Neuron 2, 1615–1624 [DOI] [PubMed] [Google Scholar]
- 17. Novak M., Kabat J., Wischik C. M. (1993) Molecular characterization of the minimal protease-resistant Tau unit of the Alzheimer disease paired helical filament. EMBO J. 12, 365–370 [DOI] [PMC free article] [PubMed] [Google Scholar]
- 18. Goode B. L., Chau M., Denis P. E., Feinstein S. C. (2000) Structural and functional differences between 3-repeat and 4-repeat Tau isoforms. Implications for normal Tau function and the onset of neurodegenetative disease. J. Biol. Chem. 275, 38182–38189 [DOI] [PubMed] [Google Scholar]
- 19. Levy S. F., Leboeuf A. C., Massie M. R., Jordan M. A., Wilson L., Feinstein S. C. (2005) Three- and four-repeat Tau regulate the dynamic instability of two distinct microtubule subpopulations in qualitatively different manners. Implications for neurodegeneration. J. Biol. Chem. 280, 13520–13528 [DOI] [PubMed] [Google Scholar]
- 20. Adams S. J., DeTure M. A., McBride M., Dickson D. W., Petrucelli L. (2010) Three repeat isoforms of Tau inhibit assembly of four repeat Tau filaments. PLoS One 5, e10810. [DOI] [PMC free article] [PubMed] [Google Scholar]
- 21. Barghorn S., Mandelkow E. (2002) Toward a unified scheme for the aggregation of Tau into Alzheimer paired helical filaments. Biochemistry 41, 14885–14896 [DOI] [PubMed] [Google Scholar]
- 22. Combs B., Voss K., Gamblin T. C. (2011) Pseudohyperphosphorylation has differential effects on polymerization and function of Tau isoforms. Biochemistry 50, 9446–9456 [DOI] [PMC free article] [PubMed] [Google Scholar]
- 23. King M. E., Gamblin T. C., Kuret J., Binder L. I. (2000) Differential assembly of human Tau isoforms in the presence of arachidonic acid. J. Neurochem. 74, 1749–1757 [DOI] [PubMed] [Google Scholar]
- 24. Voss K., Gamblin T. C. (2009) GSK-3β phosphorylation of functionally distinct Tau isoforms has differential but mild effects. Mol. Neurodegener. 4, 18. [DOI] [PMC free article] [PubMed] [Google Scholar]
- 25. Kuret J., Congdon E. E., Li G., Yin H., Yu X., Zhong Q. (2005) Evaluating triggers and enhancers of Tau fibrillization. Microsc. Res. Tech. 67, 141–155 [DOI] [PubMed] [Google Scholar]
- 26. Chirita C. N., Congdon E. E., Yin H., Kuret J. (2005) Triggers of full-length Tau aggregation: A role for partially folded intermediates. Biochemistry 44, 5862–5872 [DOI] [PubMed] [Google Scholar]
- 27. Congdon E. E., Kim S., Bonchak J., Songrug T., Matzavinos A., Kuret J. (2008) Nucleation-dependent Tau filament formation: The importance of dimerization and an estimation of elementary rate constants. J. Biol. Chem. 283, 13806–13816 [DOI] [PMC free article] [PubMed] [Google Scholar]
- 28. Chang E., Kim S., Schafer K. N., Kuret J. (2011) Pseudophosphorylation of Tau protein directly modulates its aggregation kinetics. Biochim. Biophys. Acta 1814, 388–395 [DOI] [PMC free article] [PubMed] [Google Scholar]
- 29. Chang E., Kim S., Yin H., Nagaraja H. N., Kuret J. (2008) Pathogenic missense MAPT mutations differentially modulate Tau aggregation propensity at nucleation and extension steps. J. Neurochem. 107, 1113–1123 [DOI] [PMC free article] [PubMed] [Google Scholar]
- 30. Carmel G., Leichus B., Cheng X., Patterson S. D., Mirza U., Chait B. T., Kuret J. (1994) Expression, purification, crystallization, and preliminary x-ray analysis of casein kinase-1 from Schizosaccharomyces pombe. J. Biol. Chem. 269, 7304–7309 [PubMed] [Google Scholar]
- 31. Necula M., Kuret J. (2004) Electron microscopy as a quantitative method for investigating Tau fibrillization. Anal. Biochem. 329, 238–246 [DOI] [PubMed] [Google Scholar]
- 32. Rice J. A. (2007) Mathematical Statistics and Data Analysis, 3rd Ed., pp. 165–166, Thomson Higher Education, Belmont, CA [Google Scholar]
- 33. Kristofferson D., Karr T. L., Purich D. L. (1980) Dynamics of linear protein polymer disassembly. J. Biol. Chem. 255, 8567–8572 [PubMed] [Google Scholar]
- 34. Necula M., Kuret J. (2005) Site-specific pseudophosphorylation modulates the rate of Tau filament dissociation. FEBS Lett. 579, 1453–1457 [DOI] [PubMed] [Google Scholar]
- 35. Necula M., Kuret J. (2004) A static laser light scattering assay for surfactant-induced Tau fibrillization. Anal. Biochem. 333, 205–215 [DOI] [PubMed] [Google Scholar]
- 36. Ferrone F. (1999) Analysis of protein aggregation kinetics. Methods Enzymol. 309, 256–274 [DOI] [PubMed] [Google Scholar]
- 37. Fesce R., Benfenati F., Greengard P., Valtorta F. (1992) Effects of the neuronal phosphoprotein synapsin I on actin polymerization. II. Analytical interpretation of kinetic curves. J. Biol. Chem. 267, 11289–11299 [PubMed] [Google Scholar]
- 38. Evans K. C., Berger E. P., Cho C. G., Weisgraber K. H., Lansbury P. T., Jr. (1995) Apolipoprotein E is a kinetic but not a thermodynamic inhibitor of amyloid formation: Implications for the pathogenesis and treatment of Alzheimer disease. Proc. Natl. Acad. Sci. U.S.A. 92, 763–767 [DOI] [PMC free article] [PubMed] [Google Scholar]
- 39. Chiti F., Stefani M., Taddei N., Ramponi G., Dobson C. M. (2003) Rationalization of the effects of mutations on peptide and protein aggregation rates. Nature 424, 805–808 [DOI] [PubMed] [Google Scholar]
- 40. Siddiqua A., Margittai M. (2010) Three- and four-repeat Tau coassemble into heterogeneous filaments: An implication for Alzheimer disease. J. Biol. Chem. 285, 37920–37926 [DOI] [PMC free article] [PubMed] [Google Scholar]
- 41. Goedert M., Spillantini M. G., Jakes R., Rutherford D., Crowther R. A. (1989) Multiple isoforms of human microtubule-associated protein Tau: sequences and localization in neurofibrillary tangles of Alzheimer disease. Neuron 3, 519–526 [DOI] [PubMed] [Google Scholar]
- 42. Kenessey A., Yen S. H. (1993) The extent of phosphorylation of fetal Tau is comparable with that of PHF-Tau from Alzheimer paired helical filaments. Brain Res. 629, 40–46 [DOI] [PubMed] [Google Scholar]
- 43. Gearing M., Rebeck G. W., Hyman B. T., Tigges J., Mirra S. S. (1994) Neuropathology and apolipoprotein E profile of aged chimpanzees: implications for Alzheimer disease. Proc. Natl. Acad. Sci. U.S.A. 91, 9382–9386 [DOI] [PMC free article] [PubMed] [Google Scholar]
- 44. Holzer M., Craxton M., Jakes R., Arendt T., Goedert M. (2004) Tau gene (MAPT) sequence variation among primates. Gene 341, 313–322 [DOI] [PubMed] [Google Scholar]
- 45. Duff K., Knight H., Refolo L. M., Sanders S., Yu X., Picciano M., Malester B., Hutton M., Adamson J., Goedert M., Burki K., Davies P. (2000) Characterization of pathology in transgenic mice overexpressing human genomic and cDNA Tau transgenes. Neurobiol. Dis. 7, 87–98 [DOI] [PubMed] [Google Scholar]
- 46. Zody M. C., Jiang Z., Fung H. C., Antonacci F., Hillier L. W., Cardone M. F., Graves T. A., Kidd J. M., Cheng Z., Abouelleil A., Chen L., Wallis J., Glasscock J., Wilson R. K., Reily A. D., Duckworth J., Ventura M., Hardy J., Warren W. C., Eichler E. E. (2008) Evolutionary toggling of the MAPT 17q21.31 inversion region. Nat. Genet. 40, 1076–1083 [DOI] [PMC free article] [PubMed] [Google Scholar]
- 47. Caffrey T. M., Joachim C., Wade-Martins R. (2008) Haplotype-specific expression of the N-terminal exons 2 and 3 at the human MAPT locus. Neurobiol. Aging 29, 1923–1929 [DOI] [PMC free article] [PubMed] [Google Scholar]
- 48. Müller R., Heinrich M., Heck S., Blohm D., Richter-Landsberg C. (1997) Expression of microtubule-associated proteins MAP2 and Tau in cultured rat brain oligodendrocytes. Cell Tissue Res. 288, 239–249 [DOI] [PubMed] [Google Scholar]
- 49. Santacruz K., Lewis J., Spires T., Paulson J., Kotilinek L., Ingelsson M., Guimaraes A., DeTure M., Ramsden M., McGowan E., Forster C., Yue M., Orne J., Janus C., Mariash A., Kuskowski M., Hyman B., Hutton M., Ashe K. H. (2005) Tau suppression in a neurodegenerative mouse model improves memory function. Science 309, 476–481 [DOI] [PMC free article] [PubMed] [Google Scholar]
- 50. Spittaels K., Van den Haute C., Van Dorpe J., Bruynseels K., Vandezande K., Laenen I., Geerts H., Mercken M., Sciot R., Van Lommel A., Loos R., Van Leuven F. (1999) Prominent axonopathy in the brain and spinal cord of transgenic mice overexpressing four-repeat human Tau protein. Am. J. Pathol. 155, 2153–2165 [DOI] [PMC free article] [PubMed] [Google Scholar]
- 51. Ginsberg S. D., Che S., Counts S. E., Mufson E. J. (2006) Shift in the ratio of three-repeat Tau and four-repeat Tau mRNAs in individual cholinergic basal forebrain neurons in mild cognitive impairment and Alzheimer disease. J. Neurochem. 96, 1401–1408 [DOI] [PubMed] [Google Scholar]
- 52. Ghoshal N., García-Sierra F., Wuu J., Leurgans S., Bennett D. A., Berry R. W., Binder L. I. (2002) Tau conformational changes correspond to impairments of episodic memory in mild cognitive impairment and Alzheimer disease. Exp. Neurol. 177, 475–493 [DOI] [PubMed] [Google Scholar]
- 53. Gómez-Isla T., Price J. L., McKeel D. W., Jr., Morris J. C., Growdon J. H., Hyman B. T. (1996) Profound loss of layer II entorhinal cortex neurons occurs in very mild Alzheimer disease. J. Neurosci. 16, 4491–4500 [DOI] [PMC free article] [PubMed] [Google Scholar]
- 54. Rademakers R., Cruts M., van Broeckhoven C. (2004) The role of Tau (MAPT) in frontotemporal dementia and related tauopathies. Hum. Mutat. 24, 277–295 [DOI] [PubMed] [Google Scholar]
- 55. Caffrey T. M., Joachim C., Paracchini S., Esiri M. M., Wade-Martins R. (2006) Haplotype-specific expression of exon 10 at the human MAPT locus. Hum. Mol. Genet. 15, 3529–3537 [DOI] [PubMed] [Google Scholar]
- 56. Conrad C., Zhu J., Conrad C., Schoenfeld D., Fang Z., Ingelsson M., Stamm S., Church G., Hyman B. T. (2007) Single molecule profiling of Tau gene expression in Alzheimer disease. J. Neurochem. 103, 1228–1236 [DOI] [PubMed] [Google Scholar]
- 57. Yasojima K., McGeer E. G., McGeer P. L. (1999) Tangled areas of Alzheimer brain have up-regulated levels of exon 10 containing Tau mRNA. Brain Res. 831, 301–305 [DOI] [PubMed] [Google Scholar]
- 58. Feany M. B., Ksiezak-Reding H., Liu W. K., Vincent I., Yen S. H., Dickson D. W. (1995) Epitope expression and hyperphosphorylation of Tau protein in corticobasal degeneration: Differentiation from progressive supranuclear palsy. Acta Neuropathol. 90, 37–43 [DOI] [PubMed] [Google Scholar]
- 59. Ksiezak-Reding H., Morgan K., Mattiace L. A., Davies P., Liu W. K., Yen S. H., Weidenheim K., Dickson D. W. (1994) Ultrastructure and biochemical composition of paired helical filaments in corticobasal degeneration. Am. J. Pathol. 145, 1496–1508 [PMC free article] [PubMed] [Google Scholar]
- 60. Terada S., Ishizu H., Ishiguro K., Tanabe Y., Itoh N., Yasutake K., Furubayashi A., Kitamura Y., Kuroda S. (2005) Exon 3 insert of Tau protein in neurodegenerative diseases. Acta Neuropathol. 110, 12–18 [DOI] [PubMed] [Google Scholar]
- 61. Singleton A., Myers A., Hardy J. (2004) The law of mass action applied to neurodegenerative disease: A hypothesis concerning the etiology and pathogenesis of complex diseases. Hum. Mol. Genet. 13, R123–126 [DOI] [PubMed] [Google Scholar]
- 62. Sergeant N., Sablonnière B., Schraen-Maschke S., Ghestem A., Maurage C. A., Wattez A., Vermersch P., Delacourte A. (2001) Dysregulation of human brain microtubule-associated Tau mRNA maturation in myotonic dystrophy type 1. Hum. Mol. Genet. 10, 2143–2155 [DOI] [PubMed] [Google Scholar]
- 63. Delacourte A., Sergeant N., Wattez A., Gauvreau D., Robitaille Y. (1998) Vulnerable neuronal subsets in Alzheimer and Pick disease are distinguished by their Tau isoform distribution and phosphorylation. Ann. Neurol. 43, 193–204 [DOI] [PubMed] [Google Scholar]
- 64. Bullmann T., de Silva R., Holzer M., Mori H., Arendt T. (2007) Expression of embryonic Tau protein isoforms persist during adult neurogenesis in the hippocampus. Hippocampus 17, 98–102 [DOI] [PubMed] [Google Scholar]
- 65. García de Ancos J., Correas I., Avila J. (1993) Differences in microtubule binding and self-association abilities of bovine brain Tau isoforms. J. Biol. Chem. 268, 7976–7982 [PubMed] [Google Scholar]
- 66. Reynolds M. R., Berry R. W., Binder L. I. (2005) Site-specific nitration and oxidative dityrosine bridging of the Tau protein by peroxynitrite: Implications for Alzheimer disease. Biochemistry 44, 1690–1700 [DOI] [PubMed] [Google Scholar]