

Abstract
microRNAs (miRNAs) are small RNAs shown to contribute to a number of cellular processes including cell growth, differentiation, and apoptosis. MiRNAs regulate gene expression of their targets post-transcriptionally by binding to messenger RNA (mRNA), causing translational inhibition or mRNA degradation. Dysregulation of miRNA expression can promote cancer formation and progression. Research has largely focused on the function and expression of single miRNAs. However, complex physiological processes require the interaction, regulation and coordination of many molecules including miRNAs and proteins. Highly connected molecules often serve important roles in the cell. A protein–protein interaction network of established miRNA targets confirmed these proteins to be highly connected and essential to the cell, affecting tumorigenesis, cell growth/proliferation, cellular death, cell assembly, and maintenance pathways. This analysis showed that miRNAs contribute to the overall health of the prostate, and their aberrant expression destabilized homeostatic balance. This integrative network approach can reveal important miRNAs and proteins in prostate cancer that will be useful to identify specific disease biomarkers, which may be used as targets for therapeutics or drugs in themselves.
Introduction
Cancer is a highly heterogeneous, multifactorial disease that results from numerous genetic mutations, aberrant gene expression, and microRNA (miRNA) dysregulation [1]. Prostate cancer (CaP) is the second leading cause of cancer related deaths of men in the United States with 193,000 men diagnosed in 2009. It is predicted that nearly 27,000 will eventually succumb to the disease, and likely that one of every six men will develop CaP during their lifetime. A variety of genetic and epigenetic factors such as age, race, heredity, diet, sexual frequency, and physical activity are known to influence the development of prostate tumors [2].
In recent years, miRNAs have emerged as an important class of non-coding RNAs that influence post-transcriptional protein levels. In the presence of external cues and environmental stressors, miRNAs have the ability to induce rapid changes in the proteome allowing the cell to respond in a rapid, more precise, and energy-efficient mechanism [3]. Numerous cellular processes are affected by miRNA, including differentiation, growth/hypertrophy, cell-cycle control, and apoptosis [4]. Mature miRNAs are ca. 22 nucleotides in length and regulate protein levels by binding mostly to the 3′-untranslated region (3′-UTR) of a messenger RNA, inducing translational repression or message cleavage. Aberrant expression of miRNAs contributes to the development of many pathological conditions, including cancers of the breast, prostate, thyroid, and B-cell lymphomas [5][6].
Many miRNA genes are dysregulated in cancer and influence tumor formation/progression because they are located in regions of the genome that are commonly overexpressed or deleted [7]. Dysregulated miRNAs have been shown to contribute to oncogenesis by the loss of tumor-suppressing miRNAs or increased expression of oncomiRs [8]. While tumor-suppressing miRNAs are lost or reduced during oncogenesis, oncomiRs are amplified or overexpressed. Either loss of tumor suppressors or increased expression of oncomiRs ultimately results in increased cell growth, proliferation, invasiveness, or metastasis. Aberrant expression of even a single miRNA has the potential to influence a large number of cellular processes, as it is predicted that each miRNA has the potential to affect hundreds of proteins. Thus, dysregulation can destabilize homeostatic balance by affecting levels of a multitude of target proteins.
Complex physiological processes can rarely be ascribed to a single molecule [9]. Instead, they arise out of the interaction and coordination of large numbers of proteins, nucleic acids, and other macromolecules. Healthy organisms intricately regulate thousands of components with remarkable fidelity and accuracy [1]. Protein–protein interactions are essential to many biological processes and mediate many of the reactions necessary to sustain life. A key strategy to understand the molecular workings of the cell is the systematic identification of crucial protein interactions [10].
These interactions can be modeled as a biological network with proteins represented as nodes and interactions among the proteins represented as edges. Topological features of the network can be described mathematically and used to infer molecular contribution to network/cellular stability. As observed, widespread miRNA dysregulation contributes to the development of many forms of cancer including cancer of the prostate. This work utilized a systems-based, network approach to understand the impact of miRNA dysregulation on the overall stability of a protein–protein interaction network.
Results and Discussion
Analysis of miRNA Contributions to Prostate Tumori-genesis
Dysregulation of miRNAs may result in tumor formation and progression through the increased expression of oncomiRs or decreased expression of tumor suppressors. Mir2disease is a manually curated database which associates experimentally supported miRNA dysregulation with disease [11]. Consideration of only experimentally established miRNA/disease associations will not reveal every miRNA that is involved in prostate cancer. However, this approach is more favorable than approaches that consider putative interactions, as they suffer from an inherent lack of sensitivity evidenced by large numbers of false positive predictions. A search of the miR2disease database reveals a total of 111 miRNAs that contribute to prostate tumorigenesis and cancer progression when significantly dysregulated. It remains to be determined whether or not miRNA dysregulation is the cause of tumorigenesis, a consequence of tumorigenesis, or both. Previously, global decrease of miRNA expression levels during tumorigenesis had been observed, leading to the hypothesis that most miRNAs function as tumor suppressors [6]. Our analysis using the miR2diease database revealed that there are approximately as many oncomiRs as tumor suppressing miRNAs. Sixty microRNAs showed increased expression levels (oncomiRs) in tumor samples compared to normal tissue, whereas 51 miRNAs decreased in tumor samples (tumor suppressors; Fig. 1).
Fig. 1. MicroRNA Dysregulation in prostate cancer.
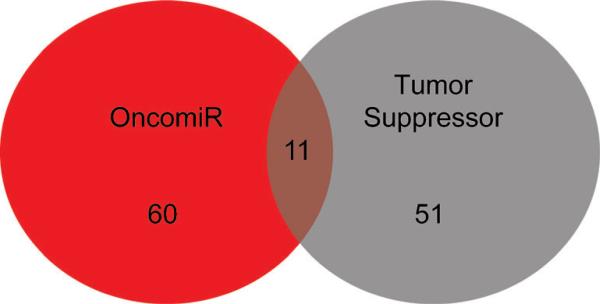
microRNAs involved in prostate cancer progression were extracted from the miR2Disease database along with their potential roles in cancer as defined by their expression status. A Venn diagram illustrating the numbers of oncomiRs, tumor suppressors, and miRNAs that can function as either a tumor suppressor or oncomiR was generated.
Interestingly, there are eleven examples in which the same miRNA displays contrasting behaviors in prostate tumors. These have the potential to act as either oncomiRs or tumor suppressors during tumorigenesis. Their expression levels may vary depending upon the degree of cellular de-differentiation. For example, hsa-miR-125b (miR-125b) has been reported by several groups to significantly decrease during tumorigenesis. MiR-125b coordinately regulates two members of the human epidermal growth factor receptor family (ErbB2/HER2/NEU, ErbBB3/HER3) [3][12–14]. Decreased expression or loss of miR-125b results in an increase in both ERBB2/ERBB3 protein levels, thereby enhancing the invasive potential of the cell leading to tumor formation and progression [15].
Conversely, the androgen-independent LNCaP sublines (CDS1 and CDS2) lead to higher levels of miR-125b compared to the androgen-dependent LnCaP sublines [14]. Treatment of androgen-dependent LNCaP cells with synthetic miR-125b allowed them to survive in androgen-depleted media. The cellular effects of miR-125b under androgen-dependent conditions are mediated through the translational suppression of BAK1 [3]. BAK1, a member of the BCL2 protein family, functions as a pro-apoptotic factor [16]. Suppression of pro-apoptotic factors increases the oncogenic potential of the cell.
A similar observation was made with hsa-miR-146a, which can function as an oncomiR in many tumors, but in androgen-independent tumors functions as a tumor suppressor [12][17]. Altogether, these two examples illustrate how a single miRNA (miR-125b, miR-146a) can function as a tumor suppressor or an oncomiR dependent upon another variable, in these cases androgen dependence. Most likely similar situations could be found for the other overlapping group members.
Protein–Protein Interaction of Prostate Cancer miRNA Targets Show Scale-Free Behavior
Nearly every biological process depends upon protein–protein interactions [18]. Disruptions or perturbations in these interactions underlie many human diseases including cancer. Protein–protein interactions are modeled using a system-based, network approach and described mathematically. Two protein–protein interaction networks were built from informations gathered from the PubMed, Online Mendelian Inheritance in Men, and the US Patent Office databases using the Agilent Literature Search plugin in Cytoscape. Topological network characteristics were determined using CentiScaPe [19–21].
The first network was built using established targets of dysregulated miRNAs shown to contribute to the development of prostate cancer. A second similar network of randomly sampled proteins expressed in the prostate, but chosen without regard to miRNA status, was compiled. Both the network of dysregulated miRNA protein targets and randomly selected prostate proteins possessed a scale-free form (Fig. 2). However, they differed in the average connectivity as determined by node degree with the miRNA targeted network having a much higher average connectivity measure. Node degree is a measure of interactions among the molecules in a network. In a scale-free network, as the node degree increases, the frequency observed decreases, with most nodes having only a few connected neighbors. This functional organization commonly seen in a complex system ensures redundancy in the system resulting in some amount of fault tolerance [9].
Fig. 2. Targets of miRNAs involved in prostate cancer are more highly connected than randomly chosen protein.

Two shortest path protein–protein interaction networks were built using the Agilent literature search function within Cytoscape 2.8 and topological measures evaluated using CenstiScaPe 2.76. The first network was built using established targets of miRNAs that are dysregulated during the development of prostate cancer (red). The other network was built from randomly chosen proteins that are expressed in the prostate, but chosen without regard to miRNA status (blue). Frequency distributions of the node degree for the two shortest path networks are displayed
miRNAs Dysregulated in Prostate Cancer Preferentially Regulate Highly Connected Proteins
Node degree is one topological measure that can be used to infer the contribution of a protein towards cellular/network stability. Analysis of the average node degree revealed an overall enrichment of highly connected proteins in the prostate cancer miRNA target network not seen in the network of randomly selected prostate proteins (p ≤ 0.0001; Table 1). The average protein in the miRNA-targeted network was connected to nearly 30 other proteins. Conversely, the average protein in the randomly chosen network was only connected to approximately five others. Of the top candidates in the prostate cancer miRNA-targeted network, mitogen-activated protein kinase 14 (MAPK14) was the most connected with a node degree of 290. It is important to note that the node degree represents a maximum protein potential, not all 290 proteins will interact with MAPK14 at the same time. Instead, MAPK14 will interact with a small number of proteins at any moment, and the neighbors change depending upon the needs of the cell. The most highly connected protein in our randomly generated prostate network was only connected to 28 other proteins, a tenfold difference. A list of prostate-cancer miRNA-targeted proteins with a node degree over 200 is included in Table 2. This list is rich in well-known cancer related proteins, many of which are current or proposed drug targets.
Table 1.
Comparison of Network Node Distribution of the Prostate Cancer miRNA Target Network and the Randomly Chosen Prostate Protein Network
| Network | Mean degree | Standard deviation | Minimum | Maximum |
|---|---|---|---|---|
| Prostate cancer miRNA target protein | 29.80 | 47.75 | 1 | 290 |
| Random prostate protein | 4.46 | 4.24 | 1 | 28 |
Table 2.
Protein Nodes with Connectivity Degrees Greater Than 200
| Protein | Name | Node degree | Function | Known miRNA |
|---|---|---|---|---|
| MAPK14 | Mitogen activated protein kinase 14 | 290 | Cell proliferation, differentiation, and transcription regulation | hsa-miR-124, hsa-miR-24 |
| SP1 | SP1 Transcription factor | 269 | Cell growth, differentiation, and apoptosis | hsa-miR-218, hsa-miR-124, hsa-miR-29b |
| VEGFA | Vascular endothelial growth factor | 267 | Angiogenesis, vasculogenesis, and vascular endothelial cell growth | hsa-miR-205, has-miR-200b, hsa-miR-126, hsa-miR-93 |
| CASP3 | Caspase 3 | 258 | Execution phase of apoptosis | hsa-let-7a, hsa-let-7e |
| MYC | Transcription factor | 254 | Cell cycle progression, apoptosis, and cell transformation | hsa-miR-24, hsa-miR-145, hsa-miR-34c-5p, hsa-miR-34a, hsa-miR-34b*, hsa-let-7c |
| EGFR | Epidermal growth factor receptor | 248 | Cell proliferation | hsa-miR-1, hsa-miR-7, hsa-miR-16 |
| BCL2 | B-cell lymphoma 2 | 247 | Apoptosis | hsa-miR-15, hsa-miR-1, hsa-miR-20a, hsa-miR- 34a, hsa-miR-181a, hsa-miR-296-5p, hsa-miR- 15a, hsa-miR-153, hsa-miR-17, hsa-miR-15b |
| CTNNB1 | Catenin Beta 1 | 232 | Cell growth regulator and cell adhesion | hsa-miR-155 |
| JUN | Jun proto oncogene | 229 | Transcription factor, angiogenesis, apoptosis | hsa-miR-15a, hsa-miR-16, hsa-miR-30 |
| TNF | Tumor necrosis factor | 217 | Cell proliferation, differentiation, apoptosis, lipid metabolism, and coagulation | hsa-miR-146a |
| FGF2 | Fibroblast growth factor 2 | 216 | Cell proliferation, angiogenesis | hsa-miR-16 |
| TP53 | Tumor protein 53 | 213 | Cell cycle regulation and apoptosis | hsa-miR-129–5p, hsa-miR-125a-5p, hsa-miR-1285, hsa-miR-125b |
| PPARG | Peroxisome proliferator activated receptor gamma | 213 | Regulator of adipocyte differentiation | hsa-miR-27b |
| ESR1 | Estrogen receptor 1 | 212 | Cell growth, differentiation, and sexual reproduction | hsa-miR-302c, hsa-miR-20b, hsa-miR-19b, hsa- miR-18a, hsa-miR-181a, hsa-miR-206, hsa-miR- 22, hsa-miR-181b, hsa-miR-193b, hsa-miR-19a |
| TGFB1 | Transforming growth factor beta 1 | 208 | Cell proliferation, differentiation, adhesion, and migration | hsa-miR-141, has-miR-128a |
| CCND1 | Cyclin D1 | 203 | Cell cycle control | hsa-miR-16, hsa-let-7b, hsa-miR-17, hsa-miR- 195, hsa-miR-34a, hsa-miR-20a, hsa-miR-15a, hsa-miR-19a, hsa-miR-155, hsa-miR-503 |
Perturbation of these highly connected nodes is more likely to negatively impact network stability [1]. It has been shown that molecules with a higher node degree are essential to the cell, and their loss often results in a disease state such as cancer [22][23]. There is a positive correlation between protein essentiality and connectivity indicating that the more connected a protein is, the greater the likelihood that it is essential to life. Conversely, molecules with a lower number of connecting neighbors are not as likely to disrupt the system when they are perturbed. Disease causing genes are more likely to encode highly connected proteins [24][25]. This analysis indicated that miRNAs have a strong likelihood of impacting the network structure, and dysregulation is more likely to affect essential proteins causing diseases like cancer.
Randomization of the prostate cancer miRNA-targeted network was performed to estimate the likelihood that this arrangement arose out of chance. The network was compared to a null model obtained by a shuffled (50,000 X) version of itself [26]. Shuffling was accomplished using an algorithm that preserves the overall node-degree distribution in order to emulate the properties found in the prostate miRNA-targeted network. The randomized networks did not result in a mean clustering coefficient (C=0.029) similar to the protein–protein interaction network (C=0.621). This measure evidences that the arrangement of the proteins in this network is not random, but results from clusters of associated proteins, as would be expected in a complex, living system. Randomly generated networks of the same degree and distribution do not maintain this modularity.
OncomiRs Regulate More Highly Connected Proteins Than Tumor Suppressors
A one-way analysis of variance (ANOVA) revealed statistically significant connectivity differences among the targets of oncomiRs and targets of tumor suppressing miRNAs (F2,503=6.2821, p=0.002). Oncogenic miRNAs showed a regulatory preference towards more highly connected proteins. While the connectivity of an oncomiR target was 39, the average connectivity of a tumor suppressor miRNA target was only 27 other proteins (Table 3). Interestingly, the targets of the eleven miRNAs that can function as tumor suppressors or oncomiRs depending upon a second variable exhibited a much higher average target node degree (61) than either oncomiRs or tumor suppressors alone.
Table 3.
miRNA–Target Connectivity Changes with the Role of the miRNA
| Description | Number of nodes regulated by miRNA type | Node degree |
|---|---|---|
| OncomiR (Expression increases during tumorigenesis) | 192 | 39 |
| Tumor Suppressor ( Expression decreases during tumorigenesis) | 276 | 27 |
| Both (Exhibits both behaviors dependent upon a second variable) | 37 | 61 |
Cancer-related proteins in general show greater node degree and higher connectivity than non-cancer associated proteins [27][28]. The protein products of tumor-suppressing genes are known to be more centrally located and more highly connected than the products of oncogenes [29]. In our analysis, we found that the connectivity of oncomiR targets was higher than the targets of tumor-suppressing miRNAs. It is important to remember that miRNAs are negative regulators of protein translation, and the targets of oncomiRs would be tumor suppressive proteins. This analysis confirmed that miRNA dysregulation contributed to the development of prostate cancer.
Highly Connected Proteins Possess More Than One miRNA-Binding Site
A comparison of proteins in the prostate cancer miRNA-targeted network revealed that there was a positive correlation between protein connectivity and the number of different experimentally established miRNA binding sites in the 3′-UTR (Fig. 3). That is, as a protein interacts with a higher number of other proteins, it is more likely to be regulated by multiple miRNAs. miRNAs may act cooperatively through the simultaneous interaction of multiple miRNA species with the 3′-UTR of a transcript [30]. In the case of vascular endothelial growth factor (VEGFA), multiple distinct binding sites were observed in the 3′-UTR. Transfection with varying combinations of miRNAs resulted in additive levels of translational repression. VEGFA was the third most highly connected protein in our prostate cancer miRNA target network (Table 2).
Fig. 3. Proteins regulated by multiple miRNAs are more likely to be highly connected.

Proteins were grouped according to the number of miRNAs that have been established to regulate their translation. The number of miRNAs that regulate a protein (independent variable) was plotted against the average node degree of the targets (dependent variable), and a best fit linear equation was generated (y=17.91, x=7.9; r2=0.831). Proteins that were regulated by 6–10 miRNA species were grouped into a single group, because there were only a few established examples regulated by more than 6 miRNAs.
Although not included in Table 2, another example of a highly connected protein under multiple miRNA regulation is the cyclin-dependent kinase inhibitor 1A (CDKN1A). CDKN1A was regulated by the largest number of unique miRNAs (28) and connects to 190 other proteins [31]. Many tumor-suppressor pathways are under the control of CDKN1A, and its decreased expression increases the likelihood of cancer development [32]. As a potent cell proliferation inhibitor, CDKN1A is an important modulator of the cyclin-dependent kinases (CDK) that regulate cell-cycle progression through the G1/S checkpoint. Loss of the CDK inhibitor allows the cell to proceed through the cell cycle and diminishes the cell's response to DNA damage. Increased expression of any of the miRNAs that regulate CDKN1A would decrease protein levels and induce oncogenic transformation. This analysis showed that important proteins were regulated by multiple miRNAs, and dysregulation of any of these miRNAs could result in a disease state such as cancer.
Conclusions
Cancer is a multifactorial disease that arises from the accumulation of genetic and epigenetic changes that lead to oncogenic transformation causing cells to proliferate uncontrollably. miRNAs are an important class of translational regulatory agents that affect cell proliferation, differentiation, cell cycle control, and apoptosis. Increased expression of oncomiRs or decreased expression of tumor suppressors leads to uncontrolled cell proliferation, invasion, and metastasis.
Because of the scale-free design of complex systems and a higher average node degree, miRNA protein targets are more vulnerable to targeted attacks that may lead to catastrophic cellular failures [9]. A single dysregulated miRNA has the potential to induce a significant number of cellular changes by affecting multiple highly connected proteins. It is important to consider that modulation of a single highly connected protein node has the potential to affect hundreds of downstream targets, thereby modifying multiple pathways resulting in considerable physiological fluctuation. During the development of prostate cancer, there is wide-scale dysregulation of miRNA expression affecting numerous highly connected, essential disease-causing proteins and numerous cellular pathways.
By combining knowledge of miRNA dysregulation with topological descriptors of a protein–protein interaction network, we may identify important proteins contributing to tumor progression that have not been previously described. This analysis can be used to identify newer, more relevant indicators of prostate cancer and may offer insights toward the development of targeted molecular therapies.
Experimental Part
Dysregulated miRNAs Contributing to Prostate Cancer
miRNAs associated with prostate cancer (111) were compiled from the miR2disease online resource [11]. Utilizing the built-in search function for miRNAs associated with a specific disease, the database was queried using the term ‘prostate carcinoma’ to identify miRNAs related to prostate tumorigenesis, and included both causal and unspecified relationships. Using a PERL script, each miRNA was further evaluated to extract information regarding its expression pattern and literature references for each dysregulated miRNA.
Established Targets of miRNAs Associated with Prostate Cancer
A comprehensive record of established miRNA/gene interactions was assembled from the Tarbase and miRecords repositories of experimentally supported miRNA targets downloaded in May 2011 [33][34]. Utilizing a PERL script, multiple entries were eliminated, and both resources were combined into a single non-redundant list. Dysregulated miRNAs contributing to prostate cancer were associated with validated targets using our comprehensive record.
Prostate gland transcriptome profiles were obtained from the Unigene database in order to build a protein–protein interaction network of prostate-specific miRNA/target interactions [35]. Transcripts that show any level of expression in the prostate gland were extracted and identifiers converted to HUGO gene symbols using a PERL script. By combining the information obtained from the miR2disease database, comprehensive miRNA/target interactions and the list of expressed transcripts in the prostate, we compiled a total of 608 confirmed protein targets that are affected by miRNA dysregulation in the prostate.
Literature Mined Prostate Protein–Protein Interaction Network
The Agilent literature search (v2.76) tool was used in conjunction with Cytoscape 2.8 to infer two protein–protein interaction networks [19][36]. The first was built using known prostate-cancer miRNA targets. Each protein in the candidate list of 608 known prostate-cancer miRNA target proteins was used as a search term in the Agilent literature search tool, and the search was controlled to limited interactions to Homo sapiens with a maximum of ten hits per search string/search engine. The second network was built in the same manner using 608 randomly chosen proteins that are expressed in the prostate gland according to the Unigene database but chosen without regard to known miRNA status [35]. Following network inference, visualization was accomplished using Cytoscape, and topological network descriptors were estimated using CentiScaPe [21].
Randomization of Prostate miRNA Target Protein–Protein Interaction Network
The prostate-cancer miRNA target network was shuffled 50,000 times using a degree preserving edge shuffle random network plugin developed by engineers at Syracuse University and implemented in Cytoscape. The plugin was downloaded (http://sites.google.com/site/randomnetworkplugin/Home) as a .jar file and installed in the Cytoscape package. The application was run across two processors and repeated 50,000 times to generate the best results.
Statistical Analysis
Differences in network distributions were evaluated using an Analysis of Variance test (ANOVA) with significance set at probability ≤0.05. All statistical analyses were performed using JMP 8.0 (Statistical Analysis Software Cary, NC) .The distribution of node degree for the prostate miRNA-targeted network and the randomly selected prostate protein network were created using the R Project for Statistical Computing (http://www.r-project.org/).
Acknowledgments
The authors acknowledge several individuals that contributed to the development and implementation of this project. Danail Bonchev, Nihar Sheth, and Ryan Woodcock of the Center for the Study of Biological Complexity at Virginia Commonwealth University offered insight and advice that influenced this work. Carlisle Childress of the Virginia Commonwealth University Center for High Performance Computing gave assistance with computational support for this project. This work was supported by National Institutes of Health Grant CA152349 to Z. E. Z.
REFERENCES
- 1.Zhu X, Gerstein M, Snyder M. Genes Dev. 2007;21:1010. doi: 10.1101/gad.1528707. [DOI] [PubMed] [Google Scholar]
- 2.Hankey BF, Feuer EJ, Clegg LX, Hayes RB, Legler JM, Prorok PC, Ries LA, Merrill RM, Kaplan RS. J. Natl. Cancer Inst. 1999;91:1017. doi: 10.1093/jnci/91.12.1017. [DOI] [PubMed] [Google Scholar]
- 3.DeVere White RW, Vinall RL, Tepper CG, Shi X-B. Urol. Oncol. 2009;27:307. doi: 10.1016/j.urolonc.2009.01.004. [DOI] [PMC free article] [PubMed] [Google Scholar]
- 4.Calin GA, Croce CM. Cancer Res. 2006;66:7390. doi: 10.1158/0008-5472.CAN-06-0800. [DOI] [PubMed] [Google Scholar]
- 5.Volinia S, Calin GA, Liu C-G, Ambs S, Cimmino A, Petrocca F, Visone R, Iorio M, Roldo C, Ferracin M, Prueitt RL, Yanaihara N, Lanza G, Scarpa A, Vecchione A, Negrini M, Harris CC, Croce CM. Proc. Natl. Acad. Sci. U.S.A. 2006;103:2257. doi: 10.1073/pnas.0510565103. [DOI] [PMC free article] [PubMed] [Google Scholar]
- 6.Lu J, Getz G, Miska EA, Alvarez-Saavedra E, Lamb J, Peck D, Sweet-Cordero A, Ebert BL, Mak RH, Ferrando AA, Downing JR, Jacks T, Horvitz HR, Golub TR. Nature. 2005;435:834. doi: 10.1038/nature03702. [DOI] [PubMed] [Google Scholar]
- 7.Calin GA, Sevignani C, Dumitru CD, Hyslop T, Noch E, Yendamuri S, Shimizu M, Rattan S, Bullrich F, Negrini M, Croce CM. Proc. Natl. Acad. Sci. U.S.A. 2004;101:2999. doi: 10.1073/pnas.0307323101. [DOI] [PMC free article] [PubMed] [Google Scholar]
- 8.Esquela-Kerscher A, Slack FJ. Nat. Rev. Cancer. 2006;6:259. doi: 10.1038/nrc1840. [DOI] [PubMed] [Google Scholar]
- 9.Barabási A-L, Oltvai ZN. Nat. Rev. Genet. 2004;5:101. doi: 10.1038/nrg1272. [DOI] [PubMed] [Google Scholar]
- 10.Yook SH, Oltvai ZN, Barabási AL. Proteomics. 2004;4:928. doi: 10.1002/pmic.200300636. [DOI] [PubMed] [Google Scholar]
- 11.Jiang Q, Wang Y, Hao Y, Juan L, Teng M, Zhang X, Li M, Wang G, Liu Y. Nucleic Acids Res. 2009;37(Suppl. 1):D98. doi: 10.1093/nar/gkn714. [DOI] [PMC free article] [PubMed] [Google Scholar]
- 12.Porkka KP, Pfeiffer MJ, Waltering KK, Vessella RL, Tammela TL, Visakorpi T. Cancer Res. 2007;67:6130. doi: 10.1158/0008-5472.CAN-07-0533. [DOI] [PubMed] [Google Scholar]
- 13.Schaefer A, Jung M, Mollenkopf H-J, Wagner I, Stephan C, Jentzmik F, Miller K, Lein M, Kristiansen G, Jung K. Int. J. Cancer. 2010;126:1166. doi: 10.1002/ijc.24827. [DOI] [PubMed] [Google Scholar]
- 14.Shi X-B, Xue L, Yang J, Ma A-H, Zhao J, Xu M, Tepper CG, Evans CP, Kung H-J, deVere White RW. Proc. Natl. Acad. Sci. U.S.A. 2007;104:19983. doi: 10.1073/pnas.0706641104. [DOI] [PMC free article] [PubMed] [Google Scholar]
- 15.Scott GK, Goga A, Bhaumik D, Berger CE, Sullivan CS, Benz CC. J. Biol. Chem. 2007;282:1479. doi: 10.1074/jbc.M609383200. [DOI] [PubMed] [Google Scholar]
- 16.Safran M, Solomon I, Shmueli O, Lapidot M, Shen-Orr S, Adato A, Ben-Dor U, Esterman N, Rosen N, Peter I, Olender T, Chalifa-Caspi V, Lancet D. Bioinformatics. 2002;18:1542. doi: 10.1093/bioinformatics/18.11.1542. [DOI] [PubMed] [Google Scholar]
- 17.Lin S-L, Chiang A, Chang D, Ying S-Y. RNA. 2008;14:417. doi: 10.1261/rna.874808. [DOI] [PMC free article] [PubMed] [Google Scholar]
- 18.Stelzl U, Worm U, Lalowski M, Haenig C, Brembeck FH, Goehler H, Stroedicke M, Zenkner M, Schoenherr A, Koeppen S, Timm J, Mintzlaff S, Abraham C, Bock N, Kietzmann S, Goedde A, Toksçz E, Droege A, Krobitsch S, Korn B, Birchmeier W, Lehrach H, Wanker EE. Cell. 2005;122:957. doi: 10.1016/j.cell.2005.08.029. [DOI] [PubMed] [Google Scholar]
- 19.Vailaya A, Bluvas P, Kincaid R, Kuchinsky A, Creech M, Adler A. Bioinformatics. 2005;21:430. doi: 10.1093/bioinformatics/bti187. [DOI] [PubMed] [Google Scholar]
- 20.Smoot ME, Ono K, Ruscheinski J, Wang P-L, Ideker T. Bioinformatics. 2011;27:431. doi: 10.1093/bioinformatics/btq675. [DOI] [PMC free article] [PubMed] [Google Scholar]
- 21.Scardoni G, Petterlini M, Laudanna C. Bioinformatics. 2009;25:2857. doi: 10.1093/bioinformatics/btp517. [DOI] [PMC free article] [PubMed] [Google Scholar]
- 22.Batada NN, Hurst LD, Tyers M. PLoS Comput. Biol. 2006;2:e88. doi: 10.1371/journal.pcbi.0020088. [DOI] [PMC free article] [PubMed] [Google Scholar]
- 23.Liang H, Li W-H. Trends Genet. 2007;23:375. doi: 10.1016/j.tig.2007.04.005. [DOI] [PubMed] [Google Scholar]
- 24.Goh K-I, Cusick ME, Valle D, Childs B, Vidal M, Barabási A-L. Proc. Natl. Acad. Sci. U.S.A. 2007;104:8685. doi: 10.1073/pnas.0701361104. [DOI] [PMC free article] [PubMed] [Google Scholar]
- 25.Zanzoni A, Soler-López M, Aloy P. FEBS Lett. 2009;583:1759. doi: 10.1016/j.febslet.2009.03.001. [DOI] [PubMed] [Google Scholar]
- 26.Milo R, Shen-Orr S, Itzkovitz S, Kashtan N, Chklovskii D, Alon U. Science. 2002;298:824. doi: 10.1126/science.298.5594.824. [DOI] [PubMed] [Google Scholar]
- 27.Rambaldi D, Giorgi FM, Capuani F, Ciliberto A, Ciccarelli FD. Trends in Genetics. 2008;24:427. doi: 10.1016/j.tig.2008.06.003. [DOI] [PubMed] [Google Scholar]
- 28.Sun J, Zhao Z. BMC Genomics. 2010;11(Suppl. 3):S5. doi: 10.1186/1471-2164-11-S3-S5. [DOI] [PMC free article] [PubMed] [Google Scholar]
- 29.Hernández P, Huerta-Cepas J, Montaner D, Al-Shahrour F, Valls J, Gómez L, Capellá G, Dopazo J, Pujana MA. BMC Genomics. 2007;8:185. doi: 10.1186/1471-2164-8-185. [DOI] [PMC free article] [PubMed] [Google Scholar]
- 30.Hua Z, Lv Q, Ye W, Wong C-K, Cai G, Gu D, Ji Y, Zhao C, Wang J, Yang BB, Zhang Y. PLoS One. 2006;1:e116. doi: 10.1371/journal.pone.0000116. [DOI] [PMC free article] [PubMed] [Google Scholar]
- 31.Wu S, Huang S, Ding J, Zhao Y, Liang L, Liu T, Zhan R, He X. Oncogene. 2010;29:2302. doi: 10.1038/onc.2010.34. [DOI] [PubMed] [Google Scholar]
- 32.Gartel AL, Tyner AL. Mol. Cancer. Ther. 2002;1:639. [PubMed] [Google Scholar]
- 33.Papadopoulos GL, Reczko M, Simossis VA, Sethupathy P, Hatzigeorgiou AG. Nucleic Acids Res. 2009;37(Suppl. 1):D155. doi: 10.1093/nar/gkn809. [DOI] [PMC free article] [PubMed] [Google Scholar]
- 34.Xiao F, Zuo Z, Cai G, Kang S, Gao X, Li T. Nucleic Acids Res. 2009;37(Suppl. 1):D105. doi: 10.1093/nar/gkn851. [DOI] [PMC free article] [PubMed] [Google Scholar]
- 35.Boguski MS, Schuler GD. Nat. Genet. 1995;10:369. doi: 10.1038/ng0895-369. [DOI] [PubMed] [Google Scholar]
- 36.Cline MS, Smoot M, Cerami E, Kuchinsky A, Landys N, Workman C, Christmas R, Avila-Campilo I, Creech M, Gross B, Hanspers K, Isserlin R, Kelley R, Killcoyne S, Lotia S, Maere S, Morris J, Ono K, Pavlovic V, Pico AR, Vailaya A, Wang P-L, Adler A, Conklin BR, Hood L, Kuiper M, Sander C, Schmulevich I, Schwikowski B, Warner GJ, Ideker T, Bader GD. Nat. Protoc. 2007;2:2366. doi: 10.1038/nprot.2007.324. [DOI] [PMC free article] [PubMed] [Google Scholar]