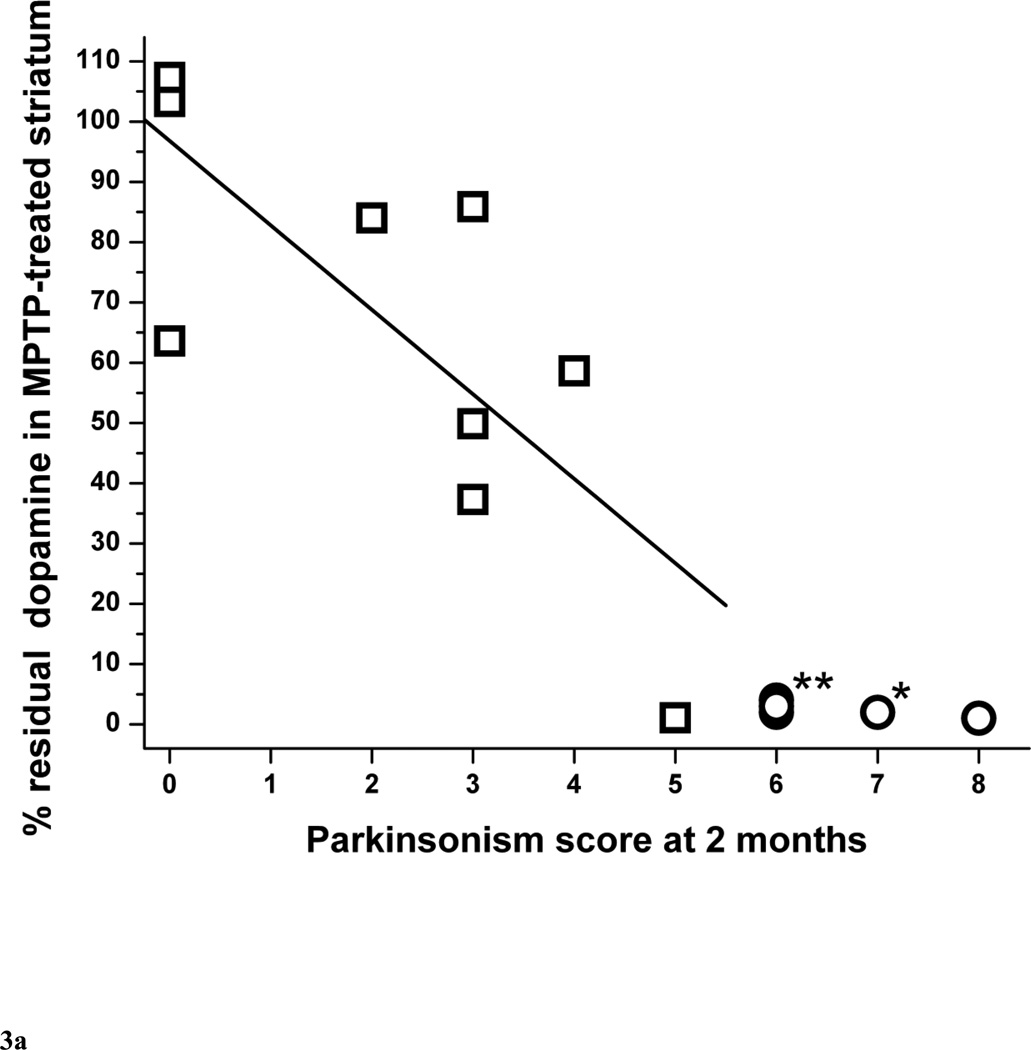
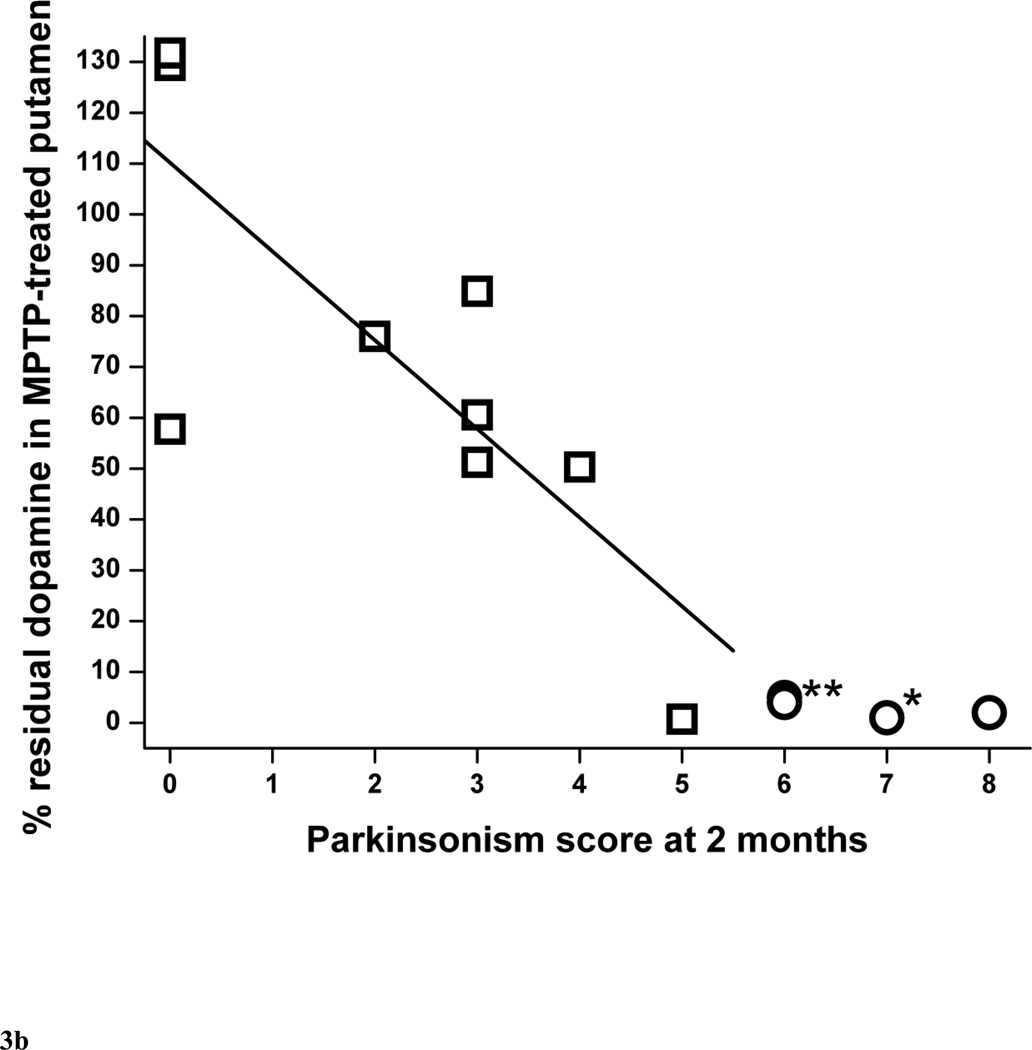
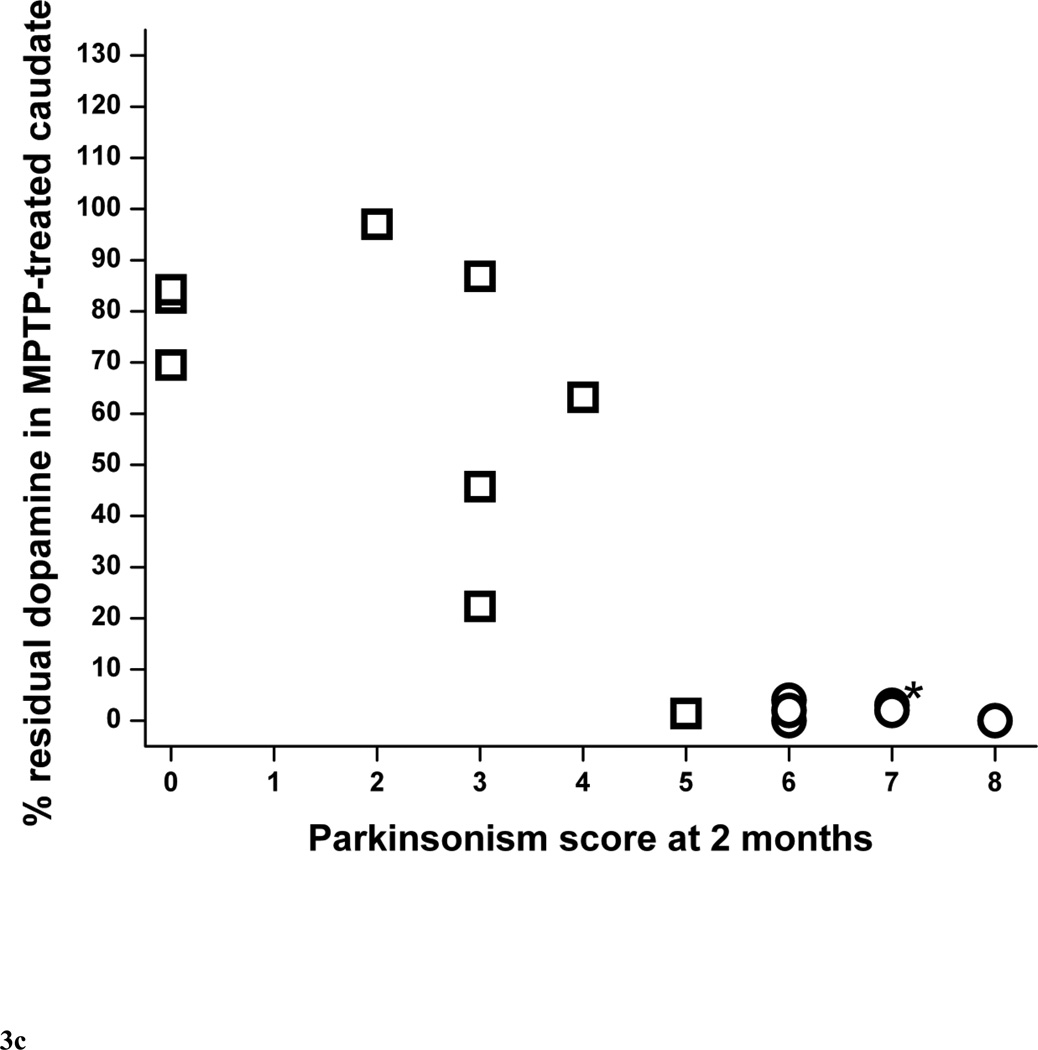
Figure 3.
Parkinsonism score at 2 months versus percent residual dopamine content in (A) the striatum, (B) putamen and (C) caudate (n=15). Data from monkeys with residual nigral cell counts of less than 50% are depicted by circles (n=6). Squares represent data from monkeys with residual nigral cell counts of 50% or more (n=9). In figure 3A, the linear equation y = A + B*x has A = 96.8±12.5, B = −14.0±4.4, r = −0.77, p = 0.016. In figure 3B, the linear equation has A = 110±14, B = −17.5±5.1, r = −0.79, p = 0.011). In figure 3C, the linear equation has A = 86.4±14.2, B = −11.2±5.0, r = −0.65, p = 0.060. * denotes 2 overlapping data points; ** denotes 3 overlapping data points.


