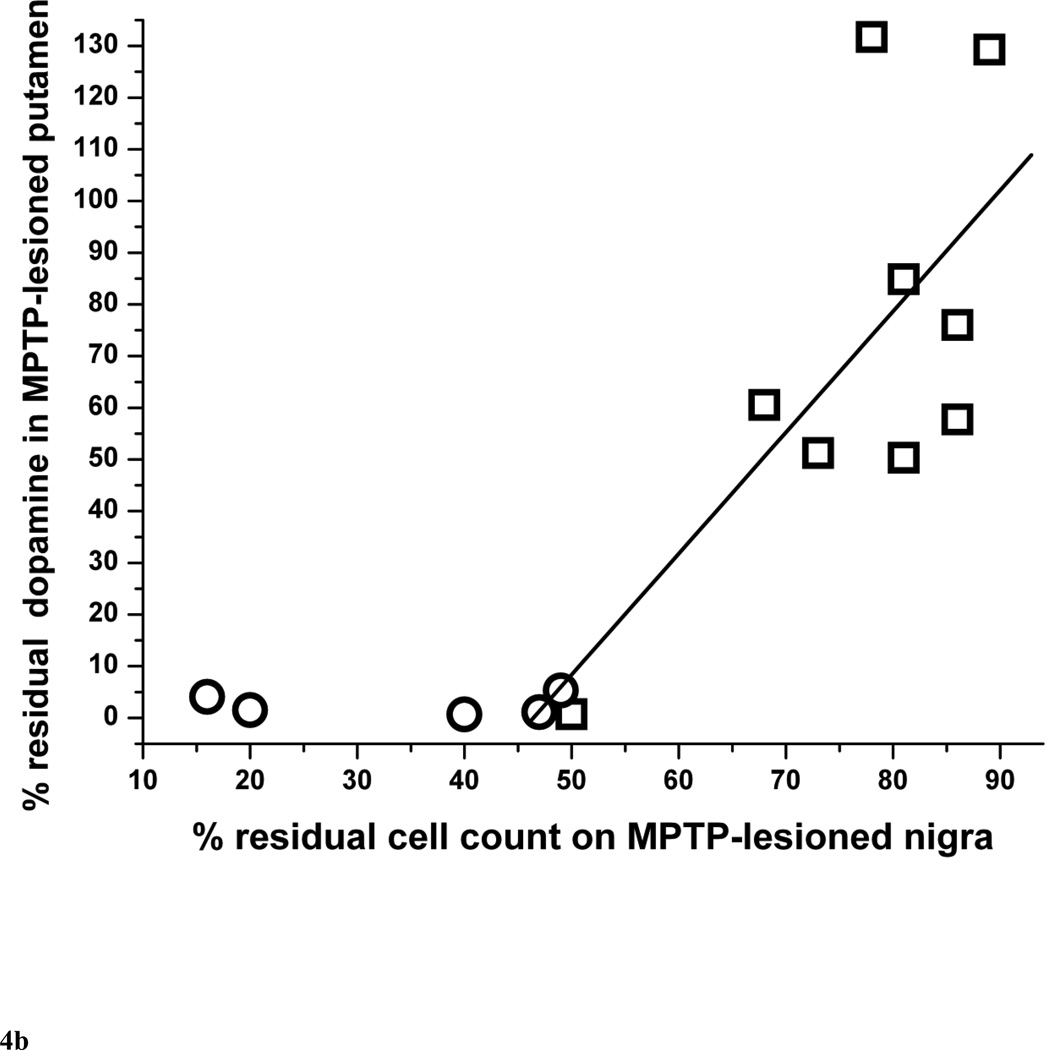
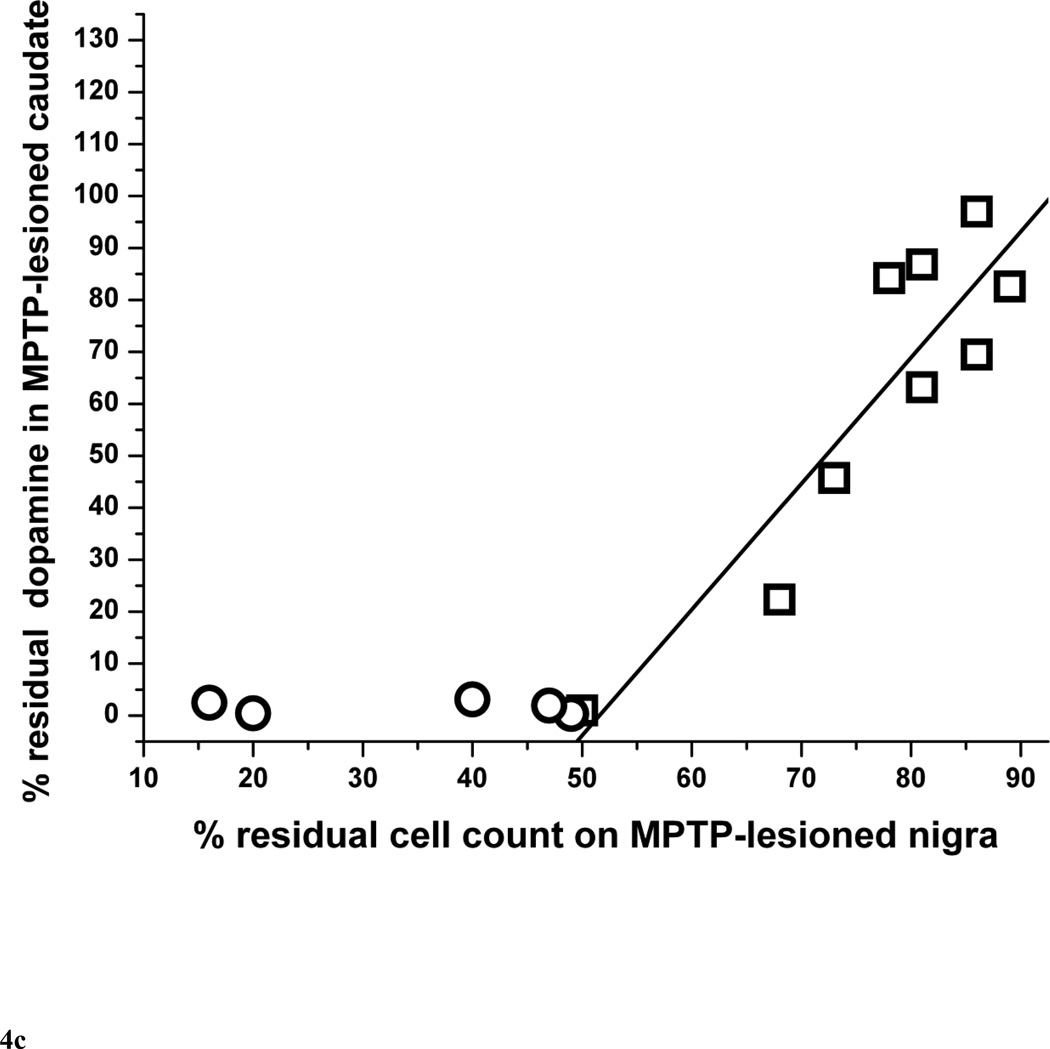
Figure 4.
Percent of residual dopaminergic cell counts in injected nigra versus percent residual dopamine in (A) the striatum, (B) putamen and (C) caudate (n=14). Data from monkeys with residual nigral cell counts of less than 50% are depicted in circles (n=6). Squares represent data from monkeys with residual nigral cell counts of 50% or more (n=9), In figure 4A, the linear equation y = A + B*x has A = −116±44, B = 2.37±0.57, r = 0.84, p = 0.0043. In figure 4B, the linear equation y = A + B*x has A = −109±72, B = 2.34±0.92, r = 0.69, p = 0.039. In figure 4C, the linear equation y = A + B*x has A = −125±34, B = 2.42±0.43, r = 0.90, p = 0.0008.


