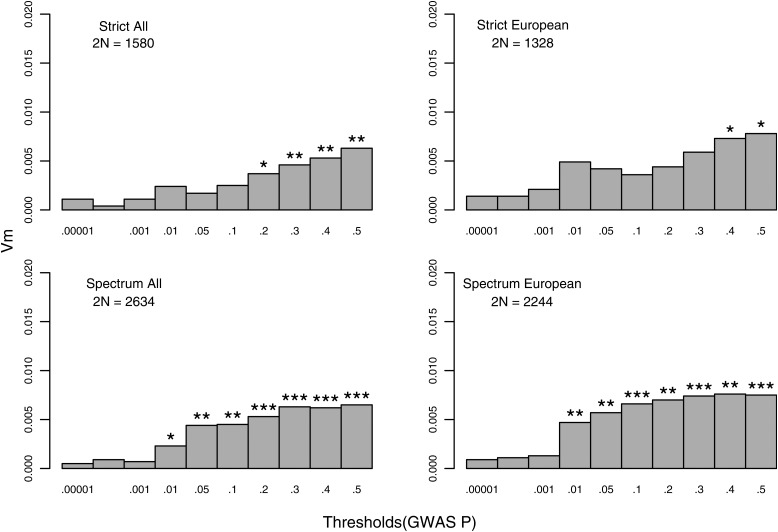
Figure 1.
Additive genetic variance at marker (VM) explained by the Stage 1-derived allele score in Stage 2 probands and pseudo controls for a given ancestry and diagnostic classification. Significant association of the allele score denoted by (*P< 0.05, **P< 0.01, ***P< 0.001). Note that the number of predictors, at a given threshold, is roughly the threshold times the number of SNPs meeting quality control criteria (947 233).

