

Abstract
Rapid progress in our understanding of macrostructural abnormalities in autism spectrum disorders (ASD) has occurred in recent years. However, the relationship between the integrity of neural tissue and neural function has not been previously investigated. Single-voxel proton magnetic resonance spectroscopy and functional magnetic resonance imaging of an executive functioning task was obtained in 13 high functioning adolescents and adults with ASD and 13 age-matched controls. The ASD group showed significant reductions in N-acetyl aspartate (NAA) in all brain regions combined and a specific reduction in left frontal cortex compared to controls. Regression analyses revealed a significant group interaction effect between frontal and cerebellar NAA. In addition, a significant positive semi-partial correlation between left frontal lobe NAA and frontal lobe functional activation was found in the ASD group. These findings suggest that widespread neuronal dysfunction is present in high functioning individuals with ASD. Hypothesized developmental links between frontal and cerebellar vermis neural abnormalities were supported, in that impaired neuronal functioning in the vermis was associated with impaired neuronal functioning in the frontal lobes in the ASD group. Furthermore, this study provided the first direct evidence of the relationship between abnormal functional activation in prefrontal cortex and neuronal dysfunction in ASD.
Keywords: autism, FMRI, magnetic resonance spectroscopy, verbal fluency, cerebellum, frontal lobe, NAA
1. Introduction
Autism spectrum disorders (ASD) are highly heritable (Bailey et al., 1995), prevalent (Chakrabarti and Fombonne, 2001), and pervasive developmental disorders clinically defined by impaired socioemotional functioning, atypical language development, and the presence of restricted, repetitive, and stereotyped patterns of behavior. Structural neuroimaging studies of individuals with Autistic Disorder, who among individuals with ASD have the highest level of autistic symptomatology and the lowest level of adaptive functioning (Walker et al., 2004), have reported widespread abnormalities including age-dependent increased brain volume (Aylward et al., 2002; Courchesne et al., 2001; Hazlett et al., 2005; Redcay and Courchesne, 2005; Sparks et al., 2002) reduced size of vermal lobules VI and VII (Ciesielski et al., 1997; Courchesne et al., 1994a; Courchesne et al., 1988; Hashimoto et al., 1995; Kaufmann et al., 2003), and reversed patterns of asymmetry (Herbert et al., 2005).
Consistent with the varied behavioral presentations which comprise autism spectrum disorders (Walker et al., 2004), the neural underpinnings of autism appear to be heterogeneous as well. A review of neuropathological findings reported that 72% of postmortem cases had reduced numbers or smaller Purkinje cells in the cerebellum based on visual inspection (Palmen et al., 2004), which suggests that cellular abnormalities in the cerebellum are highly prevalent in autism. In contrast, only approximately 40% of autopsied cases reported frontal lobe abnormalities (Palmen et al., 2004). However, quantitative stereological studies of frontal lobe and cerebellum were not conducted in the studies included in the review, so the exact percentages may differ from visual inspection. The abnormalities included increased cortical thickness, high neuronal density, neurons in the molecular layer, neuronal disorganization, poor differentiation of the grey-white boundary, neuronal heterotopias and focally increased numbers of single neurons in the white matter (Palmen et al., 2004). Notably, in the Bailey et al. (1998) study, the subset of cases with frontal lobe abnormalities also had Purkinje neuron abnormalities, which provided the first evidence that such abnormalities could occur in conjunction with each other. Carper and Courchesne (2000) extended this finding by evaluating whether developmental abnormalities in the cerebellum and frontal lobes were correlated using structural MRI. Consistent with their hypothesis, an inverse correlation between the cerebellar vermis area and frontal lobe volume was found. Thus, while neural abnormalities in frontal and cerebellar cortices differ markedly, there are indications from post-mortem and volumetric studies that they may be developmentally linked.
Proton magnetic resonance spectroscopy (1H MRS) studies, which provide in-vivo measure of neuronal health, are beginning to identify neurochemical abnormalities in ASD. Reduced levels of N-acetyl aspartate (NAA), a neuronal marker which can serve as an index of neuron density and viability (Danielsen and Ross, 1999), have been reported in the left frontal lobe white matter (Friedman et al., 2003; Levitt et al., 2003), bilateral cingulate (Friedman et al., 2003), left body of the caudate (Levitt et al., 2003), right thalamus (Friedman et al., 2003), right temporal lobe (Friedman et al., 2003; Hisaoka et al., 2001) left temporal lobe (Hisaoka et al., 2001), right parietal white matter (Friedman et al., 2003; Levitt et al., 2003), and the cerebellum (Chugani et al., 1999; Otsuka et al., 1999) in ASD. However, inconsistent results have been reported. For example, other studies did not find abnormally reduced levels of NAA in the frontal gray matter (Chugani et al., 1999; Levitt et al., 2003; Otsuka et al., 1999), temporal lobes (Levitt et al., 2003), bilateral thalamus (Levitt et al., 2003) and the amygdala-hippocampal and parietal regions (Page et al., 2006) in autism. These inconsistencies are difficult to interpret because studies differ widely in age range and level of functioning of their participants, and technical methodology.
Functional magnetic resonance imaging (FMRI) studies of ASD have led to theories which connect neural abnormalities to abnormal and/or reduced patterns of functional activation produced during cognitive tasks. For example, Belmonte et al. (2003) proposed that postmortem evidence of reduced size of cortical minicolumns and increased cell dispersion within minicolumns (Casanova et al., 2002) may be the cause of hyperarousal and reduced selectivity in ASD, resulting in increased activation in primary sensory areas and reduced activation in association areas. Similarly, abnormal patterns of activation related to attention and motor performance have been attributed to Purkinje neuron loss sequelae (Allen and Courchesne, 2003). However, a challenge for FMRI researchers is that post-mortem studies are few and have included a lower functioning subset of individuals with autism (e.g., high levels of comorbid mental retardation and seizures; see Palmen et al., 2004) than are typically included in FMRI studies. In addition, measures of neuronal integrity, which would contribute to FMRI researchers’ understanding of the neural underpinnings of neurofunctional abnormalities in ASD, have not been reported in combination with FMRI findings.
In the current 1H MRS study, four a-priori regions of interest (ROI) (frontal lobe, cerebellar hemisphere, cerebellar vermis, and parietal lobe) were selected based on structural and functional abnormalities previously reported in ASD (Allen et al., 2004; Carper and Courchesne, 2005; Ciesielski et al., 1997; Courchesne et al., 1993; Courchesne et al., 1994a; Courchesne et al., 1994b; Courchesne et al., 1988; Hashimoto et al., 1995; Kaufmann et al., 2003; Kleinhans et al., 2005b; Luna et al., 2002; Muller et al., 2003; Townsend et al., 1999). The occipital lobe was also included to serve as a control region, based on reports that the occipital lobes appear to be less affected in ASD (Buxhoeveden et al., 2006; Carper et al., 2002; Hadjikhani et al., 2004; Salmond et al., 2003). We hypothesized that individuals with ASD would have reduced NAA in the left frontal lobe, left parietal lobe, right cerebellar hemisphere, and the cerebellar vermis. No significant between group differences were expected in the occipital lobe. In addition, based on previous volumetric studies showing a relationship between the area of the cerebellar vermis and frontal lobe volume, we also predicted that there would be a significant positive correlation in NAA between these two regions in the ASD group.
The relationship between neural and functional abnormalities in ASD was also investigated. A secondary analysis of previously collected FMRI data was conducted to investigate the relationship between individual patterns activation and concentration of NAA in the left frontal lobe within the same participants. The correlational study was limited to the left frontal lobe, because significant groupwise activation was only observed in the left frontal lobe in the FMRI verbal fluency task. The blood oxygen level dependent (BOLD) signal is considered to be an indirect measure of neural activity (Logothetis, 2003); as such, we hypothesized that reduced NAA would be associated with a reduction of the BOLD signal (i.e., percent signal change) in the ASD group.
2. Results
MRS
Individual Regions
Repeated measures analysis of variance (ANOVA) were conducted with one between-subjects factor (group: ASD [n=13], control [n=13]), one within-subjects factor (region: left frontal, left parietal, occipital, right cerebellar hemisphere, and vermis), and age as a covariate. FSIQ was not included as a covariate because the groups differed significantly on this variable; as such including FSIQ as a covariate would be invalid (Miller and Chapman, 2001). The group by region interaction was not significant for concentration of NAA (p>.05). However, overall, the ASD group had significantly lower concentrations of NAA across the combined brain regions compared to the control subjects, after controlling for age [F(1,23)=9.88, p=.005]. Post-hoc analyses revealed significantly lower concentration of NAA in the left frontal lobe in the ASD group than the control group [F(1,23)=4.571, p =.0431]. No significant between-group differences were found in the other brain regions (p>.05). In addition, the main effect of brain region was not statistically significant (p>.05). Figure 3 displays corrected marginal means and standard error of the mean for group by region. Descriptive statistics for the other metabolites not considered in this study are reported in supplementary table 1.
Figure 3.
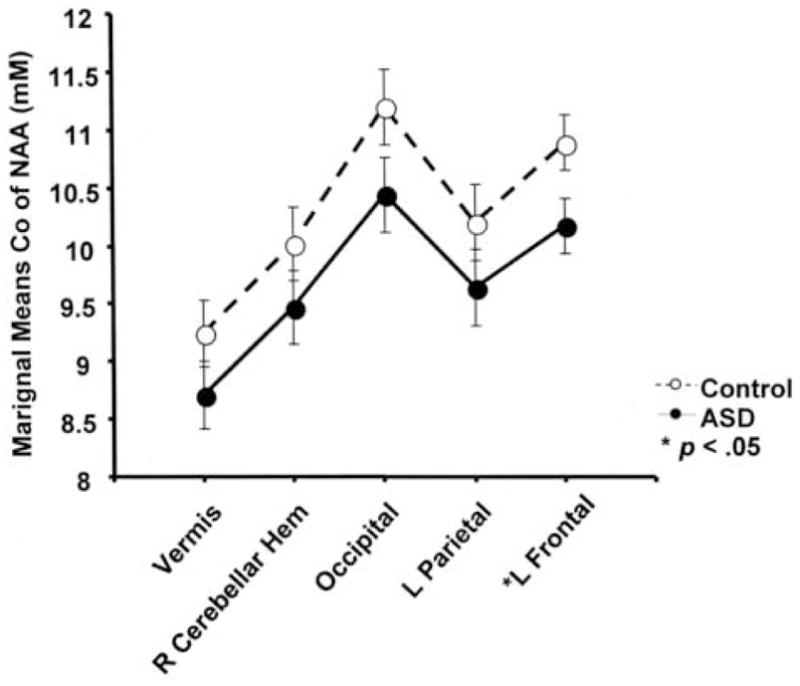
Between group differences in NAA. Concentration of NAA refers to the marginal mean for each group, evaluated at age 23.8 years. Error bars represent the pooled standard error. The ASD group had a significantly lower concentration of NAA (p = .0431) in the left frontal lobe. Between group differences were not significant in the other regions (p > .05). Overall concentration of NAA, averaged across brain regions was also significantly lower in the ASD group (p < .005).
FMRI
Motion
Head motion was investigated by comparing the groups on the motion parameters provided by the 3dvolreg output files. We statistically compared the average absolute value of degrees in the roll, pitch, and yaw direction and mm displacement in the x, y, and z direction using an independent-samples t-test. A conservative approach was utilized, in that all time points were included, even those that were censored in the FMRI analyses due to visually detected motion. No significant between group differences (ASD M (SD) = 0.253 (.207); Control M (SD) = .187 (.289), p = .289) were found for any of the parameters.
Behavior
Between-group comparisons of mean number of correct words generated per letter fluency block were conducted using independent samples t-tests. The ASD group produced significantly fewer correct words per letter fluency block than the control group [ASD M (SD) = 10.8 (3.3); control M (SD) = 14.788 (2.5); p < .005]. No significant between group differences were found in the number of errors [ASD M (SD) = 0.35 (0.39); control M (SD) = 0.56 (.65); p > .05]. Responses were coded as errors if they were a repetition of a previously stated word, a non-target item, or a neologism.
Function
Between group differences were tested using independent samples t-tests. The mean volume of activation in the left frontal lobe ROI did not significantly differ between groups [ASD M (SD) = 22,662.15 μL (24,311.21); control M (SD) = 22,141.54 μL (29,312.26); t(24) = −.049; p > .05]. The mean percent signal change also did not differ significantly between groups [ASD M (SD) = 0.5257 (0.0093); control M (SD) = 0.4632 (0.1285); t(21) = −.049; p > .05]. Note that only individuals with at least one significant cluster of activation were include in the between-group analysis of percent signal change (ASD n = 10, control n = 13). Of the three ASD individuals who were excluded, two were diagnosed with Asperger’s syndrome and one with autistic disorder; all three were right handed.
Behavior, Function, Neuronal Integrity Relationships
Cerebellar–Frontal Correlations
Multiple regression was utilized to examine the relationship between the concentration of NAA in the left frontal lobe and the concentration of NAA in the cerebellar vermis. The relationship between concentration of NAA in the frontal lobe and the vermis was significantly dependent on diagnosis (t=2.697, p =.013) (see Figure 4). Specifically, in the control group, the concentration of NAA in the vermis was inversely related to the concentration of NAA in the left frontal lobe region, while in the ASD group, the concentration of NAA in the vermis was directly related to the concentration of NAA in the left frontal lobe region. Simple effects analyses revealed that linear, nonsignificant trends were found in each group between left frontal and vermis NAA concentrations [controls: (t =−1.905, p=.083); ASD: (t =1.922, p=.081)].
Figure 4.

Interregional relationships by group. The relationship between the concentration of NAA in the left frontal lobe and the cerebellar vermis was significantly dependent on group (p = .013). Nonsignificant linear trends (p < .10) were found in each group. In contrast, no significant interaction, or interregional correlations were found between the vermis and the occipital cortex. This suggests that the relationship between the vermis and the frontal lobe does not reflect a nonspecific, generalized effect.
The next analysis tested the relationship between the concentration of NAA in the left frontal lobe and the concentration of NAA in the right cerebellar hemisphere. No significant interaction between diagnosis and concentration of NAA in the right cerebellar hemipshere in terms of the relationship to NAA concentration in frontal lobe was found (t=−.385, p>.05). In addition, no significant relationship between concentration of NAA in the right cerebellar hemisphere and left frontal lobe was found (t=−.316, p>.05).
In order to evaluate the specificity of the vermis – frontal lobe interaction effect, we examined the relationship between NAA concentrations in the occipital lobe (the control region) and the cerebellar vermis. No significant interaction between group membership and the relationship between vermal NAA and occipital lobe NAA was observed (p >.05) (see Figure 4).
Behavior-Neuronal Integrity Correlation
Semi-partial correlations were calculated to investigate the relationship between letter fluency performance and concentration of NAA in the frontal lobe and cerebellum, controlling for the effects of age and full-scale IQ (FSIQ). Analyses were limited to the cerebellum and frontal lobe, because only these two regions (of those assayed) purportedly mediate verbal fluency performance. Significant correlations were found between verbal fluency performance and right cerebellar NAA in the ASD group (r = .64, p = .032). No significant correlations between letter fluency and NAA were found in the other brain regions for either the ASD or the control group. See Table 3 for a complete list of results.
Table 3.
Semi-partial correlations between behavior and neuronal intergrity in ASD and Controls.
| NAA (R cerebellum) | NAA (Vermis) | NAA (L frontal) | |||||
|---|---|---|---|---|---|---|---|
| ASD | CONT | ASD | CONT | ASD | CONT | ||
| Letter Fluency (number correct) | r | .644 | .014 | −.330 | −.006 | −.281 | .309 |
| p value | .032* | .967 | .323 | .985 | .403 | .356 | |
Note. L = left; R = right; NAA = N-acetyl aspartate. Age and FSIQ were entered as covariates.
Correlation is significant at the .05 level (2-tailed).
Function-Behavior Relationship
Semi-partial correlations were calculated to investigate the relationship between letter fluency performance and FMRI activation in the left frontal lobe, controlling for the effects of age and FSIQ. No significant semi-partial correlations were found between letter fluency performance and cluster volume [ASD r = −.223, p = .510; control r = .238, p = .481] or mean percent signal change [ASD r = −.173, p = .682; control r = .3728, p = .259]. Note that the analysis involving mean percent signal change included only participants with significant frontal lobe activation (ASD, n= 10; Control, n = 13).
Function-Neuronal Integrity Relationship
Semi-partial correlations were calculated to investigate the relationship between FMRI activation in the left frontal lobe and NAA in the left frontal lobe, controlling for the effects of age and FSIQ. A significant positive correlation between percent signal change in the left frontal lobe and concentration of NAA in the left frontal lobe was found in the ASD group (n = 10, r=.810, p=.015), but not the controls (n = 13, r= −.133, p= .696) (see Figure 5). The relationship between cluster volume of the significantly activated region in the left frontal lobe and concentration of NAA in the left frontal lobe was not significant for either group [ASD r = .012, p = .972; Control r = −.007, p = .98). Note that the analysis involving mean percent signal change included only participants with significant frontal lobe activation (ASD, n= 10; Control, n = 13). In order to address the specificity of the function-neuronal integrity relationship identified in the ASD group, post-hoc analyses were conducted to determine whether percent signal change in the left frontal lobe was also correlated to NAA in the other ROIs, after controlling for age and FSIQ. NAA in the other brain regions was not correlated to left frontal lobe activation [ASD: left parietal r = .025, p = .952; right cerebellar hemisphere r = −.364, p = .362; vermis r = .567, p = .143; occipital r = .824, p = .846]. In addition, a multiple regression analysis testing whether the average concentration of NAA across all 5 voxels, age, FSIQ, and left frontal NAA would predict left frontal lobe activation in ASD found that only left frontal lobe NAA was a significant predictor (t = 3.51, p = .017).
Figure 5.

Data points represent raw data. A significant, semi-partial correlation was found in the ASD group between concentration of NAA in the left frontal lobe and the average percent signal change of voxels with significant activation during the letter fluency task, controlling for age and FSIQ. Only ASD participants with significant functional activation (n = 10) were included in this analysis. This relationship was not observed in the control group.
3. Discussion
We investigated neural integrity in cortical and cerebellar regions implicated in the neuropathology of autism using single-voxel proton magnetic resonance spectroscopy. High functioning adolescents and adults with autism spectrum disorders have significantly reduced levels of NAA, suggesting reduced numbers of neurons and/or impaired neuronal functioning. Significant group differences in individual regions were limited to the left middle frontal gyrus, although the ASD group average was lower than the control group in all the brain regions assayed (frontal, parietal, occipital, and cerebellar) and when all brain areas were averaged, suggesting the possibility of widespread abnormalities. This study extended prior work in this area by establishing that neural abnormalities, which have been identified using 1H-MRS predominantly in younger and likely lower functioning autistic individuals (Chugani et al., 1999; Friedman et al., 2003; Friedman et al., 2006; Hashimoto et al., 1997; Hashimoto et al., 1995; Hisaoka et al., 2001; Otsuka et al., 1999), may also be present in a higher functioning broadly inclusive ASD sample. None of the individuals in our sample had IQs in the mentally retarded range and the sample included individuals with diagnoses in the less severe end of the autism spectrum; approximately 43% of the sample was diagnosed as PDD-NOS or Asperger’s disorder.
Reduced levels of NAA in the left frontal lobe white matter have been reported by Friedman and colleagues (2003) whereas other groups reported no difference from typically developing controls (Hisaoka et al., 2001; Muller et al., 1999), or increased levels of NAA in a sample which predominantly consisted of individuals with Asperger’s disorder (Murphy et al., 2002). These inconsistent findings may be due in part to the heterogeneity of neural abnormalities reported in ASD. Despite the universal presence of clinical signs and symptoms in individuals with ASD, which are associated with frontal lobe dysfunction in adults (Damasio and Maurer, 1978), past neuropathological studies reported frontal lobe abnormalities in only approximately 40% of autopsied cases (Palmen et al., 2004). Differences in methodology also may be a factor in the inconsistent findings. Multi-voxel chemical shift imaging has only been used by one group; studies that utilized single-voxel MRS techniques (including the present study) could not assay the entire frontal lobe, which could potentially lead to type II error. A volumetric study of autism that included the entire frontal lobe reported regional differences in frontal lobe abnormalities at the sublobar level (Carper and Courchesne, 2005). This finding suggests that voxel placement may determine whether neural abnormalities will be observed in ASD. Other brain imaging studies which investigated the frontal lobes in their entirety have also consistently found abnormalities such as reversed asymmetries in language association areas (Herbert et al., 2005), decreased metabolism (Zilbovicius et al., 1995), abnormal patterns of activation (Just et al., 2004; Luna et al., 2002; Muller et al., 2003; Pierce et al., 2004; Silk et al., 2006), and white matter abnormalities (Barnea-Goraly et al., 2004; Carper et al., 2002; Herbert et al., 2004). As such, while ASD almost certainly involves frontal lobe abnormalities, the exact nature of the abnormalities requires further characterization. With this in mind, the results of reduced NAA in left middle frontal gyrus found in the current study may not reflect neural abnormalities in the entire frontal lobe. In addition, because NAA was reduced across all brain regions and significantly reduced compared to controls when all regions were combined, NAA reduction is unlikely to be specific to the frontal lobes in the ASD population. A limitation of the current study is that we did not measure the relative contribution of grey matter and white matter to the concentration of NAA. Thus, it is impossible to determine whether the abnormalities identified in this study are due to white matter abnormalities, grey matter abnormalities, or both. However, it is important to note that significant volumetric differences are no longer present in individuals with ASD in the age range included in this study (Aylward et al., 2002; Courchesne et al., 2001), minimizing the likelihood that group differences in grey and/or white matter volume confounded the results.
In addition to studying between-group differences in neuronal integrity in specific brain regions, we also investigated the interrelationship between levels of NAA in the frontal lobe and cerebellum. A significant group interaction effect between neuronal integrity in the cerebellar vermis and the left middle frontal lobe was found. In the ASD group, the level of NAA in the left frontal lobe was directly related to the level of NAA in the cerebellar vermis. In the control group, an inverse relationship was observed. No relationship between NAA in vermis and the occipital lobe (the control region) was found in either group. Carper and Courchesne (2000) previously reported an inverse relationship between cerebellar and frontal lobe volume in very young children with autism. They suggested that the correlation between the two structures may reflect a developmental link between the two abnormalities, despite reported differences in the type of neural abnormalities in frontal and cerebellar cortex reported in post-mortem studies (e.g., Bailey et al., 1998). Specifically, abnormal cerebellar activity induced by Purkinje neuron reduction may cause the maldevelopment of frontal cortex via known cerebello-thalamo-cortical projections (Middleton and Strick, 1994). Given current evidence of early brain growth dysregulation and ongoing neuroinflammatory processes in autism (see below), it is possible that the relationship between neural abnormalities in the cerebellum and the frontal lobes changes with age as both structures continue to suffer the effects of neuroinflammation and concomitant cell damage. However, it is not known whether MRS studies of autism support this theory, as neither cross-sectional nor longitudinal studies of age-related changes in NAA in ASD have been reported. Thus, the current results might only be generalizable to other adolescents and adults with ASD.
Recent postmortem studies have identified neuroinflammation as a compelling potential pathological mechanism for reduced levels of NAA in individuals with ASD (Laurence and Fatemi, 2005; Vargas et al., 2005). Vargas and colleagues documented microglial activation in postmortem middle frontal gyrus, anterior cingulate, and cerebellar tissue, and in cerebral spinal fluid (CSF) of children and adults with autism. Laurence and Fatemi found increased glial fibrillary acidic protein in area 9, area 40 and the cerebellum in autism. Ongoing neuroinflammatory processes may produce alterations in brain tissue that would result in reduced NAA (secondary to cell loss or damage), as was observed in the current study.
The relationship between performance on the letter fluency task, brain function, and neural integrity was also investigated. Letter fluency is an executive function task mediated by cortical and subcortical brain structures in healthy individuals. Functional imaging studies of verbal fluency have reported left inferior frontal and dorsolateral prefrontal activation (Abrahams et al., 2003; Fu et al., 2002; Gaillard et al., 2000; Gourovitch et al., 2000; Paulesu et al., 1997; Phelps et al., 1997) and right cerebellar activation (Fu et al., 2002; Hubrich-Ungureanu et al., 2002; Weiss et al., 2003). In addition, lesion studies support the role of the frontal lobes (e.g., Baldo et al., 2001) and cerbellum in executive function tasks (Akshoomoff et al., 1992; Levisohn et al., 2000; Paradiso et al., 1997; Riva and Giorgi, 2000; Schmahmann and Sherman, 1997). Although cerebellar activation did not meet criteria for statistical significance in our sample, and therefore was not correlated to verbal fluency performance, MRS was collected from the region of the cerebellum previously reported to be involved in the verbal fluency task in healthy volunteers (see above) and in our pilot study (Kleinhans et al., 2005b). A significant semi-partial correlation was found between NAA in the right cerebellar hemisphere and verbal fluency performance in the ASD group (controlling for age and FSIQ), which suggests that cerebellar dysfunction may contribute to impaired verbal fluency performance previously reported in this population (Kleinhans et al., 2005a; Rumsey and Hamburger, 1988; Rumsey and Hamburger, 1990; Turner, 1999) but see (Minshew et al., 1997). No significant correlation was found between letter fluency performance and left frontal activation or left frontal lobe or NAA in either group. One possibility for the lack of correlation between left frontal NAA and letter fluency performance was the location of the MRS voxel. Voxel placement was centered in the left middle frontal gyrus in order to facilitate the correlation to FMRI activation. However, it is possible that other regions of the frontal lobe, such as the left inferior frontal gyrus, may be more sensitive to letter fluency performance. Because of the limited coverage of the left frontal lobe in this study, we cannot rule out the possibility that neural abnormalities in other areas of the frontal lobe may be correlated to executive dysfunction in ASD. However, the lack of correlation between verbal fluency performance and FMRI activation is consistent with prior findings (e.g., Abrahams et al., 2003).
Lastly, we found that level of frontal lobe NAA was directly related to degree of functional activation in the frontal lobes in ASD in an FMRI study of executive functioning. This relationship persisted after controlling for age and FSIQ. While previous studies have reported reduced levels of activation in the frontal lobes in autism during executive functioning tasks, this study is the first to directly correlate functional activation (i.e., percent signal change) to neuronal function. Several groups have hypothesized that frontal lobe dysfunction is related to abnormal connectivity (e.g., Courchesne and Pierce, 2005; Horwitz et al., 1988; Just et al., 2004). However, the growing body of work using MRS to investigate chemical alterations in ASD, and this study in particular, points to primary neuronal dysfunction, in addition to “underconnectivity.” It is important to note that no relationship between volume of activation and NAA was observed, which suggests that volume of activation is not as sensitive a marker of brain abnormalities as percent signal change. The lack of relationship between volume of activation and NAA maybe due to the fact that even in healthy adults, response extent varies widely (Xiong et al., 2000). In contrast, variability in signal intensity is very small (Xiong et al., 2000), and such, perturbations due to neural abnormalities would be easier to detect. A limitation to note is that this analysis targeted few brain regions; therefore, the influence of other brain regions which were not studied cannot be ruled out. Future studies could employ mutlivoxel spectroscopic acquisitions to enhance co-localization of functional and neurochemical imaging signals. However, it should be noted that the relationship between brain function and neuronal integrity displayed in Figure 5 has a high degree of specificity; correlations were not observed between NAA in the parietal, occipital, and cerebellar areas and functional activity localized to the left frontal lobe.
We found that high functioning individuals with ASD have reduced levels of NAA compared to age-matched controls. The most consistent area of abnormality was observed in the left middle frontal gyrus. In addition, the relationship between level of NAA in the frontal lobes and NAA in the cerebellar vermis differed between groups. These findings of biochemical alterations in ASD may reflect early brain growth dysregulation and ongoing neuroinflammatory processes. Reduced levels of NAA in ASD were also directly related to neurofunctional abnormalities observed in the FMRI study of executive functioning. This study is the first to directly link functional activation to neuronal integrity in ASD, and provides direct evidence that primary neuronal dysfunction, in addition to hypothesized aberrant neural connectivity leads to neurofunctional impairment in high functioning individuals with autism spectrum disorders.
4. Experimental Procedure
Participants
Thirteen males with an autism spectrum disorder (ASD) and 13 age-matched male controls were included. All study participants had previously participated in a functional magnetic resonance imaging (FMRI) study of letter fluency (Kleinhans et al., submitted). In the original FMRI study, 18 controls and 16 ASD subjects underwent the FMRI protocol. All were scanned only once. Two controls were excluded due to uncorrectable motion artifacts, one control was excluded because his performance could not be verified due to a technical failure, and one control was excluded from the study because he was in a motor vehicle accident and sustained a mild concussion before his MRS scan. Two ASD subjects were excluded from this study because of uncorrectable motion artifacts and one was excluded because he refused the MRS scan. All participants had valid MRS data for all brain regions, although one control and two ASD participants received the MRS protocol twice, in order to obtain valid data from all brain regions. The mean number of days between the FMRI and MRS scans was 103. There were no significant between group differences in time between the two scans (ASD mean = 112 days, range = 63–191; control mean = 94 days, range 21–210; t = −.819, p = .421). The technical criteria used to evaluate data quality for inclusion/exclusion status is detailed in the methods section below.
All participants in the ASD group were administered the Autism Diagnostic Observation Schedule (ADOS, Lord et al., 2000). The Autism Diagnostic Interview-Revised (ADI-R, Lord et al., 1994) was conducted with a primary caregiver. All participants met criteria for an ASD on the ADOS and ADI-R. Final diagnosis was based on DSM-IV criteria, as determined by a licensed psychologist employed by the Center for Autism Research. Seven participants in the ASD group met criteria for Autistic Disorder, three met criteria for Asperger’s Disorder, and three met criteria for Pervasive Developmental Disorder, Not Otherwise Specified (PDD-NOS). The mean age of the ASD group was 24.5 years (range=14–44 years). Twelve individuals were Caucasian and one was Hispanic. All had FSIQs above 70. Nine were right handed, two were ambidextrous, and two were left-handed. Handedness was ascertained by self-report. Two individuals were taking psychotropic medications at the time of the scan (i.e., paroxetine HCl, methylphenidate). One individual reported a history of a seizure in early childhood.
Control participants were recruited from the sample of individuals who had participated in a previous FMRI study of letter fluency (Kleinhans et al., 2005, February). All were screened for a history of developmental, psychiatric, or neurologic disorders. Control participants were matched to the ASD participants on a one-to-one basis according to age. Two individuals with technically acceptable MRS data were excluded from this study following the matching procedure because other participants yielded a better age match. Significant between group age differences were not found (p=.440). The mean age of the included control participants was 22.48 years of age (range=16–43). Eleven individuals were Caucasian, one was Asian, and one was African-American. Twelve were right handed and one was left-handed. Handedness was determined by self-report. Please see Table 1 for summarized demographic information on the included participants in the ASD and control groups.
Table 1.
Demographic information
| Autism Spectrum Disorder Groupa | Control Groupa | |||||
|---|---|---|---|---|---|---|
| M | SD | Range | M | SD | Range | |
| Age (years) | 24.5 | (9.5) | 15–44 | 22.5 | (7.4) | 16–43 |
| Wechsler Abbreviated Scales of Intelligence | ||||||
| Verbal IQ | 92.8 | (15.5) | 68–115 | 112.8 | (14.8) | 87–136 |
| Performance IQ | 107.4 | (13.9) | 79–127 | 114.5 | (12.8) | 89–129 |
| Full Scale IQ | 99.2 | (11.7) | 83–117 | 115.0 | (13.6) | 88–130 |
| ADI-Rb | ||||||
| Social (cutoff = 10; max = 30) | 24.3 | (5.1) | 18–30 | N | N | N |
| Verbal (cutoff = 8; max = 26) | 18.2 | (2.7) | 12–22 | N | N | N |
| Restricted Interests & Repetitive(cutoff = 3, max = 12) | 7.8 | (2.9) | 3–12 | N | N | N |
n=13
d gnostic Interview-Revise Autism Dia
Note. N = not applicable.
This study was approved by the University of California, San Diego, San Diego State University, and Children’s Hospital of San Diego Institutional Review Boards. Informed written consent was obtained from the participants and if applicable, their parents. All participants were paid $20 per hour of participation.
MRS Data Acquisition
The MRS scanning was conducted on a General Electric Excite-2 1.5 Tesla scanner. An eight-channel, phased array coil was used for MRS acquisitions. Five regions of interest were assayed using short echo-time PRESS single voxel spectroscopy (TE=35 ms, TR=3000 ms, 96 acquisitions): left middle frontal (voxel dimension=14×14×14 mm, Talairach coordinates = −43, −13, 29), left superior parietal (voxel dimensions=14×14×14 mm, Talairach coordinates= −25, −65, 41), occipital cortex at the calcarine fissure (voxel dimensions = 14×14×14 mm), right anterior superior cerebellar hemisphere (voxel dimensions = 14×14×14 mm; Talairach coordinates = 32, −58, −34), and midline cerebellar vermis centered in lobules VI and VII (voxel dimensions=14×14×12 mm). Figure 1 depicts voxel localizations overlaid on a control participant’s structural image. Eight averages for the unsuppressed water peak were collected at TE=35 ms, TR=3000 ms.
Figure 1.

Voxel locations in the left frontal lobe, left parietal lobe, right cerebellar hemisphere, bilateral cerebellar vermis, and bilateral occipital cortex in the Talairach coordinate system.
Specific voxel placement in the left frontal lobe, left parietal lobe, and right cerebellar vermis was based on results from a pilot FMRI study of verbal fluency tasks in healthy control participants (Kleinhans et al., 2005b). Where noted, Talairach coordinates correspond to the center of intensity of significant clusters of activation. Voxel placement for the midline cerebellar vermis was centered in lobules VI and VII. Voxel placement in the occipital lobes was localized by using the interhemispheric fissure to center the ROI in the right to left direction and the calcarine fissure to center the ROI in the superior to inferior and anterior to posterior direction, although voxel placement was shifted in the superior direction if necessary to avoid including the cerebellum. In order to ensure reliable and accurate voxel placement, prior to scanning, the brain tissue to be included in the MRS voxel was identified in each individual on a previously acquired high resolution anatomical brain image. Pictures of the ROIs in the sagittal, axial, and coronal planes were brought to the scanning session and used to assist in voxel placement.
The quality of data acquisition was evaluated on an individual basis and compared across groups. Metabolite uncertainties were expressed as %SD; this value is concentration-dependent and represented estimated standard deviations as a percent of the concentrations. Percent SD, FWHM (full width at half maximum, an estimate of peak width), and S/N (signal to noise ratio) were used as determinants of spectrum quality. A %SD of less than 20 and a FWHM less than 0.1 ppm were required for inclusion (Provencher, 2001). All participants had valid data for all brain regions. Table 2 displays average NAA %SD, FWHM, and S/N, for both ASD and controls. Measures of NAA reliability were considered within normal limits for each group. However, in the occipital lobe region, the ASD had significantly poorer S/N and higher %SD than the control group. No further between-group differences in spectrum quality were observed.
Table 2.
Average %SD for N-acetylaspartate (NAA), FWHM (Full Width Half Maximum), and S/N (signal to noise ratio) for ASD and Controls (CONT)
| Group | Occipital | R Cerebellar Hem. | L Parietal | Vermis | L Frontal a | ||||||||||
|---|---|---|---|---|---|---|---|---|---|---|---|---|---|---|---|
| %SD | FWHM | S/N | %SD | FWHM | S/N | %SD | FWHM | S/N | %SD | FWHM | S/N | %SD | FWHM | S/N | |
| ASD (SD) | 7.54a (1.13) | 0.06 (0.01) | 7.15a (0.90) | 8.00 (1.91) | 0.06 (0.01) | 6.15 (1.21) | 7.15 (1.46) | 0.05 (0.01) | 7.08 (1.26) | 9.15 (1.21) | 0.04 (0.01) | 5.85 (0.80) | 7.77 (0.83) | 0.05 (0.01) | 6.54 (0.66) |
| CONT (SD) | 6.15a (0.99) | 0.05a (0.01) | 8.612a (1.39) | 7.38 (1.39) | 0.06 (0.01) | 6.46 (0.88) | 6.85 (1.63) | 0.05 (0.01) | 7.92 (0.95) | 8.31 (0.95) | 0.04 (0.01) | 6.31 (0.63) | 7.08 (1.04) | 0.04 (0.01) | 7.23 (1.09) |
Note. Means matching subscripts indicate significant between group difference at with p < .05. Hem. = hemisphere, R = right, L = left.
FMRI Data Acquisition
MR Imaging was performed with a 1.5 T Siemens Symphony MR scanner (Erlangen, Germany) equipped with the standard clinical head coil. Functional whole-brain T2*-weighted images were acquired using a single-shot gradient-recalled echo-planer imaging sequence (TR=2600 ms; TE=36 ms; flip angle=90°; FOV=256 mm) with a matrix size of 64 × 64 (in-plane resolution=4×4 mm). Twenty-eight contiguous 5 mm slices in the axial plane were acquired during each image using interleaved slice acquisition. One hundred and thirty-four images were collected. The first two volumes were discarded to control for signal inhomogeneities. A high-resolution 3D MP-RAGE (magnetization prepared-rapid gradient echo; TR=11.08 ms; TE=4.3 ms; flip angle =45°; FOV=256 mm; matrix 256×256; 180 slices; resolution = 1 mm3) structural scan was acquired during the scanning session for anatomical localization.
Participants performed a letter fluency task during echo planar imaging. Instructions were repeated at the start of the task. Participants were asked to generate as many words as they could that began with the letter projected on the screen (B,H,R,F). The comparison condition was self-paced repetition of the word “nothing.” In addition, four rest periods were interspersed between the Nothing and Fluency conditions. The run consisted of four, 45-second Fluency blocks (F), four, 26-second Nothing blocks (N), and four, 10-second Rest blocks (R). The experimental design for the run was: FNRFNRFNRFNR. A delay of 5.2 seconds was inserted before the start of the experiment, which corresponded to the two volumes that were discarded. Responses were recorded, transcribed, and scored for accuracy to evaluate task performance.
MRS Data Analysis
Spectral analysis was completed using LCModel version 6.1 (Provencher, 2001). Full spectral information was utilized (Provencher, 2001). Free-induction decays (FIDs) were input into the software package and were zero-filled to double the points and filtered with a finite discrete convolution to account for field inhomogeneities and eddy currents. FID’s were zero- and first-order phase corrected. Data from each channel of the phased array coil were combined with a weighted average based on the signal to noise of each spectrum. Spectra were combined by LCModel by separate phasing and a weighted coherent average. Signal to noise is calculated on each spectrum after weighted averaging from the 8 channels by calculating the ratio of the maximum in the spectrum (NAA in all cases) minus baseline over to two times the root mean square of the residuals. Tissue water measurements (e.g., biexponential fit of water at multiple T2s revealing fraction from tissue water and cerebrospinal fluid) were not calculated for the present study. Thus, they were not included in the correction factor.
A spline baseline was determined by a near model-free constrained regularization method and represented with equally spaced knots. Frequency range for analysis was 4.1 to 1.0 ppm, which includes resonances from lactate, N-acetylaspartate, glutamate+glutamine, creatine+phosphocreatine, choline containing compounds, and myo-Inositol. A non-linear, least squares analysis estimated the metabolite concentrations and their uncertainties.
Absolute concentrations were obtained by scaling the in vivo spectrum to the unsuppressed water peak and are reported in units that approximate millimolar concentrations. Partial volume corrections were made by calculating the fraction of cerebral spinal fluid (CSF) for each ROI. CSF volume measurements were obtained through a hand-tracing method. The brain tissue corresponding to each MRS voxel was isolated by extracting the section of the SPGR anatomical image that corresponded to the inferior-superior, left-right, and anterior-posterior extents of each voxel. All files were coded by an assistant who was not involved in the study. Duplicate files were assigned different codes. Therefore, the anatomist was blind to participant, diagnosis, and whether the file had been traced previously. CSF was traced on each slice of all ROIs a minimum of two times. The fraction of CSF was determined by counting the number of voxels classified as CSF and dividing by the total number of voxels in the ROI. Intrarater tracing reliability was first assessed by plotting percent difference between the estimates of each tracing pair. Any point that appeared to be an outlier (based on visual inspection) was retraced a third time. If the estimate based on the third tracing closely matched one of the prior estimates, only those two estimates were averaged, according to the assumption that the outlier value represented an error. If the third tracing represented an intermediate value between the first two, all three values were averaged. The average intrarater difference between CFS measurements for identical voxels, for all regions, was 0.985 % (range = 0.012% to 3.65 %). When the voxel was traced three times, the intrarater difference value reflects the difference between the two extreme values (ignoring the middle estimate). The following equation was used to normalize metabolite value to 100% brain tissue: C=Co*(1/(1−FCSF)) where C=concentration, Co=metabolite concentration from LCModel output, and FCSF=estimated fraction CSF.
FMRI Data Analysis
Motion was systematically evaluated in all participants. First, a print out of outlier values in the raw data was obtained from AFNI (http:afni.nimh.nih.gov/afni, Cox, 1996). Timepoints with large spikes in the number of outliers may indicate the presence of head movement, but visual inspection is necessary for confirmation. Next, a research technician scrolled through the time series, and noted timepoint by timepoint, which ones has visibly detectable motion and the type of motion (e.g., nod). Image registration and functional analyses were then conducted using AFNI (http:afni.nimh.nih.gov/afni, Cox, 1996). Motion correction and registration were done using an automated alignment program (3dvolreg), which co-registers each volume in the timeseries to a fiducial volume using an iterative process (Cox and Jesmanowicz, 1999). The fiducial volume was individually selected for each participant and corresponded to the volume closest to the midpoint without visibly detectable motion. Then, those time points with noticeable motion in the raw data were inspected again, to determine whether the registration program had been able to correct the motion such that it was no longer visibly detectable. If motion was still visibly detectable following the registration procedure, then the scan was excluded. If the motion was no longer detectable, then the scan was included, but the timepoints with detectable motion prior to registration were censored from the statistical analysis. The functional image time series was smoothed with a Gaussian filter (full-width, half-maximum = 8 mm) resampled into Talairach coordinates (Talairach and Tournoux, 1988) according to the AFNI hand-landmarking procedure (resampled volumes = 4 mm3).
Previously collected FMRI data were included in this study. Results from our previous study showed that individuals with ASD and controls recruited the left prefrontal cortex during the letter fluency task (Kleinhans et al., submitted). Significant activation was not found in the other brain regions assayed by MRS in either group in this study. Right cerebellar activation in response to verbal fluency tasks has been reported by others (Fu et al., 2002; Hubrich-Ungureanu et al., 2002; Weiss et al., 2003). However, since significant cerebellar activation was not found in either group in our study, analyses of neural function and integrity were limited to left frontal lobe. The average percent signal change in the left frontal lobe was determined using a region of interest (ROI) approach. The left frontal lobe ROI included the superior, middle, and inferior frontal gyri and the insula and was created with the Talairach Daemon program in AFNI. A liberal search area was utilized because the ASD participants’ frontal lobe activations were anticipated to be more heterogeneous than in typically developing individuals (Muller et al., 2003). The group mask was transformed into native space for each participant. Statistical analysis of the individual functional imaging data was conducted through calculation of the cross-correlation of the reference waveforms and the measured timeseries data on a voxel-by-voxel basis. Box car timeseries models were created that modeled the verbal fluency condition and the “nothing” control condition. The modeled timeseries was shifted 1 TR prior and 3 TRs after the stimulus onset to account for the delay in hemodynamic response. Timepoints with apparent motion (see methods above) were censored on an individual basis and excluded from all statistical analyses. Percent MR signal change comparing the verbal fluency condition to the control condition was calculated for each condition and correlated with the modeled timeseries using the program 3dfim+. The linear trend and global mean were removed from the FMRI timeseries. Motion parameters corresponding to mm of adjustment in the x, y, and z axes and degrees of adjustment in the roll, pitch, and yaw direction per timepoint were modeled in the correlational analyses as orthogonal covariates.
Statistical significance for the left frontal lobe ROI was determined on an individual level at p<.05, one-tailed, cluster threshold corrected via Monte Carlo simulation. A one-tailed distribution was utilized because the investigation was limited to identifying percent signal change in the positive direction. Multiple significant clusters within the ROI were summed. The average percent signal change of the voxels in the significant cluster(s) in the left frontal lobe ROI was computed for each individual. These values were used in all statistical analyses. All included participants (see Results) evidenced significant activation that overlapped with the MRS voxel location, although to varying degrees. Representative spectra, voxel localization, and functional activation for one ASD and one control participant are depicted in Figure 2.
Figure 2.

Representative MRS spectrum and functional activation map from one ASD and one control participant. Each selected participant’s NAA concentration (metabolic chemical shift = 2.02 ppm) was closest to his respective group’s mean value. The red line in the MRS spectrum represents the LC-model fit for the underlying raw data, the black line is the least squares fit baseline, and the dotted line is the 0 line. Each structural anatomical image was warped into Talairach space. MRS voxel placement (dimension=14×14×14 mm, Talairach coordinates = −43, 13, 29) is designated with a black square. FMRI activation depicts significant clusters of activation in the left frontal lobe region of interest at p < .05, one-tailed, corrected. The color scale represents percent signal change during the letter fluency task compared to the control task. Note that data from the entire cluster of FMRI activation was included in the correlational analyses, not only the activation that overlapped with the MRS voxel.
Supplementary Material
Acknowledgments
The authors were supported by funds from the National Institute of Mental Health (2-ROI-MH36840) awarded to Eric Courchesne. We would like to acknowledge Graham Wideman for technical assistance with data processing. A portion of this work was presented at the International Meeting for Autism Research, St. Louis, MO, 2005.
Footnotes
Publisher's Disclaimer: This is a PDF file of an unedited manuscript that has been accepted for publication. As a service to our customers we are providing this early version of the manuscript. The manuscript will undergo copyediting, typesetting, and review of the resulting proof before it is published in its final citable form. Please note that during the production process errors may be discovered which could affect the content, and all legal disclaimers that apply to the journal pertain.
References
- Abrahams S, et al. Functional magnetic resonance imaging of verbal fluency and confrontation naming using compressed image acquisition to permit overt responses. Hum Brain Mapp. 2003;20:29–40. doi: 10.1002/hbm.10126. [DOI] [PMC free article] [PubMed] [Google Scholar]
- Akshoomoff NA, et al. Contribution of the cerebellum to neuropsychological functioning: evidence from a case of cerebellar degenerative disorder. Neuropsychologia. 1992;30:315–28. doi: 10.1016/0028-3932(92)90105-u. [DOI] [PubMed] [Google Scholar]
- Allen G, Courchesne E. Differential effects of developmental cerebellar abnormality on cognitive and motor functions in the cerebellum: an fMRI study of autism. Am J Psychiatry. 2003;160:262–73. doi: 10.1176/appi.ajp.160.2.262. [DOI] [PubMed] [Google Scholar]
- Allen G, et al. Cerebellar function in autism: functional magnetic resonance image activation during a simple motor task. Biol Psychiatry. 2004;56:269–78. doi: 10.1016/j.biopsych.2004.06.005. [DOI] [PubMed] [Google Scholar]
- Aylward EH, et al. Effects of age on brain volume and head circumference in autism. Neurology. 2002;59:175–83. doi: 10.1212/wnl.59.2.175. [DOI] [PubMed] [Google Scholar]
- Bailey A, et al. Autism as a strongly genetic disorder: evidence from a British twin study. Psychol Med. 1995;25:63–77. doi: 10.1017/s0033291700028099. [DOI] [PubMed] [Google Scholar]
- Bailey A, et al. A clinicopathological study of autism. Brain. 1998;121(Pt 5):889–905. doi: 10.1093/brain/121.5.889. [DOI] [PubMed] [Google Scholar]
- Baldo JV, et al. Verbal and design fluency in patients with frontal lobe lesions. J Int Neuropsychol Soc. 2001;7:586–96. doi: 10.1017/s1355617701755063. [DOI] [PubMed] [Google Scholar]
- Barnea-Goraly N, et al. White matter structure in autism: preliminary evidence from diffusion tensor imaging. Biol Psychiatry. 2004;55:323–6. doi: 10.1016/j.biopsych.2003.10.022. [DOI] [PubMed] [Google Scholar]
- Belmonte MK, Yurgelun-Todd DA. Functional anatomy of impaired selective attention and compensatory processing in autism. Brain Res Cogn Brain Res. 2003;17:651–64. doi: 10.1016/s0926-6410(03)00189-7. [DOI] [PubMed] [Google Scholar]
- Buxhoeveden DP, et al. Reduced minicolumns in the frontal cortex of patients with autism. 2006;32:483–491. doi: 10.1111/j.1365-2990.2006.00745.x. [DOI] [PubMed] [Google Scholar]
- Carper RA, Courchesne E. Inverse correlation between frontal lobe and cerebellum sizes in children with autism. Brain. 2000;123(Pt 4):836–44. doi: 10.1093/brain/123.4.836. [DOI] [PubMed] [Google Scholar]
- Carper RA, Courchesne E. Localized enlargement of the frontal cortex in early autism. Biol Psychiatry. 2005;57:126–33. doi: 10.1016/j.biopsych.2004.11.005. [DOI] [PubMed] [Google Scholar]
- Carper RA, et al. Cerebral lobes in autism: early hyperplasia and abnormal age effects. Neuroimage. 2002;16:1038–51. doi: 10.1006/nimg.2002.1099. [DOI] [PubMed] [Google Scholar]
- Casanova MF, et al. Minicolumnar pathology in autism. Neurology. 2002;58:428–32. doi: 10.1212/wnl.58.3.428. [DOI] [PubMed] [Google Scholar]
- Chakrabarti S, Fombonne E. Pervasive developmental disorders in preschool children. Jama. 2001;285:3093–9. doi: 10.1001/jama.285.24.3093. [DOI] [PubMed] [Google Scholar]
- Chugani DC, et al. Evidence of altered energy metabolism in autistic children. Prog Neuropsychopharmacol Biol Psychiatry. 1999;23:635–41. doi: 10.1016/s0278-5846(99)00022-6. [DOI] [PubMed] [Google Scholar]
- Ciesielski KT, et al. Cerebellar hypoplasia and frontal lobe cognitive deficits in disorders of early childhood. Neuropsychologia. 1997;35:643–55. doi: 10.1016/s0028-3932(96)00119-4. [DOI] [PubMed] [Google Scholar]
- Courchesne E, et al. Unusual brain growth patterns in early life in patients with autistic disorder: an MRI study. Neurology. 2001;57:245–54. doi: 10.1212/wnl.57.2.245. [DOI] [PubMed] [Google Scholar]
- Courchesne E, Pierce K. Why the frontal cortex in autism might be talking only to itself: local over-connectivity but long-distance disconnection. Curr Opin Neurobiol. 2005;15:225–30. doi: 10.1016/j.conb.2005.03.001. [DOI] [PubMed] [Google Scholar]
- Courchesne E, et al. Parietal lobe abnormalities detected with MR in patients with infantile autism. AJR Am J Roentgenol. 1993;160:387–93. doi: 10.2214/ajr.160.2.8424359. [DOI] [PubMed] [Google Scholar]
- Courchesne E, et al. Abnormality of cerebellar vermian lobules VI and VII in patients with infantile autism: identification of hypoplastic and hyperplastic subgroups with MR imaging. AJR Am J Roentgenol. 1994a;162:123–30. doi: 10.2214/ajr.162.1.8273650. [DOI] [PubMed] [Google Scholar]
- Courchesne E, et al. Impairment in shifting attention in autistic and cerebellar patients. Behav Neurosci. 1994b;108:848–65. doi: 10.1037//0735-7044.108.5.848. [DOI] [PubMed] [Google Scholar]
- Courchesne E, et al. Hypoplasia of cerebellar vermal lobules VI and VII in autism. N Engl J Med. 1988;318:1349–54. doi: 10.1056/NEJM198805263182102. [DOI] [PubMed] [Google Scholar]
- Cox RW. AFNI: software for analysis and visualization of functional magnetic resonance neuroimages. Comput Biomed Res. 1996;29:162–73. doi: 10.1006/cbmr.1996.0014. [DOI] [PubMed] [Google Scholar]
- Cox RW, Jesmanowicz A. Real-time 3D image registration for functional MRI. Magn Reson Med. 1999;42:1014–8. doi: 10.1002/(sici)1522-2594(199912)42:6<1014::aid-mrm4>3.0.co;2-f. [DOI] [PubMed] [Google Scholar]
- Damasio AR, Maurer RG. A neurological model for childhood autism. Arch Neurol. 1978;35:777–86. doi: 10.1001/archneur.1978.00500360001001. [DOI] [PubMed] [Google Scholar]
- Danielsen ER, Ross B. Magnetic Resonance Spectroscopy Diagnosis of Neurological Diseases. Marcel Dekker, Inc; New York: 1999. [Google Scholar]
- Friedman SD, et al. Regional brain chemical alterations in young children with autism spectrum disorder. Neurology. 2003;60:100–7. doi: 10.1212/wnl.60.1.100. [DOI] [PubMed] [Google Scholar]
- Friedman SD, et al. Gray and White Matter Brain Chemistry in Young Children With Autism 10.1001/archpsyc.63.7.786. Arch Gen Psychiatry. 2006;63:786–794. doi: 10.1001/archpsyc.63.7.786. [DOI] [PubMed] [Google Scholar]
- Fu CH, et al. A functional magnetic resonance imaging study of overt letter verbal fluency using a clustered acquisition sequence: greater anterior cingulate activation with increased task demand. Neuroimage. 2002;17:871–9. [PubMed] [Google Scholar]
- Gaillard WD, et al. Functional anatomy of cognitive development: fMRI of verbal fluency in children and adults. Neurology. 2000;54:180–5. doi: 10.1212/wnl.54.1.180. [DOI] [PubMed] [Google Scholar]
- Gourovitch ML, et al. A comparison of rCBF patterns during letter and semantic fluency. Neuropsychology. 2000;14:353–60. doi: 10.1037//0894-4105.14.3.353. [DOI] [PubMed] [Google Scholar]
- Hadjikhani N, et al. Early visual cortex organization in autism: an fMRI study. Neuroreport. 2004;15:267–70. doi: 10.1097/00001756-200402090-00011. [DOI] [PubMed] [Google Scholar]
- Hashimoto T, et al. Differences in brain metabolites between patients with autism and mental retardation as detected by in vivo localized proton magnetic resonance spectroscopy. J Child Neurol. 1997;12:91–6. doi: 10.1177/088307389701200204. [DOI] [PubMed] [Google Scholar]
- Hashimoto T, et al. Development of the brainstem and cerebellum in autistic patients. J Autism Dev Disord. 1995;25:1–18. doi: 10.1007/BF02178163. [DOI] [PubMed] [Google Scholar]
- Hazlett HC, et al. Magnetic Resonance Imaging and Head Circumference Study of Brain Size in Autism: Birth Through Age 2 Years 10.1001/archpsyc.62.12.1366. Arch Gen Psychiatry. 2005;62:1366–1376. doi: 10.1001/archpsyc.62.12.1366. [DOI] [PubMed] [Google Scholar]
- Herbert MR, et al. Brain asymmetries in autism and developmental language disorder: a nested whole-brain analysis. Brain. 2005;128:213–26. doi: 10.1093/brain/awh330. [DOI] [PubMed] [Google Scholar]
- Herbert MR, et al. Localization of white matter volume increase in autism and developmental language disorder. Ann Neurol. 2004;55:530–40. doi: 10.1002/ana.20032. [DOI] [PubMed] [Google Scholar]
- Hisaoka S, et al. Regional magnetic resonance spectroscopy of the brain in autistic individuals. Neuroradiology. 2001;43:496–8. doi: 10.1007/s002340000520. [DOI] [PubMed] [Google Scholar]
- Horwitz B, et al. The cerebral metabolic landscape in autism. Intercorrelations of regional glucose utilization. Arch Neurol. 1988;45:749–55. doi: 10.1001/archneur.1988.00520310055018. [DOI] [PubMed] [Google Scholar]
- Hubrich-Ungureanu P, et al. Lateralized organization of the cerebellum in a silent verbal fluency task: a functional magnetic resonance imaging study in healthy volunteers. Neurosci Lett. 2002;319:91–4. doi: 10.1016/s0304-3940(01)02566-6. [DOI] [PubMed] [Google Scholar]
- Just MA, et al. Cortical activation and synchronization during sentence comprehension in high-functioning autism: evidence of underconnectivity. Brain. 2004;127:1811–21. doi: 10.1093/brain/awh199. [DOI] [PubMed] [Google Scholar]
- Kaufmann WE, et al. Specificity of cerebellar vermian abnormalities in autism: a quantitative magnetic resonance imaging study. J Child Neurol. 2003;18:463–70. doi: 10.1177/08830738030180070501. [DOI] [PubMed] [Google Scholar]
- Kleinhans N, et al. Executive functioning in Autistic Disorder and Asperger’s Disorder: Flexibility, fluency, and inhibition. Developmental Neuropsychology. 2005a;27:379–401. doi: 10.1207/s15326942dn2703_5. [DOI] [PubMed] [Google Scholar]
- Kleinhans N, et al. Atypical lateralization of language activity in autism spectrum disorders. 33rd Annual Meeting of the International Neuropsychological Society; Saint Louis, MO. 2005b. [Google Scholar]
- Kleinhans N, et al. Atypical lateralization of language activity in autism spectrum disorders. 33rd Annual Meeting of the International Neuropsychological Society; Saint Louis, MO. 2005, February. [Google Scholar]
- Laurence J, Fatemi S. Glial fibrillary acidic protein is elevated in superior frontal parietal and cerebellar cortices of autistic subjects. Cerebellum. 2005;4:206–10. doi: 10.1080/14734220500208846. [DOI] [PubMed] [Google Scholar]
- Levisohn L, et al. Neuropsychological consequences of cerebellar tumour resection in children: cerebellar cognitive affective syndrome in a paediatric population. Brain. 2000;123(Pt 5):1041–50. doi: 10.1093/brain/123.5.1041. [DOI] [PubMed] [Google Scholar]
- Levitt JG, et al. Proton magnetic resonance spectroscopic imaging of the brain in childhood autism. Biol Psychiatry. 2003;54:1355–66. doi: 10.1016/s0006-3223(03)00688-7. [DOI] [PubMed] [Google Scholar]
- Logothetis NK. The underpinnings of the BOLD functional magnetic resonance imaging signal. J Neurosci. 2003;23:3963–71. doi: 10.1523/JNEUROSCI.23-10-03963.2003. [DOI] [PMC free article] [PubMed] [Google Scholar]
- Lord C, et al. The Autism Diagnostic Observation Schedule--Generic: A standard measure of social and communication deficits associated with the spectrum of autism. Journal of Autism & Developmental Disorders. 2000;30:205–223. [PubMed] [Google Scholar]
- Lord C, et al. Autism Diagnostic Interview-Revised: a revised version of a diagnostic interview for caregivers of individuals with possible pervasive developmental disorders. Journal of Autism and Developmental Disorders. 1994;24:659–85. doi: 10.1007/BF02172145. [DOI] [PubMed] [Google Scholar]
- Luna B, et al. Neocortical system abnormalities in autism: an fMRI study of spatial working memory. Neurology. 2002;59:834–40. doi: 10.1212/wnl.59.6.834. [DOI] [PubMed] [Google Scholar]
- Middleton FA, Strick PL. Anatomical evidence for cerebellar and basal ganglia involvement in higher cognitive function. Science. 1994;266:458–61. doi: 10.1126/science.7939688. [DOI] [PubMed] [Google Scholar]
- Middleton FA, Strick PL. The cerebellum: an overview. Trends Neurosci. 1998;21:367–9. doi: 10.1016/s0166-2236(98)01330-7. [DOI] [PubMed] [Google Scholar]
- Miller GA, Chapman JP. Misunderstanding analysis of covariance. J Abnorm Psychol. 2001;110:40–8. doi: 10.1037//0021-843x.110.1.40. [DOI] [PubMed] [Google Scholar]
- Minshew NJ, et al. Neuropsychologic functioning in autism: profile of a complex information processing disorder. J Int Neuropsychol Soc. 1997;3:303–16. [PubMed] [Google Scholar]
- Muller RA, et al. Brain mapping of language and auditory perception in high-functioning autistic adults: a PET study. J Autism Dev Disord. 1999;29:19–31. doi: 10.1023/a:1025914515203. [DOI] [PubMed] [Google Scholar]
- Muller RA, et al. Abnormal variability and distribution of functional maps in autism: an FMRI study of visuomotor learning. Am J Psychiatry. 2003;160:1847–62. doi: 10.1176/appi.ajp.160.10.1847. [DOI] [PubMed] [Google Scholar]
- Murphy DG, et al. Asperger syndrome: a proton magnetic resonance spectroscopy study of brain. Arch Gen Psychiatry. 2002;59:885–91. doi: 10.1001/archpsyc.59.10.885. [DOI] [PubMed] [Google Scholar]
- Otsuka H, et al. Brain metabolites in the hippocampus-amygdala region and cerebellum in autism: an 1H-MR spectroscopy study. Neuroradiology. 1999;41:517–9. doi: 10.1007/s002340050795. [DOI] [PubMed] [Google Scholar]
- Page LA, et al. In Vivo 1H-Magnetic Resonance Spectroscopy Study of Amygdala-Hippocampal and Parietal Regions in Autism. 2006;163:2189–2192. doi: 10.1176/appi.ajp.163.12.2189. [DOI] [PubMed] [Google Scholar]
- Palmen SJ, et al. Neuropathological findings in autism. Brain. 2004;127:2572–83. doi: 10.1093/brain/awh287. [DOI] [PubMed] [Google Scholar]
- Paradiso S, et al. Cerebellar size and cognition: correlations with IQ, verbal memory and motor dexterity. Neuropsychiatry Neuropsychol Behav Neurol. 1997;10:1–8. [PubMed] [Google Scholar]
- Paulesu E, et al. Functional heterogeneity of left inferior frontal cortex as revealed by fMRI. Neuroreport. 1997;8:2011–7. doi: 10.1097/00001756-199705260-00042. [DOI] [PubMed] [Google Scholar]
- Phelps EA, et al. FMRI of the prefrontal cortex during overt verbal fluency. Neuroreport. 1997;8:561–5. doi: 10.1097/00001756-199701200-00036. [DOI] [PubMed] [Google Scholar]
- Pierce K, et al. The brain response to personally familiar faces in autism: findings of fusiform activity and beyond. Brain. 2004;127:2703–16. doi: 10.1093/brain/awh289. [DOI] [PubMed] [Google Scholar]
- Provencher SW. Automatic quantitation of localized in vivo 1H spectra with LCModel. NMR Biomed. 2001;14:260–4. doi: 10.1002/nbm.698. [DOI] [PubMed] [Google Scholar]
- Redcay E, Courchesne E. When is the brain enlarged in autism?: A meta-analysis of brain size reports. Biol Psychiatry. 2005;58:1–9. doi: 10.1016/j.biopsych.2005.03.026. [DOI] [PubMed] [Google Scholar]
- Riva D, Giorgi C. The cerebellum contributes to higher functions during development: Evidence from a series of children surgically treated for posterior fossa tumours. Brain. 2000;123:1051–1061. doi: 10.1093/brain/123.5.1051. [DOI] [PubMed] [Google Scholar]
- Rumsey JM, Hamburger SD. Neuropsychological findings in high-functioning men with infantile autism, residual state. J Clin Exp Neuropsychol. 1988;10:201–21. doi: 10.1080/01688638808408236. [DOI] [PubMed] [Google Scholar]
- Rumsey JM, Hamburger SD. Neuropsychological divergence of high-level autism and severe dyslexia. J Autism Dev Disord. 1990;20:155–68. doi: 10.1007/BF02284715. [DOI] [PubMed] [Google Scholar]
- Salmond CH, et al. Investigating individual differences in brain abnormalities in autism. Philos Trans R Soc Lond B Biol Sci. 2003;358:405–13. doi: 10.1098/rstb.2002.1210. [DOI] [PMC free article] [PubMed] [Google Scholar]
- Schmahmann JD, Sherman JC. Cerebellar cognitive affective syndrome. Int Rev Neurobiol. 1997;41:433–40. doi: 10.1016/s0074-7742(08)60363-3. [DOI] [PubMed] [Google Scholar]
- Silk TJ, et al. Visuospatial processing and the function of prefrontal-parietal networks in autism spectrum disorders: a functional MRI study. Am J Psychiatry. 2006;163:1440–3. doi: 10.1176/ajp.2006.163.8.1440. [DOI] [PubMed] [Google Scholar]
- Sparks BF, et al. Brain structural abnormalities in young children with autism spectrum disorder. Neurology. 2002;59:184–92. doi: 10.1212/wnl.59.2.184. [DOI] [PubMed] [Google Scholar]
- Talairach J, Tournoux P. Co-Planar Stereotaxic Atlas of the Human Brain: Three Dimensional Proportional System. Thieme; New York: 1988. [Google Scholar]
- Townsend J, et al. Spatial attention deficits in patients with acquired or developmental cerebellar abnormality. J Neurosci. 1999;19:5632–43. doi: 10.1523/JNEUROSCI.19-13-05632.1999. [DOI] [PMC free article] [PubMed] [Google Scholar]
- Turner MA. Generating novel ideas: fluency performance in high-functioning and learning disabled individuals with autism. J Child Psychol Psychiatry. 1999;40:189–201. [PubMed] [Google Scholar]
- Vargas DL, et al. Neuroglial activation and neuroinflammation in the brain of patients with autism. Annals of Neurology. 2005;57:67–81. doi: 10.1002/ana.20315. [DOI] [PubMed] [Google Scholar]
- Walker DR, et al. Specifying PDD-NOS: a comparison of PDD-NOS, Asperger syndrome, and autism. J Am Acad Child Adolesc Psychiatry. 2004;43:172–80. doi: 10.1097/00004583-200402000-00012. [DOI] [PubMed] [Google Scholar]
- Weiss EM, et al. Brain activation pattern during a verbal fluency test in healthy male and female volunteers: a functional magnetic resonance imaging study. Neurosci Lett. 2003;352:191–4. doi: 10.1016/j.neulet.2003.08.071. [DOI] [PubMed] [Google Scholar]
- Xiong J, et al. Intersubject variability in cortical activations during a complex language task. Neuroimage. 2000;12:326–39. doi: 10.1006/nimg.2000.0621. [DOI] [PubMed] [Google Scholar]
- Zilbovicius M, et al. Delayed maturation of the frontal cortex in childhood autism. Am J Psychiatry. 1995;152:248–52. doi: 10.1176/ajp.152.2.248. [DOI] [PubMed] [Google Scholar]
Associated Data
This section collects any data citations, data availability statements, or supplementary materials included in this article.