

Abstract
Receptor interacting protein 3 (RIP3) is a protein kinase that plays a key role in programmed necrosis. Despite the importance of RIP3-dependent necrosis in many pathological processes, current knowledge on the function of RIP3 is very limited. Here we present the results of a proteome-wide analysis of RIP3-regulated phosphorylation sites using cells from wildtype (RIP3+/+) and RIP3 knockout (RIP3−/−) mice. Because the activation of RIP3 requires stimulation by certain extracellular stimuli such as ligands of death receptors or Toll-like receptors, we compared the phosphorylation sites of lipopolysaccharide (LPS)-treated peritoneal macrophages from RIP3+/+ and RIP3−/− mice and the phosphorylation sites of tumor necrosis factor (TNF)-treated RIP3+/+ and RIP3−/− mouse embryonic fibroblast (MEF) cells. Stable isotope labeling by amino acids in cell culture and spike-in stable isotope labeling by amino acids in cell culture were used in the analyses of the MEFs and macrophages, respectively. Proteomic analyses using stable isotope labeling by amino acids in cell culture coupled with immobilized metal affinity chromatography-hydrophilic interaction liquid chromatography fractionation and nanoLC MS/MS identified 14,057 phosphopeptides in 4306 proteins from the macrophages and 4732 phosphopeptides in 1785 proteins from the MEFs. Analysis of amino acid sequence motifs among the phosphopeptides identified a potential motif of RIP3 phosphorylation. Among the phosphopeptides identified, 73 were found exclusively in RIP3+/+ macrophages, 121 were detected exclusively from RIP3+/+ MEFs, 286 phosphopeptides were induced more in RIP3+/+ macrophages than in RIP3−/− macrophages and 26 phosphopeptides had higher induction in RIP3+/+ MEFs than in RIP3−/− cells. Many of the RIP3 regulated phosphoproteins from the macrophages and MEF cells are functionally associated with the cell cycle; the rest, however, appear to have diverse functions in that a number of metabolism related proteins were phosphorylated in macrophages and development related phosphoproteins were induced in MEFs. The results of our phosphoproteomic analysis suggest that RIP3 might function beyond necrosis and that cell type specific function of RIP3 exists.
Cell death previously has been subdivided into regulated (apoptosis, or programmed cell death) and unregulated (necrosis) forms. Apoptosis is described as an active, programmed process of autonomous cellular dismantling that avoids eliciting inflammation. Necrosis has been characterized as a passive, accidental cell death resulting from environmental perturbations with uncontrolled release of inflammatory cellular contents. In contrast to apoptosis, which is executed by multiple caspases, necrosis was mechanically undefined and caspases-independent. Now it has been realized that some necrotic cell deaths are executed by defined mechanisms. Receptor interacting protein 3 (RIP3)1 is a RIP family protein kinase that has recently emerged as an essential regulator of programmed necrosis (1–3). RIP3 functions downstream of death receptors, Toll-like receptors, or other sensors, to mediate necrotic cell death (1, 4, 5). Ligation of death receptor TNF Receptor 1 (TNFR1) allows the cytosolic part of the receptor to recruit TNFR-associated death domain (TRADD), RIP1 and TNFR-associated factor 2 (TRAF2), and inhibitor of apoptosis proteins 1 and 2 (cIAP1/2) and to generate a membrane-proximal TNFR1 complex 1, which initiates NF-κB activation. On internalization of ligand-bound TNFR1, the molecular composition of the TNFR1-complex 1 changes and forms a cytosolic death-inducing signaling complex, also known as complex II (6, 7). RIP3 can switch complex II from apoptosis inducer to necrosis activator by being incorporated into complex II to form a necrosome (5, 8). In the necrosome, caspase-8 inactivates RIP1 and RIP3 by proteolytic cleavage. The inhibition of RIP3-mediated necrosis by caspase-8 is supported by the observation that the embryonic lethality of caspase-8-deficient mice is rescued by RIP3 deletion (9, 10). When caspase-8 is deleted or inhibited, RIP1/RIP3-dependent necrosis (also named necroptosis) is enhanced. Although RIP1 and RIP3 are both required for many necrotic processes, RIP3-dependent necrosis can also proceed without RIP1 because RIP3 overexpression or viral infection can induce necrosis independent from RIP1 (1, 4). Mixed lineage kinase domain-like protein (MLKL) and phosphoglycerate mutase family member 5 (PGAM5) were shown recently to act downstream of RIP3 in the necroptosis pathway (11–13).
Because a growing body of evidence has shown that necrosis plays an important role in many pathophysiological processes, the function of RIP3 has become an interest of many investigators. Although RIP1, GLUL, PYGL, GLUD1 and MLKL have been identified as potential substrates of RIP3 (1, 11), information on the sites of phosphorylation for these proteins by RIP3 is very limited. RIP3 is only expressed in selected cell types and its expression can be up-regulated under certain pathological conditions. How RIP3 functions in different cell types and under different conditions remains largely unknown. Identifying the downstream targets of RIP3 will give important insight into the molecular mechanisms of RIP3-modulated pathways.
Quantitative phosphoproteomics has been demonstrated to be a powerful method in the study of kinase-mediated regulation of signal transduction (14–16). Quantitative phosphoproteomics incorporates many techniques such as labeling techniques, phosphopeptide enrichment techniques and phosphopeptide fractionation techniques. Stable isotope labeling with amino acids in cell culture (SILAC) and isobaric tagging for relative and absolute quantitation (iTRAQ) are the labeling methods most frequently used in quantitative proteomics. Both strong cation exchange (SCX) and hydrophilic interaction liquid chromatography (HILIC) are successfully used in peptide fractionation (17–20). SILAC cannot be used in samples that cannot be cultured, such as tissues and some primary cells, because they cannot be labeled with stable isotopes in vitro (21, 22). In vivo labeling of tissues with stable heavy isotopes has been used, but the procedure is complicated and costly (23). Recently, a strategy named spike-in SILAC has been developed to apply the SILAC technique to comparative phosphoproteome analyses of mammalian tissues (24, 25). This strategy uses peptide standards generated from a heavy isotope labeled cell line to quantify proteins in tissue samples.
To compare the phosphoproteome between RIP3+/+ and RIP3−/− peritoneal macrophages, we extended the application of the spike-in strategy to nonproliferating primary macrophage cells. Because MEF cells can proliferate in vitro, SILAC (termed canonical SILAC in this manuscript to distinct it from spike-in SILAC) was used in analyzing their phosphoproteomes. Our results showed that spike-in SILAC coupled with immobilized metal affinity chromatography-hydrophilic interaction liquid chromatography (IMAC-HILIC) fractionation and nanoLC MS/MS is a reliable workflow for quantifying phosphopeptides from nonproliferating primary cells. Our analyses of LPS-stimulated macrophages and TNF-treated MEFs have led to the identification of 506 RIP3 dependent phosphopeptides on 442 proteins. These results provide very useful information for the study of RIP3 function.
EXPERIMENTAL PROCEDURES
Reagents and Materials
Acetonitrile and methanol were purchased from Fisher Scientific (Fair Lawn, NJ). Trypsin was purchased from Worthington (Lakewood, NJ). Ni-NTA spin column was purchased from Qiagen (Qiagen Strasse, Hilden, Germany). Urea, Iron(III) chloride hexahydrate, sodium dodecyl sulfate, ammonium hydroxide, ethylenediaminetetraacetic acid disodium salt dehydrate, acetic acid, formic acid, ammonia-water (NH3·H2O), trifluoroacetic acid, sodium chloride, d,l-Dithiothreitol, iodoaetamide, and ammonium bicarbonate were purchased from Sigma Aldrich (St. Louis, MO). Water was deionized to 18 mΩ by a Milli-Q system (Millipore, Bedford, MA).
Primary Peritoneal Macrophages
Thioglycorate-elicited macrophages were obtained from 8-week-old mice as described previously (1). RIP3+/+ and RIP3−/− macrophages (26) each from 8 mice were pooled and resuspended in Dulbecco's Modified Eagle Medium (DMEM) containing 10% fetal calf serum (FCS). They were then plated in 10 cm plates and cultured in the condition of 37 °C and 5% CO2.
Immunoprecipitation Kinase Assay
Cells were lysed in lysis buffer (20mm Tris-HCl at pH 7.5, 150 mm NaCl, 1mm EDTA, 1mm EGTA, 1% Triton X-100, 2.5mm sodium pyrophosphate, 1mm β-glycerophosphate, 1mm Na3VO4 and 1μgml−1 leupeptin) and immunoprecipitated with anti-RIP3 antibody-conjugated protein A/G-Sepharose beads. Immunocomplexes were subjected to an in vitro kinase assay in a kinase buffer (25mm Tris-HCl at pH 7.5, 10 mm MgCl2, 2 mm dithiothreitol, 5 mm β-glycerophosphate and 0.1 mm Na3VO4) containing γ-32P ATP at 30°C for 30min. The autophosphorylation of RIP3 was detected as described (27).
Immunoprecipitation and Western Blotting
Immunoprecipitations were performed using anti-flag M2 beads. Western blotting of cell lysates and immunoprecipitates was preformed as described using anti-flag, anti-Myc, or anti-HA antibodies.
Mn2+-phos-tag SDS-PAGE
Electrophoresis of the polyacrylamide gel containing Mn2+-phos-tag was conducted as described previously (28).
Stable Isotope Labeling by Amino Acids in Cell Culture (SILAC)
For SILAC labeling, immortalized MEF cells and RAW264.7 cells were cultured in amino acid deficient DMEM (Thermo) supplemented with either 0.1 mg/ml isotopically normal (“light”) l-Lysine and l-Arginine (Sigma) or “heavy” 13C6 15N2 l-Lysine and 13C615N4 l-Arginine (Sigma), 10% dialyzed FBS (Thermo), 2 mm l-Glutamine, 80 mg/ml of proline, 0.1 mg/ml streptomycin, and 0.2 U/ml penicillin. Cells were grown for six doubling times prior to use in order for the labeled amino acids to be fully incorporated in the cells.
Protein Extraction and Digestion by Filter-aided Sample Preparation
SILAC labeled MEF cells were treated with 50 ng/ml tumor necrosis factor-α (TNF) for four hours; SILAC labeled RAW264.7 cells and peritoneal macrophages were treated with 1 μg/ml lipopolysaccharides (LPS) for two hours. The cells were collected and the proteins were extracted and digested using filter-aided sample preparation (29). After removing the culture media, a buffer containing 4% SDS, 0.1 m dithiothreitol, and 0.1 m Tris-HCl pH 8.5 was added into the cell plates. The cells were then scrambled and transferred to eppendorf tubes. The tubes were incubated for 3 min at 95 °C, followed by sonication to decrease the viscosity, and centrifuged at 16,000 × g at 20 °C for 5 min. Supernatant was collected for the analyses, and the replicates were pooled. A small aliquot of cell lysate was diluted and the protein concentration was measured with a G250 (Bio-Rad). Equal amounts of proteins from RIP3+/+ and RIP3−/− MEF cells, that were labeled with heavy or normal (light) amino acids respectively, were mixed. For the spike-in SILAC experiment, heavy amino acid labeled proteins from LPS-treated RAW264.7 cells were utilized as spike-in standards. We performed three replicate experiments in which the sample (proteins from RIP3+/+ or RIP3−/− macrophages) and the standard were mixed in ratios of 1:1 for replicate experiments 1 and 3, and in ratio of 1:4 for replicate experiment 2. For every SILAC experiment, 5 mg of each starting sample was used. The 5 mg samples were loaded onto a 15 ml AmiconUltra Ultracel-30K filter (Millipore). SDS from the samples was removed by two 2 ml urea exchanges followed by alkylation with 50 mm iodoacetamide for 20 min in darkness. The urea was then replaced with 50 mm NH4HCO3. Trypsin was added to digest the protein at a protein:trypsin ratio of 50:1 for 12–18 h at 37 °C. Peptides were collected from the filter by centrifugation followed by a wash with water. The peptide mixture was acidified by the addition of formic acid to a final concentration of 1% and then centrifuged. The supernatant was then desalted on SepPak C18 columns (Waters) and the desalted peptide was dried and stored at −80 °C.
Phosphopeptide Enrichment and HILIC Fractionation
Phosphopeptide enrichment is performed using IMAC. Resins from three silica-nitrilotriacetic acid spin columns (Qiagen) were added to 50 ml of buffer containing 50 mm EDTA (pH 8.0) and 1 m NaCl and incubated for 1 h at room temperature under rotation. The resins were then spun down and washed sequentially with 50 ml of water and 50 ml of 0.6% acetic acid and finally incubated with 50 ml of 100 mm FeCl3 in 0.3% acetic acid for 1 h under rotation. The resins were then washed with 50 ml of 0.6% acetic acid, and then with 50 ml of a solution containing 25% acetonitrile, 0.1 m NaCl, and 0.1% acetic acid, and then two more times with 50 ml of 0.1% acetic acid. Finally, the resins were resuspended in 0.1% acetic acid as a 50% (v/v) slurry, stored at 4 °C and ready for IMAC enrichment. The IMAC procedure was performed according to optimized IMAC-IMAC protocol with minor modifications (30). The tryptic peptide samples corresponding to the 5 mg protein samples were re-dissolved in 1% acetic acid/60% acetonitrile, and incubated with a 40 μl bed volume of IMAC beads. The mixture was shaken vigorously for one hour at room temperature and then loaded onto an in-house made tip (Corning). The beads were washed with twice their volume of 1% acetic acid/60% acetonitrile, and the phosphopeptides were collected with three times the beads' volume of 6% NH3·H2O. A small aliquot of the phosphopeptides was injected directly into a mass spectrometer to check the IMAC efficiency. The phosphopeptides were then lyophilized to dryness and stored at −80 °C prior to HILIC separation.
HILIC was performed using a 1260 HPLC system (Agilent) with a TSKgel Amide-80 HILIC column (2.0 × 150 mm, 5 μm; Tosoh Biosciences, Tokyo, Japan) at a flow rate of 150 μl/min. Two buffers were used for the gradient: buffer A, 90% acetonitrile containing 0.005% trifluoroacetic acid, and buffer B, 0.005% trifluoroacetic acid. Phosphopeptides eluted from IMAC were resuspended in 200 μl of 70% acetonitrile and then injected into the HILIC Amide-80 column via a 200 μl loop with a flow rate of 150 μl/min. 1.5 min fractions from the HILIC were collected and dried under reduced pressure. The gradient used is as follows: 100% buffer A at time 0 min, 11% buffer B at 5 min, 29% buffer B at 20 min, 95% buffer B at 45 min, 95% buffer B at 50 min, and finally 100% buffer A at 55 min. A total of 40 fractions were collected. Some of the fractions were pooled according to the HILIC elution profile and then dried in a vacuum centrifuge.
Nano-LC-MS/MS Analysis
The dried HILIC fractions were dissolved in 2% acetonitrile containing 0.1% formic acid and analyzed by a TripleTOF 5600 System (AB SCIEX, Foster City, CA), a hybrid quadrupole TOF platform (31). A splitless Ultra 2D Plus (Eksigent, Dublin, CA) system was coupled with the TripleTOF 5600 using a Nanospray III source (AB SCIEX, Concord, ON, CA). HPLC gradients were delivered at 300 nL/min. Buffer A was 2% acetonitrile and 0.1% formic acid; buffer B was 98% acetonitrile and 0.1% formic acid. The HPLC gradient program delivered an acetonitrile gradient over 120 min (5–30% buffer B over 80 min, 30–60% buffer B over 12 min, 60–90% buffer B over 6 min, hold buffer B at 90% for 10 min, and 90–5% B in 12 min). Peptides were separated on a fused silica capillary emitter (inner diameter, 75 μm; New Objective, Woburn, MA) packed in-house with 5 μm C18 resin (New Objective), and analyzed in the positive ion mode by electrospray ionization (spray voltage = 2.2 kv). For IDA (information dependent acquisition), survey scans were acquired in 250 ms and 20 product ion scans were collected in 50 ms/per scan.
Identification and Quantification of Phosphopeptides
Data processing composed of two parts: ProteinPilot was first used to identify and quantify the phosphopeptides and then Mascot coupled with Scaffold software was employed to determine the probability of the phosphorylation site locations, as shown in supplemental Fig. S1.
All raw data files (*.wiff) from the HILIC fractions were collectively searched with ProteinPilot Software v. 4.1.46 beta (AB SCIEX, Foster City, CA) using the Paragon and Progroup Algorithm (32) against the Uniprot Mus musculus database (canonical and isoform sequence data, containing 50,402 sequences, downloaded in April 2011) with common contaminants included. The following search parameters were selected: sample type (SILAC (Lys+8, Arg+10)), cys alkylation (iodoacetamide), digestion (trypsin), instrument (TripleTOF 5600), special factors (phosphorylation emphasis), and search effort (Rapid). The tolerances were specified as ±0.05 Da for peptides and ±0.05 Da for MS/MS fragments. The detected protein threshold (unused ProtScore) was set to 1.3 (95% confidence). Quantitation information was extracted by ProteinPilot using the way where the apex of elution of a peptide was determined and then the area of the isotope clusters at apex was estimated for heavy and light. The false discovery rate (FDR) analysis was done using the integrated tools in ProteinPilot.
Peptides were filtered with confidence corresponding to the 1% FDR. All phosphopeptides then were extracted, redundant phosphopeptides were eliminated and the number of distinct phosphopeptides was calculated (we defined peptides as redundant if the cleavage site(s), modifications and amino acid sequences were identical).
Quantitative phosphopeptides were selected by following criteria. Firstly, the phosphopeptides with no quantitative information were discarded. Subsequently, the phosphopeptides that were annotated with “auto-discordant peptide type” and “auto-shared MS/MS” by the ProteinPilot software were filtered out. Next, a Grubbs' test was performed to exclude phosphopeptide outliers (p < 0.05) with H/L ratios significantly different from other redundant peptides. The average and standard deviation for each peptide's ratios were then calculated after the exclusion. The extreme ratio of 100 means only heavy peptide was detected and the extreme ratio of 0.01 means only light peptide was detected. These phosphopeptides were classified as “phosphopeptides with extreme ratios,” and the rest of the phosphopeptides were classified as “phosphopeptides with nonextreme ratios.” MS1 spectrum intensities of every phosphopeptide with the extreme ratio of 100 were manually inspected. The phosphopeptides with weak intensities as determined by ProteinPilot were discarded.
All peptide H/L ratios were calculated as log2 (H/L). We used 2 as a cutoff value for the phosphopeptides with nonextreme ratios. Those that are equal or less than two were discarded. For the spike-in SILAC data, to adjust the H/L ratios of the standard/RIP3+/+ macrophage proteins in replicate experiment 2, where the standard proteins were mixed with RIP3+/+ macrophage proteins in a ratio of 4:1, the H/L ratios of phosphopeptides were first divided by four and then combined with the ratios of phosphopeptides detected in RIP3+/+ replicate experiments 1 and 3, in which standard proteins were mixed with RIP3+/+ macrophage proteins in a ratio of 1:1. Nonextreme ratios from overlapping phosphopeptides in both experiments were averaged. The same method was used for RIP3−/− replicate experiments. Extreme phosphopeptide ratios in the RIP3+/+ experiments 1, 2 and 3 (or RIP3−/− experiments 1, 2 and 3) were only accepted if they were reproduced in at least two replicate experiments. Quantitative phosphopeptides detected in both the RIP3+/+and the RIP3−/− experiments were accepted and the RIP3+/+/RIP3−/− ratios of phosphopeptides were obtained by dividing the H/L ratio of RIP3+/+ by the H/L ratio of RIP3−/−. Two was also used as the cutoff value, so all phosphopeptides with a log2 (RIP3+/+/RIP3−/−)>2 were extracted. Peptides detected exclusively in RIP3+/+ were considered only if light peptides were detected in the RIP3+/+ experiment and heavy counterparts were detected in RIP3−/− experiment (supplemental Fig. S2). Phosphopeptides with a log2 (RIP3+/+/RIP3−/−)>2 or detected exclusively in RIP3+/+ cells were considered to be significantly different between RIP3+/+ and RIP3−/−. All statistical tests and analyses were performed using Excel and R programs.
To evaluate whether protein degradation could influence the phosphopeptides obtained, we analyzed the corresponding protein ratios of some identified phosphopeptides. In the MEF cell experiments, we collected flow-through parts (nonphosphopeptides) from IMAC phosphopeptide enrichment and fractionated the flow-through by HILIC fractionation. 10 fractions were subjected to MS analysis. All raw files (*.wiff) were collectively searched against the Uniprot Mus musculus database (canonical and isoform sequence data, containing 50,402 sequences, downloaded in April 2011) with common contaminants included using ProteinPilot V.4.1 46 beta, and the proteins were filtered at 1% FDR. The following search parameters were selected: sample type (SILAC (Lys+8, Arg+10)), cys alkylation (iodoacetamide), digestion (trypsin), instrument (TripleTOF 5600), and search effort (Rapid). 3,819 proteins were identified and quantified. 97.5% (3727 proteins) of all quantified proteins did not show significant difference in their levels between TNF treated and nontreated cells (Log2 (H/L)<2). A comparison between the significantly increased phosphorylation sites (Log2 (H/L)>2 and exclusively in WT) and the significantly increased proteins (Log2 (H/L)>2 and exclusively in WT) revealed that the change in detected phosphorylation was not caused by altered protein levels (data not shown), suggesting that protein degradation did not influence the phosphoproteomic analysis in this study.
Phosphorylation Site Localization
To obtain the probability of a phosphorylation site being correct, Ascores were determined using the software program ScaffoldPTM (ScaffoldPTM version 3.3, Proteome Software Inc., Portland, OR, www.proteomesoftware.com) (33). All .wiff files were converted to .mgf files and searched against the Uniprot Mus musculus database (canonical and isoform sequence data, containing 50,402 sequences, downloaded in April 2011) with common contaminants included by Mascot version 2.3 using the following parameters: two missed cleavage sites, methionine oxidation, asparagine/glutamine deamidation and phosphorylation of tyrosine, serine and threonine were specified as variable modifications, quantitation SILAC (Lysine+8 and Arginine +10) was selected, fragment mass tolerance was set to ±0.2 Da (monoisotopic), and precursor was set to ±40 ppm. All Mascot search results were then loaded into Scaffold (Scaffold version 3.3, Proteome Software Inc., Portland, OR, www.proteomesoftware.com) for analysis, and the proteins and peptides with at least 95% probability as determined by the Protein Prophet and the Peptide Prophet algorithms respectively were accepted (34, 35). The MzIdentML files generated by Scaffold were loaded into ScaffoldPTM and the Ascore value for each phosphorylation site localization was determined. These phosphopeptides with Ascores were compared with the phosphopeptides identified by ProteinPilot Software v. 4.1. Phosphopeptides with Ascores ≥19 were accepted. Scores ≥19 indicate that the phosphorylation assignment has a 99% chance of being correct. About 30–40% of the phosphopeptides identified by ProteinPilot overlap with those by Mascot. For the phosphopeptides without an Ascore, we randomly selected 100 phosphopeptides with 80–90% confidence and 200 phosphopeptides with 90–99% confidence for manual inspection, and found that 35 out of 100 (35%) and 142 out of 200 (71%) phosphorylation sites were correctly assigned; thus, the phosphopeptides with a minimum of 90% confidence as determined by ProteinPilot were accepted.
Bioinformatics Analysis
Sequence stretches of ± 6 residues for all up-regulated serine phosphorylation sites were analyzed by Motif-X to extract significantly overrepresented motifs (36). In the Motif-X analysis, the minimum number of occurrences and the required motif significance were set to 10 and 10−6, respectively.
Pathway enrichment was determined at the protein level by collapsing the RIP3 regulated phosphopeptides into gene symbols. The analysis was performed using DAVID (37, 38), SP_PIR_KEYWORDS, the GOTERM_BP_ FAT and GOTERM_MF_FAT categories, and Biocarta. KEGG pathways were selected.
Data Accession
The data associated with this manuscript may be downloaded from the ProteomeCommons.org Tranche network using the following hashs.
For the experiment using MEF cells, all raw data (*.wiff) from HILIC fractions can be downloaded by this hash: NaDwpznHidm4oJ4inCYee+GPYuFAwYjHbHH7kFx9fI7BqVxkCQix5tiWXqi3w74ecvptX5mkbH/TrYmjBJo+Vw0+QZYAAAAAAAAXfw==.
For the experiments using Macrophage cells, all raw data (*.wiff) from HILIC fractions can be downloaded by this hash: IWEowMlzGfdLsvbFZk3CaQLYkQFzAS2bEyhiuVTGacJ3XJ/SO41KM6Fc4gODUe+wa1jDYIS9ghqzmR2gLHpqcnUjtKcAAAAAAAABiw==.
RESULTS
Sample Preparation
The sample processing and separation scheme is presented in Fig. 1. Because RIP3 dependent phosphorylation of cellular proteins is a major part of RIP3 mediated cellular changes, we wanted to employ quantitative phosphoproteomic analyses to compare protein phosphorylation in the presence and absence of RIP3 upon extracellular stimulation. Because RIP3 is highly expressed in macrophages, and primary peritoneal macrophages can be isolated from wildtype (RIP3+/+) and RIP3−/− mice, we decided to analyze the changes in phosphoproteins induced by bacterial lipopolysaccharide (LPS) stimulation in the presence and absence of RIP3. Because RIP3 is activated at two hours after LPS stimulation (supplemental Fig. S3), macrophages treated with LPS for two hours were collected for the analysis. Because peritoneal macrophages cannot proliferate in vitro, SILAC labeling cannot be directly applied to them. We therefore used a spike-in strategy. Spike-in SILAC has been used recently in the quantitative proteomics of tissues (24, 25, 39, 40). In this procedure, relevant culture cells are labeled with heavy amino acids. The labeled proteins are then mixed with nonlabeled proteins from a given tissue for proteomic analysis. The heavy amino acid labeled proteins are the spike-in standards. A requirement for using the spike-in SILAC strategy is finding a suitable cell line that can provide spike-in standards. RAW264.7 is a murine macrophage cell line which has been extensively used as a renewable surrogate for macrophages in in vitro experiments. Because its proteome should be similar to that of peritoneal macrophages, the RAW264.7 cell should be able to provide counterparts to the expressed proteins in peritoneal macrophages and allow for phosphopeptide quantitation in macrophages. To achieve a deep coverage of the phosphoproteome with spike-in SILAC (25, 29), we mixed the sample (proteins from LPS-treated RIP3+/+ or RIP3−/− peritoneal macrophages) and the standard (proteins from heavy amino acid labeled RAW264.7 cells) in ratios of 1:1 for two replicate experiments and 1:4 for one experiment, and named them replicates 1 and 3 and replicate 2, respectively (Fig. 1A). These samples were then further subjected to phosphopeptide analysis.
Fig. 1.

Scheme illustrating the experimental design and workflow. RAW264.7 cells were grown in SILAC DMEM media supplemented with 10% dialyzed FBS and “heavy” 13C615N2 l-Lysine and 13C615N4 l-Arginine for six doubling times before experiments. RIP3+/+ and RIP3−/− macrophages were cultured in DMEM media and considered “light” labeled cells. One μg/ml LPS was added into the cultures of RAW264.7 and RIP3+/+ and RIP3−/− macrophages for 2 h and the cells were collected. Proteins from RAW264.7 were used as a standard for the spike-in SILAC experiment. In replicate experiment 1 (R1) and 3 (R3), proteins from the RIP3+/+ or RIP3−/− macrophages were mixed with the RAW264.7 standard in a ratio of 1:1. In replicate experiment 2 (R2), proteins from the RIP3+/+ or RIP3−/− macrophages were mixed with the standard in a ratio of 1:4. RIP3+/+ MEF cells were grown in a SILAC DMEM media containing “heavy” 13C615N2 l-Lysine and 13C615N4 l-Arginine. RIP3−/− MEF cells were grown in a SILAC DMEM media with light (normal) l-Lysine and l-Arginine. Both cultures of MEF cells were grown for six doubling times followed by four hours of TNF (50 ng/ml) treatment, and then were harvested. The MEF cell sample is a mixture of the proteins from RIP3+/+ and RIP3−/− MEFs at a 1:1 ratio. The macrophage and MEF samples were subjected to filter-aided sample preparation digestion, IMAC enrichment, HILIC fractionation and LC-MS/MS analysis.
To determine whether or not the spike-in SILAC was performed well we conducted a paralleled experiment using canonical SILAC. This experiment used immortalized wildtype (RIP3+/+) and RIP3−/− MEF cells (Fig. 1B). Cells treated with TNF for four hours were used in our experiments because RIP3 is activated at four hours after TNF treatment (supplemental Fig. S3). The canonical SILAC experiment provided not only a reference for the efficiency of our spike-in SILAC experiments, but also information on RIP3 mediated protein phosphorylation in MEFs and thus allowed us to compare the patterns of RIP3-dependent phosphorylation between macrophages and MEF cells.
Identification and Quantification of Phosphopeptides
Six macrophage samples were prepared for phosphoproteomic analysis; distinct phosphopeptide information from the six spike-in SILAC samples was extracted and combined. The phosphopeptides that were only detected as heavy (H) peptides or light (L) peptides were given an extreme ratio of 100 or 0.01, respectively. The rest of the phosphopeptides were classified as phosphopeptides with nonextreme H/L ratios. The data from the phosphopeptides with a H/L ratio = 0.01 was discarded for further analysis because a H/L ratio = 0.01 means that the phosphopeptide from the RAW264.7 cells was not detected and thus the phosphopeptide from the macrophages lacks a standard to compare with and cannot be used. The numbers of phosphopeptides in different categories are summarized in Table I and described below.
Table I. Summary of quantitative phosphopeptides in macrophage experiments.

The heavy amino acid labeled RAW264.7 proteins (standards) and the RIP3+/+ or RIP3−/− macrophage proteins from three replicated samples were mixed in ratios of 1:1 or 4:1 and the mixtures were subjected to MS analysis. In total, 14,057 distinct phosphopeptides were identified and mapped to 4306 proteins. In the RIP3+/+ sample in replicate 1 (RIP3+/+ replicate 1), 2975 quantitative phosphopeptides with nonextreme ratios and 974 phosphopeptides with the extreme ratio of H/L = 100 were identified. In RIP3+/+ replicate 2, 3536 nonextreme ratio phosphopeptides and 537 phosphopeptides with the extreme ratio of 100 were detected. In RIP3+/+ replicate 3, 2476 nonextreme ratio phosphopeptides and 431 phosphopeptides with the extreme ratio of 100 were detected. In total, 5881 phosphopeptides with nonextreme ratios and 1798 with the extreme ratio of 100 were obtained. To determine the reproducibility of the three RIP3+/+ replicates, the correlation between two out of three replicates was analyzed for each combination (supplemental Fig. S4). The high correlation coefficient (R range from 0.80 to 0.91) indicated that the reproducibility of our experiments is good.
The numbers of the phosphopeptides with nonextreme ratios and with the extreme ratio of 100 were 3495 and 1431 respectively in RIP3−/− replicate 1, 3479 and 734 respectively in replicate 2, and 2729 and 486 respectively in replicate 3. In total, 6180 phosphopeptides with nonextreme ratios and 2358 phosphopeptides with extreme ratios were obtained in RIP3−/− samples. Similar to in the RIP3+/+ samples, nonextreme ratio phosphopeptides detected in any two of RIP3−/− replicates showed a high correlation coefficient (supplemental Fig. S4B), indicating that our RIP3−/− experiments are highly reproducible.
Among the phosphopeptides with nonextreme ratios, 3715 phosphopeptides were found in both the RIP3+/+ and RIP3−/− macrophages. Of these 3,715 phosphopeptides, 286 were at significantly higher levels in the RIP3+/+ macrophages than that in the RIP3−/− cells (Log2 (RIP3+/+/RIP3−/−) >2), and 349 were the opposite (Log2 (RIP3+/+/RIP3−/−) <-2). We compared the phosphopeptides with nonextreme ratios in the RIP3+/+ experiments to the phosphopeptides with the extreme ratio of H/L = 100 in the RIP3−/− experiments to find the phosphopeptides exclusively induced in RIP3+/+ macrophages (supplemental Fig. S2). In RIP3+/+ 620 phosphopeptides were detected but not in RIP3−/− macrophages. On the other hand, 588 phosphopeptides were exclusively detected in RIP3−/− macrophages. Because the phosphopeptides identified in at least two replicate experiments should be more reliable, we analyzed these phosphopepetides and found 73 phosphopeptides that were exclusively induced in RIP3+/+macrophages and 37 phosphopeptides were exclusively present in RIP3−/− macrophages. The data is summarized in Table I.
In the experiment using MEF cells, 4765 distinct phoshopeptides were identified and mapped to 1785 proteins. Among the identified phosphopeptides, 4087 were quantitative, including 3864 phosphopeptides with nonextreme ratios and 218 phosphopeptides with extreme ratios. Of the 3864 phosphopeptides, 26 phosphopeptides increased significantly more in TNF-treated RIP3+/+ cells than in RIP3−/− cells (log2 (RIP3+/+/RIP3−/−)>2), and 41 phosphopeptides were induced less in RIP3+/+ cells than in RIP3−/− cells. Among the 223 phosphopeptides with extreme ratios, 116 phosphopeptides were exclusively detected in RIP3+/+ MEF cells, and 102 phosphopeptides in RIP3−/− MEF cells. This data is summarized in Table II. In total, we identified 14,081 phosphosites in macrophage and MEF cells. These phosphosites were compared with the PhosphositePlus (41) and Phospho.ELM (42) databases of known phosphosites. Of these 6131 phosphosites were known, whereas 7950 phosphosites have not been identified before. A summary of the identified phosphorylation sites in MEF cells and macrophages is available in supplemental Table S1. A summary of the quantitative phosphorylation sites is presented in supplemental Table S2.
Table II. Summary of quantitative phosphopeptides in MEF experiments.
| MEF | |||
|---|---|---|---|
| Phosphopeptides exclusively in RIP3+/+ | 116 | ||
| Phosphopeptides exclusively in RIP3−/− | 102 | ||
| Phosphopeptides that have RIP3+/+/RIP3−/− ratio | Total | 3864 | |
| Ratio | Increase | 26 | |
| Decrease | 41 | ||
Although we identified a large number of potential RIP3 dependent phosphosites (Table I and Table II), the phosphosite in a known RIP3 substrate MLKL was not detected in this study. The phosphosites in other potential RIP3 substrates such as serine 15 in PYGL, threonine 410 and serine 473 in GLUD1 were detected with high confidence but lack quantitative information and thus were discarded for further analysis. To validate that the proteins identified in our study contain RIP3 substrates, we analyzed five identified proteins, AKTIP, ZBP1, PEA15A, IRS2, and TSC2. Because the kinase activity of recombinant RIP3 proteins is very low, and some of these five proteins cannot be expressed well in E. coli, we chose not to use in vitro kinase assays to validate whether these proteins are the substrates of RIP3. Instead we co-expressed each of these five proteins with RIP3 in 293T cells and examined their interaction with RIP3 by a co-immunoprecipitation assay. AKTIP, ZBP1, IRS2, and TSC2, but not PEA15A, can be co-immunoprecipitated with RIP3 (supplemental Fig. S5). A dinuclear metal complex (i.e. 1,3-bis[bis(pyridin-2-ylmethyl)amino]propan-2-olato dizinc(II) complex) can act as a selective phosphate-binding tag molecule (Phos-tag). When it is incorporated into SDS-poly acrylamide gel, it provides a phosphate affinity that decreases the mobility of phosphorylated proteins and thus led to band-shifts for some phosphoproteins. We analyzed whether RIP3 can cause a Phos-tag shift for co-expressed potential substrates and found that IRS2 was shifted by RIP3 (supplemental Fig. S6), suggesting that at least some of the identified proteins in this phosphoproteomic study are substrates of RIP3.
Comparison of SILAC and Spike-in SILAC Experiments
To evaluate the quality of quantitative measurement from the spike-in SILAC experiments, the distribution of H/L ratios from the quantitative phosphopeptides with nonextreme ratios in each experiment were plotted. The numbers of quantitative phosphopeptides that have nonextreme ratios are shown at the top of each histogram (Fig. 2A). Because the canonical SILAC method mixes heavy and light amino acid-labeled samples from the same cell type for comparison, the distribution of H/L should be narrow and most of the phosphopeptides should have a Log2 H/L ratio < 2 (43). Our data obtained by the canonical SILAC analysis of MEF cells also showed a Log2 H/L ratio < 2 (Fig. 2B). The histograms in Fig. 2A show that most (>90%) phosphopeptides in our spike-in SILAC samples have a Log2 H/L ratio < 5, indicating that the phosphoproteins in RAW264.7 (spike-in standard) are not exactly the same as those in peritoneal macrophages. The wide distribution of overall H/L ratios in our spike-in samples was anticipated because a wide distribution was also observed in the published spike-in SILAC experiments (24, 40, 44). Although the distributions of the H/L ratios (RAW264.7/macrophage) in the six spike-in SILAC experiments are rather wide, the distributions of the “ratios of ratios” between the RIP3+/+ and RIP3−/− macrophages revealed by analyzing the overlapping 3715 phosphopeptides are narrowly around Log2 = 0.0, indicating that it is highly reliable to quantitatively compare phosphopeptides between RIP3+/+ and RIP3−/− macrophages using RAW264.7 as a spike-in standard (Fig. 2A).
Fig. 2.

Frequency analysis of H/L ratios. A, Frequency distribution of the quantitative distinct phosphopeptides from the spike-in SILAC experiments according to their nonextreme H/L ratios. The circles show the number of overlapping phosphopeptides. B, Frequency distribution of quantitative distinct phosphopeptides from the canonical SILAC experiment according to their nonextreme H/L ratios.
We compared data from the spike-in SILAC and canonical SILAC experiments. Fig. 3A shows the numbers of distinct peptides, phosphopeptides, and quantitative phosphopeptides with nonextreme ratios detected in different samples with the same amount of starting material. The numbers of distinct peptides and phosphopeptides found in the spike-in SILAC experiments are slightly higher than those of the canonical SILAC experiment; however, the numbers of quantitative phosphopeptides with nonextreme ratios are lower. This is probably because of the difference between the phosphoproteomes of RAW 264.7 and of peritoneal macrophages, as we can see that the percentages of phosphopeptides with extreme ratios in the spike-in SILAC experiments are much greater than that of in the canonical SILAC (Fig. 3B). Because only the overlapping quantitative phosphopeptides are useful in the spike-in SILAC analyses (Fig. 2A), a spike-in experiment should obtain less “real” quantitative phosphopeptides in comparison to a comparable canonical SILAC experiment. Considering the differences in the phosphoproteome between RAW 264.7 cells and macrophages, great care needs to be taken to analyze phosphopeptides with extreme ratios. We accepted a phosphopeptide with an extreme ratio only if it was reproduced in the two replicate experiments. Because the numbers of quantitative phosphopeptides obtained from the spike-in and canonical SILAC experiments were not dramatically different, the disadvantage of spike-in SILAC can be overcome by increasing the amount of starting sample or performing more replicates as discussed by other investigators (40); thus, we concluded that the spike-in SILAC strategy is a suitable approach for studying the phosphoproteome of peritoneal macrophages.
Fig. 3.
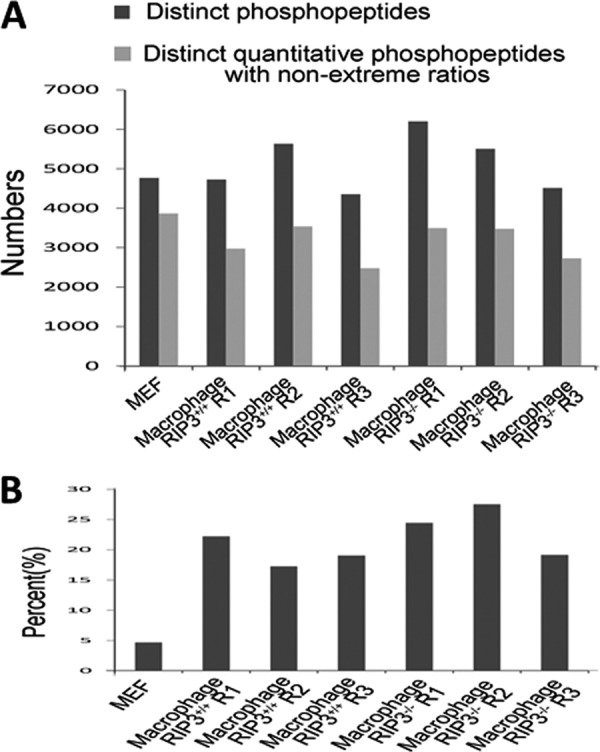
Comparison of SILAC and spike-in SILAC. A, Numbers of distinct peptides, distinct phosphopeptides, and quantitative distinct phosphopeptides with nonextreme ratios in the seven experiments. “Macrophage RIP3+/+ 1” and “Macrophage RIP3+/+ 3” are the samples where RIP3+/+ macrophage proteins were mixed with RAW264.7 proteins in a ratio of 1:1, and “Macrophage RIP3+/+ 2” is the sample where RIP3+/+ macrophage proteins were mixed with RAW264.7 proteins in a ratio of 1:4. The RIP3−/− samples were named in the same way. B, Percent of distinct quantitative phosphopeptides with extreme ratios out of the total distinct phosphopeptides from the samples described in A.
Motif-X Analysis Reveals a Potential Phosphorylation Motif of RIP3
To identify consensus phosphorylation motifs likely to be recognized by RIP3, motifs among the up-regulated serine phosphorylation sites (including phosphopeptides with log2 (RIP3+/+/RIP3−/−)>2 and extreme ratios) were analyzed using Motif-X software. Considering that the phosphorylation sites detected exclusively in RIP3+/+ cells are more likely to be directly recognized by RIP3, phosphopeptides with the extreme ratio of 100 and a log2 (RIP3+/+/RIP3−/−)>2 from MEF cells and macrophages were subjected to Motif-X analysis separately. All motifs enriched are shown in Fig. 4; these motifs could be sites of the phosphorylation carried out by RIP3 or its downstream kinases. pSP, pSXP, SXXpS, and pSXXXXXS were enriched by the phosphopeptides occurring exclusively in RIP3+/+ MEF cells; pSP and pSXP were enriched by the phosphopeptides occurring exclusively in RIP3+/+ macrophage cells. The pSP motif was enriched by the phosphopeptides with a log2 (RIP3+/+/RIP3−/−)>2 in both the MEF and macrophage cells. We compared these motifs to the 175 phosphosite motifs described in the literature (45). Of these motifs, pSP and pSP-like motifs can be recognized by many kinases such as ERK1/2, ERK1/2-like and CDK5 (46), and SXXpS and PXXpS motifs can be recognized by Casein Kinase I and II (47–49). The pSXP motif, in which S is a preferred amino acid in the X position, was novel and enriched in both the MEF and macrophage experiments. It is highly possible that the pSXP motif is a specific site recognized by RIP3. pTSM in MLKL is the only RIP3 phosphorylation site reported so far, which is similar to the pSSP site.
Fig. 4.

Motif-X analysis. Enriched sequence motifs based on Motif-X analysis for the up-regulated phosphopeptides including phosphopeptides with a log2 (RIP3+/+/RIP3−/−)>2 and phosphopeptides exclusively detected in RIP3+/+.
Implications of RIP3-dependent Protein Phosphorylations
To analyze the known information of all up-regulated phosphoproteins (including those phosphopeptides with a log2 (RIP3+/+/RIP3−/−) >2 and exclusively induced in LPS-treated RIP3+/+ macrophages and TNF-stimulated RIP3+/+ MEFs), we submitted the names of these proteins to DAVID for GO enrichment. The 359 RIP3-regulated phosphopeptides from the macrophage were mapped to 321 genes. The 147 RIP3-induced phosphopeptides from the MEF cells were mapped to 134 genes. The top 10 pathways revealed by GO enrichment are presented in Fig. 5A for macrophage and Fig. 5B for MEF. We also analyzed the RIP3-dependent down-regulated phosphoproteins and show the top 10 pathways in supplemental Fig. S7.
Fig. 5.

DAVID analysis of RIP3-dependent up-regulated phosphoproteins. A and B, The top 10 pathways revealed by GO enrichment of the up-regulated phosphoproteins (including those only found in RIP3+/+ cells and those that increased more in RIP3+/+ cells than in RIP3−/− cells) are shown according to their p values in macrophage and in MEF, respectively. C, The RIP3-dependent up-regulated phosphoproteins are listed according to their function in different phases of the cell cycle.
As shown in Fig. 5A and Fig. 5B, the RIP3-dependent phosphoproteins are highly enriched in “cell cycle” pathways in both MEF cells (p = 0.012) and macrophages (p = 2.29E-11). As a control, no cell cycle-related pathways were enriched in supplemental Fig. S7. Almost half of the top 10 pathways in MEF cells, however, are development-related pathways, namely “embryonic development ending in birth or egg hatching” (p = 0.015), “blood vessel morphogenesis” (p = 0.033), and “epithelium development” (p = 0.084). Although many of these top 10 pathways in macrophages, such as the “negative regulation of macromolecule metabolic process” (p = 9.64E-07) and the “DNA metabolic process” pathway (p = 2.72E-04), are related to the metabolism, it appears that RIP3 functions in macrophages and MEFs share some commonality but are also quite different.
Although the RIP3-dependent phosphoproteins are enriched in the cell cycle regulation pathway, to date no experimental data has been reported on the function of RIP3 in cell cycle regulation. Fig. 5C shows the identified cell cycle regulators according to their function in different phases of the cell cycle. The phosphorylations of many of these proteins are exclusively induced in RIP3+/+ but not in RIP3−/− cells. The phosphorylation of S222 on CDCA5 is shown to be caused by CDK1 during mitosis and involed in controling the release of CDCA5 from chromosomes (50). The phosphorylation of MCM2 on serine 27 is proven to be caused by Cdc7/Dbf4 in G1/S transition and coincides with the initiation of DNA replication (51). If RIP3 phosphorylates MCM2 on this site, RIP3 could promote DNA synthesis. It is clear that RIP3 dependent phosphorylation of these cell cycle related proteins has several different functions. Although the phosphorylations of CDCA5 on serine 222 and MCM2 on serine 27 both promote cell cycle progress, RIP3 mediated phosphorylation is not necessary for cell proliferation because the peritoneal macrophages used in our analysis cannot divide. The RIP3-dependent phosphorylation of such a large number of cell cycle regulators in LPS stimulated macrophages is surprising and suggests that the phosphorylation of these cell cycle related proteins may have function(s) other than cell cycle regulation.
CONCLUSION
We used SILAC and spike-in SILAC approaches to investigate RIP3-dependent differences in the global phosphoproteomes of TNF-stimulated MEF cells and LPS-activated macrophages. We showed that the spike-in strategy is suitable for the study of the phosphoproteome of primary nonproliferating cells like peritoneal macrophages. In this study, we identified a large number of potential RIP3 substrates. The hundreds of phosphopeptides that were exclusively identified in RIP3+/+ cells are likely to be direct targets of RIP3 (Table I and Table II). The proteins that were phosphorylated at higher levels in RIP3+/+ cells than in RIP3−/− cells may have been phosphorylated by RIP3 downstream kinases. Phosphorylation of the proteins that exclusively occurred in RIP3−/− cells could be indirect effects of RIP3 deletion. The increased phosphorylation of certain proteins in RIP3−/− cells may also be indirectly related with RIP3. The phosphorylation sites' motif analysis of the phosphopeptides that were exclusively identified in RIP3+/+ cells revealed a novel pSXP sequence that could be a motif of RIP3 phosphorylation. The sites, pSP, SXXpS, SXpS, and PXXpS, revealed by the motif analysis of the phosphopeptides that were increased in RIP3+/+ cells and of the phosphopeptides that were exclusively identified in RIP3+/+ cells, are likely to be targeted by RIP3 downstream kinases because these sites can be phosphorylated by a number of different kinases. Computer assisted analysis of the potential RIP3 substrates indicates that RIP3 can phosphorylate a number of cell cycle regulators in different cell types, and that RIP3 also has cell type dependent functions because many of the potential RIP3 targets in the macrophages and MEF cells are enriched in different pathways. Our phosphoproteomic analysis revealed a large amount of information that offers a basis for the future study of RIP3 mediated protein phosphorylation.
Supplementary Material
Acknowledgments
We thank K. Newton and V. M. Dixit for the RIP3−/− mouse.
Footnotes
* This work was supported by NSF China grants 91029304, 30830092, 30921005, 81061160512, 973 program 2009CB522201, 863 program 2012AA02A201, and 111 Project B12001.
 This article contains supplemental Figs. S1 to S7 and Tables S1 and S2.
1 The abbreviations used are:
- TNF
- tumor necrosis factor-α
- TNFR1
- TNF Receptor 1
- TRADD
- TNFR-associated death domain
- TRAF2
- TNFR-associated factor 2
- cIAP1/2
- inhibitor of apoptosis proteins 1 and 2
- MLKL
- mixed lineage kinase domain-like protein
- PGAM5
- phosphoglycerate mutase family member 5
- iTRAQ
- isobaric tagging for relative and absolute quantitation
- SCX
- strong cation exchange
- HILIC
- hydrophilic interaction liquid chromatography
- DMEM
- Dulbecco's Modified Eagle Medium
- FCS
- fetal calf serum
- LPS
- lipopolysaccharides
- FDR
- false discovery rate.
REFERENCES
- 1. Zhang D. W., Shao J., Lin J., Zhang N., Lu B. J., Lin S. C., Dong M. Q., Han J. (2009) RIP3, an energy metabolism regulator that switches TNF-induced cell death from apoptosis to necrosis. Science 325, 332–336 [DOI] [PubMed] [Google Scholar]
- 2. Cho Y. S., Challa S., Moquin D., Genga R., Ray T. D., Guildford M., Chan F. K. (2009) Phosphorylation-driven assembly of the RIP1-RIP3 complex regulates programmed necrosis and virus-induced inflammation. Cell 137, 1112–1123 [DOI] [PMC free article] [PubMed] [Google Scholar]
- 3. He S., Wang L., Miao L., Wang T., Du F., Zhao L., Wang X. (2009) Receptor interacting protein kinase-3 determines cellular necrotic response to TNF-alpha. Cell 137, 1100–1111 [DOI] [PubMed] [Google Scholar]
- 4. Upton J. W., Kaiser W. J., Mocarski E. S. (2010) Virus inhibition of RIP3-dependent necrosis. Cell Host Microbe 7, 302–313 [DOI] [PMC free article] [PubMed] [Google Scholar]
- 5. Tenev T., Bianchi K., Darding M., Broemer M., Langlais C., Wallberg F., Zachariou A., Lopez J., MacFarlane M., Cain K., Meier P. (2011) The Ripoptosome, a signaling platform that assembles in response to genotoxic stress and loss of IAPs. Mol. Cell. 43, 432–448 [DOI] [PubMed] [Google Scholar]
- 6. Han J., Zhong C. Q., Zhang D. W. (2011) Programmed necrosis: backup to and competitor with apoptosis in the immune system. Nat. Immunol. 12, 1143–1149 [DOI] [PubMed] [Google Scholar]
- 7. Vandenabeele P., Galluzzi L., Vanden Berghe T., Kroemer G. (2010) Molecular mechanisms of necroptosis: an ordered cellular explosion. Nat. Rev. Mol. Cell Biol. 11, 700–714 [DOI] [PubMed] [Google Scholar]
- 8. Feoktistova M., Geserick P., Kellert B., Dimitrova D. P., Langlais C., Hupe M., Cain K., MacFarlane M., Häcker G., Leverkus M. (2011) cIAPs block Ripoptosome formation, a RIP1/caspase-8 containing intracellular cell death complex differentially regulated by cFLIP isoforms. Mol. Cell. 43, 449–463 [DOI] [PMC free article] [PubMed] [Google Scholar]
- 9. Kaiser W. J., Upton J. W., Long A. B., Livingston-Rosanoff D., Daley-Bauer L. P., Hakem R., Caspary T., Mocarski E. S. (2011) RIP3 mediates the embryonic lethality of caspase-8-deficient mice. Nature 471, 368–372 [DOI] [PMC free article] [PubMed] [Google Scholar]
- 10. Oberst A., Dillon C. P., Weinlich R., McCormick L. L., Fitzgerald P., Pop C., Hakem R., Salvesen G. S., Green D. R. (2011) Catalytic activity of the caspase-8-FLIP(L) complex inhibits RIPK3-dependent necrosis. Nature 471, 363–367 [DOI] [PMC free article] [PubMed] [Google Scholar]
- 11. Sun L., Wang H., Wang Z., He S., Chen S., Liao D., Wang L., Yan J., Liu W., Lei X., Wang X. (2012) Mixed lineage kinase domain-like protein mediates necrosis signaling downstream of RIP3 kinase. Cell 148, 213–227 [DOI] [PubMed] [Google Scholar]
- 12. Wang Z., Jiang H., Chen S., Du F., Wang X. (2012) The mitochondrial phosphatase PGAM5 functions at the convergence point of multiple necrotic death pathways. Cell 148, 228–243 [DOI] [PubMed] [Google Scholar]
- 13. Zhao J., Jitkaew S., Cai Z., Choksi S., Li Q., Luo J., Liu Z. G. (2012) Mixed lineage kinase domain-like is a key receptor interacting protein 3 downstream component of TNF-induced necrosis. Proc. Natl. Acad. Sci. U.S.A. 109, 5322–5327 [DOI] [PMC free article] [PubMed] [Google Scholar]
- 14. Grosstessner-Hain K., Hegemann B., Novatchkova M., Rameseder J., Joughin B. A., Hudecz O., Roitinger E., Pichler P., Kraut N., Yaffe M. B., Peters J. M., Mechtler K. (2011) Quantitative phospho-proteomics to investigate the polo-like kinase 1-dependent phospho-proteome. Mol. Cell. Proteomics 10, M111.008540 [DOI] [PMC free article] [PubMed] [Google Scholar]
- 15. Ali N. A., Molloy M. P. (2011) Quantitative phosphoproteomics of transforming growth factor-beta signaling in colon cancer cells. Proteomics 11, 3390–3401 [DOI] [PubMed] [Google Scholar]
- 16. Oppermann F. S., Grundner-Culemann K., Kumar C., Gruss O. J., Jallepalli P. V., Daub H. (2011) Combination of chemical genetics and phosphoproteomics for kinase signaling analysis enables confident identification of cellular downstream targets. Mol. Cell. Proteomics 10, O111.012351 [DOI] [PMC free article] [PubMed] [Google Scholar]
- 17. Huttlin E. L., Jedrychowski M. P., Elias J. E., Goswami T., Rad R., Beausoleil S. A., Villén J., Haas W., Sowa M. E., Gygi S. P. (2010) A tissue-specific atlas of mouse protein phosphorylation and expression. Cell 143, 1174–1189 [DOI] [PMC free article] [PubMed] [Google Scholar]
- 18. Pan C., Olsen J. V., Daub H., Mann M. (2009) Global effects of kinase inhibitors on signaling networks revealed by quantitative phosphoproteomics. Mol. Cell. Proteomics 8, 2796–2808 [DOI] [PMC free article] [PubMed] [Google Scholar]
- 19. McNulty D. E., Annan R. S. (2008) Hydrophilic interaction chromatography reduces the complexity of the phosphoproteome and improves global phosphopeptide isolation and detection. Mol. Cell. Proteomics 7, 971–980 [DOI] [PubMed] [Google Scholar]
- 20. Albuquerque C. P., Smolka M. B., Payne S. H., Bafna V., Eng J., Zhou H. (2008) A multidimensional chromatography technology for in-depth phosphoproteome analysis. Mol. Cell. Proteomics 7, 1389–1396 [DOI] [PMC free article] [PubMed] [Google Scholar]
- 21. Schreiber T. B., Mäusbacher N., Breitkopf S. B., Grundner-Culemann K., Daub H. (2008) Quantitative phosphoproteomics–an emerging key technology in signal-transduction research. Proteomics 8, 4416–4432 [DOI] [PubMed] [Google Scholar]
- 22. Nilsson C. L. (2011) Advances in Quantitative Phosphoproteomics. Anal. Chem. 84, 735–746 [DOI] [PubMed] [Google Scholar]
- 23. Krüger M., Moser M., Ussar S., Thievessen I., Luber C. A., Forner F., Schmidt S., Zanivan S., Fässler R., Mann M. (2008) SILAC mouse for quantitative proteomics uncovers kindlin-3 as an essential factor for red blood cell function. Cell 134, 353–364 [DOI] [PubMed] [Google Scholar]
- 24. Monetti M., Nagaraj N., Sharma K., Mann M. (2011) Large-scale phosphosite quantification in tissues by a spike-in SILAC method. Nat. Methods 8, 655–658 [DOI] [PubMed] [Google Scholar]
- 25. Ishihama Y., Sato T., Tabata T., Miyamoto N., Sagane K., Nagasu T., Oda Y. (2005) Quantitative mouse brain proteomics using culture-derived isotope tags as internal standards. Nat. Biotechnol. 23, 617–621 [DOI] [PubMed] [Google Scholar]
- 26. Newton K., Sun X., Dixit V. M. (2004) Kinase RIP3 is dispensable for normal NF-kappa Bs, signaling by the B-cell and T-cell receptors, tumor necrosis factor receptor 1, and Toll-like receptors 2 and 4. Mol. Cell. Biol. 24, 1464–1469 [DOI] [PMC free article] [PubMed] [Google Scholar]
- 27. Wu X. N., Wang X. K., Wu S. Q., Lu J., Zheng M., Wang Y. H., Zhou H., Zhang H., Han J. (2011) Phosphorylation of Raptor by p38beta participates in arsenite-induced mammalian target of rapamycin complex 1 (mTORC1) activation. J. Biol. Chem. 286, 31501–31511 [DOI] [PMC free article] [PubMed] [Google Scholar]
- 28. Zheng M., Wang Y. H., Wu X. N., Wu S. Q., Lu B. J., Dong M. Q., Zhang H., Sun P., Lin S. C., Guan K. L., Han J. (2011) Inactivation of Rheb by PRAK-mediated phosphorylation is essential for energy-depletion-induced suppression of mTORC1. Nat. Cell. Biol. 13, 263–272 [DOI] [PMC free article] [PubMed] [Google Scholar]
- 29. Wiśniewski J. R., Zougman A., Nagaraj N., Mann M. (2009) Universal sample preparation method for proteome analysis. Nat. Methods 6, 359–362 [DOI] [PubMed] [Google Scholar]
- 30. Ye J., Zhang X., Young C., Zhao X., Hao Q., Cheng L., Jensen O. N. (2010) Optimized IMAC-IMAC protocol for phosphopeptide recovery from complex biological samples. J. Proteome Res. 9, 3561–3573 [DOI] [PubMed] [Google Scholar]
- 31. Andrews G. L., Simons B. L., Young J. B., Hawkridge A. M., Muddiman D. C. (2011) Performance characteristics of a new hybrid quadrupole time-of-flight tandem mass spectrometer (TripleTOF 5600). Anal. Chem. 83, 5442–5446 [DOI] [PMC free article] [PubMed] [Google Scholar]
- 32. Shilov I. V., Seymour S. L., Patel A. A., Loboda A., Tang W. H., Keating S. P., Hunter C. L., Nuwaysir L. M., Schaeffer D. A. (2007) The Paragon Algorithm, a next generation search engine that uses sequence temperature values and feature probabilities to identify peptides from tandem mass spectra. Mol. Cell. Proteomics 6, 1638–1655 [DOI] [PubMed] [Google Scholar]
- 33. Beausoleil S. A., Villén J., Gerber S. A., Rush J., Gygi S. P. (2006) A probability-based approach for high-throughput protein phosphorylation analysis and site localization. Nat. Biotechnol. 24, 1285–1292 [DOI] [PubMed] [Google Scholar]
- 34. Keller A., Nesvizhskii A. I., Kolker E., Aebersold R. (2002) Empirical statistical model to estimate the accuracy of peptide identifications made by MS/MS and database search. Anal. Chem. 74, 5383–5392 [DOI] [PubMed] [Google Scholar]
- 35. Nesvizhskii A. I., Keller A., Kolker E., Aebersold R. (2003) A statistical model for identifying proteins by tandem mass spectrometry. Anal. Chem. 75, 4646–4658 [DOI] [PubMed] [Google Scholar]
- 36. Schwartz D., Gygi S. P. (2005) An iterative statistical approach to the identification of protein phosphorylation motifs from large-scale data sets. Nat. Biotechnol. 23, 1391–1398 [DOI] [PubMed] [Google Scholar]
- 37. Huang da W., Sherman B. T., Lempicki R. A. (2009) Bioinformatics enrichment tools: paths toward the comprehensive functional analysis of large gene lists. Nucleic Acids Res. 37, 1–13 [DOI] [PMC free article] [PubMed] [Google Scholar]
- 38. Huang da W., Sherman B. T., Lempicki R. A. (2009) Systematic and integrative analysis of large gene lists using DAVID bioinformatics resources. Nat. Protoc. 4, 44–57 [DOI] [PubMed] [Google Scholar]
- 39. Geiger T., Cox J., Ostasiewicz P., Wisniewski J. R., Mann M. (2010) Super-SILAC mix for quantitative proteomics of human tumor tissue. Nat. Methods 7, 383–385 [DOI] [PubMed] [Google Scholar]
- 40. Geiger T., Wisniewski J. R., Cox J., Zanivan S., Kruger M., Ishihama Y., Mann M. (2011) Use of stable isotope labeling by amino acids in cell culture as a spike-in standard in quantitative proteomics. Nat. Protoc. 6, 147–157 [DOI] [PubMed] [Google Scholar]
- 41. Hornbeck P. V., Kornhauser J. M., Tkachev S., Zhang B., Skrzypek E., Murray B., Latham V., Sullivan M. (2012) PhosphoSitePlus: a comprehensive resource for investigating the structure and function of experimentally determined post-translational modifications in man and mouse. Nucleic Acids Res. 40, D261–270 [DOI] [PMC free article] [PubMed] [Google Scholar]
- 42. Dinkel H., Chica C., Via A., Gould C. M., Jensen L. J., Gibson T. J., Diella F. (2011) Phospho.ELM: a database of phosphorylation sites–update 2011. Nucleic Acids Res. 39, D261–267 [DOI] [PMC free article] [PubMed] [Google Scholar]
- 43. Mann M. (2006) Functional and quantitative proteomics using SILAC. Nat. Rev. Mol. Cell Biol. 7, 952–958 [DOI] [PubMed] [Google Scholar]
- 44. Geiger T., Wehner A., Schaab C., Cox J., Mann M. (2012) Comparative proteomic analysis of eleven common cell lines reveals ubiquitous but varying expression of most proteins. Mol. Cell. Proteomics. 11, M111.014050 [DOI] [PMC free article] [PubMed] [Google Scholar]
- 45. Amanchy R., Periaswamy B., Mathivanan S., Reddy R., Tattikota S. G., Pandey A. (2007) A curated compendium of phosphorylation motifs. Nat. Biotechnol. 25, 285–286 [DOI] [PubMed] [Google Scholar]
- 46. Songyang Z., Lu K. P., Kwon Y. T., Tsai L. H., Filhol O., Cochet C., Brickey D. A., Soderling T. R., Bartleson C., Graves D. J., DeMaggio A. J., Hoekstra M. F., Blenis J., Hunter T., Cantley L. C. (1996) A structural basis for substrate specificities of protein Ser/Thr kinases: primary sequence preference of casein kinases I and II, NIMA, phosphorylase kinase, calmodulin-dependent kinase II, CDK5, and Erk1. Mol. Cell. Biol. 16, 6486–6493 [DOI] [PMC free article] [PubMed] [Google Scholar]
- 47. Roach P. J. (1991) Multisite and hierarchal protein phosphorylation. J. Biol. Chem. 266, 14139–14142 [PubMed] [Google Scholar]
- 48. Marin O., Bustos V. H., Cesaro L., Meggio F., Pagano M. A., Antonelli M., Allende C. C., Pinna L. A., Allende J. E. (2003) A noncanonical sequence phosphorylated by casein kinase 1 in beta-catenin may play a role in casein kinase 1 targeting of important signaling proteins. Proc. Natl. Acad. Sci. U.S.A. 100, 10193–10200 [DOI] [PMC free article] [PubMed] [Google Scholar]
- 49. Pearson R. B., Kemp B. E. (1991) Protein kinase phosphorylation site sequences and consensus specificity motifs: tabulations. Methods Enzymol. 200, 62–81 [DOI] [PubMed] [Google Scholar]
- 50. Dreier M. R., Bekier M. E., 2nd, Taylor W. R. (2011) Regulation of sororin by Cdk1-mediated phosphorylation. J. Cell Sci. 124, 2976–2987 [DOI] [PMC free article] [PubMed] [Google Scholar]
- 51. Chuang L. C., Teixeira L. K., Wohlschlegel J. A., Henze M., Yates J. R., Méndez J., Reed S. I. (2009) Phosphorylation of Mcm2 by Cdc7 promotes pre-replication complex assembly during cell-cycle re-entry. Mol. Cell 35, 206–216 [DOI] [PMC free article] [PubMed] [Google Scholar]
Associated Data
This section collects any data citations, data availability statements, or supplementary materials included in this article.