

Abstract
Two major populations of myeloid-derived suppressor cells (MDSC), monocytic MDSC (M-MDSC) and polymorphonuclear MDSC (PMN-MDSC) regulate immune responses in cancer and other pathologic conditions. Under physiologic conditions, Ly6ChiLy6G− inflammatory monocytes, which are the normal counterpart of M-MDSC, differentiate into macrophages and dendritic cells (DCs). PMN-MDSC is the predominant group of MDSC that accumulates in cancer. Here we show that a large proportion of M-MDSC in tumor-bearing mice acquired phenotypic, morphological and functional features of PMN-MDSC. Acquisition of this phenotype, but not the functional attributes of PMN-MDSC, was mediated by transcriptional silencing of the retinoblastoma (Rb) gene through epigenetic modifications mediated by histone deacetylase 2 (HDAC-2). These data demonstrate novel mechanism regulation of myeloid cells in cancer.
Myelopoiesis is a tightly regulated hierarchical process of cell lineage commitment. This process is altered in cancer, resulting in the expansion of relatively immature and activated myeloid cells, now termed myeloid-derived suppressor cells (MDSC)1. MDSC negatively regulate immune responses and facilitate tumor metastases and angiogenesis2–4, and have an important contribution in the regulation of immune responses in chronic infectious diseases, sepsis, trauma, autoimmune diseases and transplantation5–10. In mice, MDSC are characterized by the dual expression of Gr-1 and CD11b. The immune suppressive activity of these cells is associated with high levels of arginase, nitric oxide, reactive oxygen species, prostaglandin E2 and cytokines3. MDSC lack markers of mature macrophages and dendritic cells (DCs), and include populations of immature myeloid cells and myeloid progenitors3. It is now established that MDSC are comprised of two groups of cells with monocytic (M-MDSC) and polymorphonuclear (PMN-MDSC) morphology11–14. In mice, M-MDSC have low Gr-1 expression and are CD11b+Ly6ChiLy6G−. M-MDSCs are highly immune-suppressive, exerting their effect largely in an antigen non-specific manner. In naïve mice, this phenotype defines inflammatory monocytes, a subset of migratory monocytes that lack immune suppressive activity15. PMN-MDSCs have high Gr-1 expression and are CD11b+Ly6CloLy6G+. These cells are moderately immune suppressive, primarily via antigen-specific mechanisms. In naïve mice, this phenotype characterizes granulocytes (PMN) with no immune suppressive activity. In cancer, PMN-MDSC could represent a population of pathologically activated precursors of neutrophils16, 17. In cancer patients, M-MDSC are defined as either CD14+HLA-DRlo or CD11b+CD14−CD33+CD15− cells, while PMN-MDSC are defined as CD11b+CD14−CD33+CD15+ cells 18.
M-MDSC and PMN-MDSC differ in their morphology and phenotype. They have different gene expression profiles, activity of transcription factors and utilize different factors to inhibit immune responses2, 19. It is assumed that M-MDSC and PMN-MDSC develop along different pathways involving monocyte/macrophage and granulocyte progenitors, respectively. The accumulation of MDSC is induced by various growth factors (GM-CSF, M-CSF, etc.) and pro-inflammatory cytokines (IL-6, IL-1β, IL-13, etc). Several transcription factors were implicated in MDSC expansion, including STAT3, CEBPα and others19, 20. However, the mechanism preventing MDSC from differentiation to macrophages and DCs remains unclear.
In this study, we investigated the fate of MDSC in tumor-bearing hosts and provide evidence suggesting that, in cancer the normal pathway of monocyte differentiation towards macrophages and DCs is altered to preferential differentiation toward PMN-MDSC. This process is governed by epigenetic silencing of the retinoblastoma (Rb) gene controlled by histone deacetylase 2 (HDAC-2).
Results
Discordant accumulation of MDSC subsets in tumor-bearing hosts
To assess the accumulation of the two major groups of MDSCs, we used previously established phenotypic criteria of PMN-MDSC as CD11b+Ly6G+Ly6Clo cells and M-MDSC as CD11b+Ly6G−Ly6Chi cells (Fig. 1a). In tumor-free mice, the CD11b+Ly6G+Ly6Clo phenotype defines neutrophils (PMN) and CD11b+Ly6G−Ly6Chi -monocytes. The kinetics of MDSC accumulation was evaluated in different transplantable tumor models (EL-4, 4T1, LLC). We found substantial expansion of PMN-MDSC in blood and spleens and a smaller, albeit significant increase of these cells in the bone marrow (BM), which was associated with tumor progression (Fig. 1b and Supplementary Fig. 1a). In contrast, the increase in the proportion of M-MDSC was relatively small. Similar changes in PMN-MDSC and M-MDSC were seen in the absolute numbers of MDSC subsets (Fig. 1c and Supplementary Fig. 1b). To assess MDSC populations in a spontaneous tumor model as well, we used mice with targeted expression of the K-ras oncogene in the lung (K-ras/CC10 mice), which develop lung tumors around 7–8 weeks of age. Only expansion of PMN-MDSC, but nor M-MDSC, was detected in the spleens of 11–12 weeks-old K-ras/CC10 mice (Supplementary Fig. 1c).
Figure 1. MDSC populations in tumor-bearing mice.

(a) Flow cytometry analysis of Ly6C and Ly6G expression after gating on CD11b+ cells in MDSCs from spleen, bone marrow, blood and tumors from EL-4 tumor-bearing mice (left) and Wright-Giemsa staining of PMN-MDSC and M-MDSC sorted from BM of EL-4 tumor-bearing mice. Scale bar: 10 μm. Plots representative of 6 mice and staining representative of 4 mice. (b,c) Percentage (b) and total number (c) of PMN-MDSC and M-MDSC in the bone marrow, blood and spleen of EL-4 tumor-bearing mice followed during 4 weeks after s.c. inoculation of tumor (N – naive mice). Mean ± SD from 4 mice per groups. (d,e) Proliferation of M-MDSC, PMN-MDSC, monocytes (Mon) and PMN in the bone marrow (d) or spleens (e) of naïve and EL-4 tumor-bearing mice, measured by BrdU incorporation 5 or 24 hr after i.p. injection (2 mg/mouse) and gated as in (a) based on expression of CD11b, Ly6C and Ly6G. Percentage of BrdU+ cells is shown in the plots. Results are representative of 3 mice. (f) Total number of cells recovered after 3 and 5 days of culture with GM-CSF and tumor explant supernatants (TES) starting from 2.5×10⁵ PMN, PMN-MDSC, monocytes and M-MDSC sorted from naïve and EL-4 tumor-bearing mice. Mean ± SD from three experiments (each included cells pooled from 2–3 mice) are shown. Dashed lines show the initial number of cells in culture. * p<0.05. (g) Ly6C and Ly6G expression on Gr-1+CD11b+ MDSC cultured with GM-CSF and tumor explant supernatants at the indicated time points. Two experiments with the same results were performed.
To compare the proliferation of PMN-MDSC and M-MDSC and their immediate precursors in vivo, we injected BrdU i.p. into EL-4 tumor bearing mice and measured its incorporation into M-MDSC and PMN-MDSC in BM (Fig. 1d) and spleen (Fig. 1e) cells 5 or 24 h later. As a control, we looked at BrdU incorporation in monocytes and PMN from naïve tumor-free mice. M-MDSC had a 5–6 fold higher level of BrdU incorporation than PMN-MDSC in the BM of EL-4 tumor mice (Fig. 1d). No differences in BrdU uptake were observed between PMN-MDSC from tumor-bearing mice and PMN from naïve mice; M-MDSC from tumor-bearing mice incorporated more than 2-fold more BrdU than monocytes from naïve mice (Fig. 1d). Monocytes and PMN from spleens of naïve mice and PMN-MDSC from spleens of tumor-bearing mice had similar BrdU uptake, whereas M-MDSC incorporated 2–3 fold more (Fig. 1e).
We next investigated GM-CSF-driven expansion16 of sorted populations of BM PMN-MDSC and M-MDSC in vitro, cultured with or without tumor explant supernatants. Total number of recovered cells, as well as cell proliferation, was evaluated. PMN-MDSC and PMN showed no proliferative activity and a rather poor survival in culture. Tumor explant supernatants improved their survival without affecting proliferation. In contrast, M-MDSC proliferated and expanded much better than monocytes or PMN-MDSC (Supplementary Fig. 2 and Fig. 1f). However, the ratio between PMN-MDSCs and M-MDSCs remained largely unchanged in the total population of Gr-1+CD11b+ MDSC in vitro (Fig. 1g). Thus, despite the fact that M-MDSC and their precursors had higher proliferation rate than that of monocytes, their accumulation in tumor-bearing mice was barely detectable. In contrast, the precursors of PMN-MDSC proliferated at similar rates as the PMN, but expanded dramatically in tumor-bearing hosts. In addition, PMN-MDSC represented a large percentage of MDSC during the culture, despite the lack of expansion in vitro and their poor survival, suggesting that the pool of PMN-MDSC may be replenished from M-MDSC.
M-MDSC, but not monocytes, differentiate to PMN-MDSC
We asked whether PMN-MDSC or M-MDSC can differentiate to each other in culture. PMN-MDSC and M-MDSC sorted from the spleen of EL-4 TB mice were cultured for 3 days in GM-CSF. While surviving PMN-MDSC in culture retained their phenotype (CD11b+Ly6CloLy6G+), a more than 30% of cultured M-MDSC down-regulated Ly6C and acquired the expression of Ly6G to become CD11b+Ly6CloLy6G+ cells, a phenotype corresponding to PMN-MDSC (Fig. 2a). To compare the differentiation of monocytes and M-MDSC, CD11b+Ly6ChiLy6G− cells were sorted from BM of naïve and tumor-bearing mice and cultured in vitro with GM-CSF. After 5 days in culture, monocytes differentiated into Gr-1−F4/80+ macrophages or Gr-1−CD11c+ DCs. Less than 10% of the cells expressed Ly6G (Fig. 2b), and very few cells demonstrated polymorphonuclear morphology (Fig. 2c). In contrast, more than 40% of the 5-days cultured M-MDSCs acquired the phenotype (CD11b+Ly6CloLy6G+) and the typical morphology of PMN-MDSC (Fig. 2b,c). Less than 10% of the cells generated from M-MDSC had a DCs phenotype (Gr-1−CD11c+) and only 15% were macrophages (Gr-1−F4/80+) (Fig. 2b). Culture of monocytes with tumor explant supernatants lead to a substantial increase in the generation of Ly6G+ cells (25%) and a decrease in the presence of macrophages (38%) and DCs (12%) (Fig. 2b). Similar results were obtain with BM M-MDSC from K-ras/CC10 TB mice. Almost 50% of cells generated from M-MDSC isolated from these mice expressed Ly6G and had a polymorphonuclear morphology (Supplementary Fig. 3).
Figure 2. Differentiation of PMN-MDSC from M-MDSC in vitro.

(a) Differentiation of sorted PMN-MDSC or M-MDSC during 3 day culture with GM-CSF and tumor explant supernatants. Two experiments with the same results were performed. Each experiment included cells pooled from 2–3 mice. (b–e) Differentiation of sorted M-MDSC and monocytes in vitro. Cells were cultured for 5 days with GM-CSF (monocytes with and without tumor explant supernatants, M-MDSC with tumor explant supernatant). Each experiment included cells pooled from 2–3 mice. (b) The phenotype of gated CD11b+ cells. Three experiments with the same results were performed. (c) Wright-Giemsa staining of the cells. Scale bar: 10 μm. (d) Myeloperoxidase (MPO) activity of sorted M-MDSC and PMN-MDSC after 5-day culture of M-MDSC. Two experiments (each in triplicates) were performed. (**-p<0.01). Control PMN – CD11b+Ly6CloLy6G+ cells were sorted from BM of naive mice (e) ROS level in cells, measured by staining with DCFDA. Three experiments with the same results were performed. (f) Staining of cells differentiated from M-MDSC with naphthol-AS-D chloroacetate esterase. Scale bar: 10 μm. Control Mon - monocytes sorted from BM of naïve mice, Control PMN – PMN sorted from peritoneum after mobilization with casein. (g) Immune suppressive activity of CD11b+Ly6CloLy6G+ PMN-MDSC sorted after 3-day culture of M-MDSC with GM-CSF and tumor explant supernatant. Cells were stimulated with CD3/CD28 antibodies and the number of IFN-γ producing cells was evaluated in triplicates in ELISPOT ** -p<0.01. Two experiments with the same results were performed.
To verify that the Ly6G+ cells generated from M-MDSC were PMN-MDSC, we determined the activity of the granulocyte markers myeloperoxidase (MPO) and naphthol-AS-D chloracetate esterase as well as the production of reactive oxygen species (ROS). Cells generated from M-MDSC after 5 days of culture with tumor explant supernatants were sorted into Ly6G−Ly6Chi M-MDSC and Ly6G+Ly6Clo PMN-MDSC. CD11b+Ly6CloLy6G+ PMN-MDSC had a 4-fold higher activity of MPO (Fig. 2d) and more than a 5-fold higher ROS expression (Fig. 2e) than CD11b+Ly6ChiLy6G− M-MDSC. ROS expression in PMN-MDSC was similar to that of freshly isolated control spleen PMN (Fig. 2e), while the MPO activity of PMN-MDSC was 2 fold lower than in control PMN (Fig. 2d). Polymorphonuclear, but not mononuclear, cells generated from M-MDSC were positive for esterase (Fig. 2f).
We also analyzed in detail the morphology of sorted monocytes and M-MDSC. Both these populations of cells comprised mainly of mononuclear cells with some contamination of cells with cytologic features of promyelocytes. However, promyelocytes were present in equal proportions between freshly isolated monocytes and M-MDSC (data not shown). During 5-day culture, M-MDSC showed a transition from promyelocytes morphology to neutrophils with ringed-shaped nuclei lacking primary granules and later to neutrophils with segmented nuclear lobes. This progression followed the conventional hematopoietic steps of neutrophil differentiation and suggested that PMN-MDSC derive from the promyelocyte population. M-MDSC-derived PMN-MDSC, bone-fide PMN-MDSC freshly isolated from spleens of tumor-bearing mice and PMN from naive mice all have identical morphological features (data not shown). To determine whether PMN-MDSC derived from M-MDSC have immune suppressive activity, CD11b+Ly6CloLy6G+ cells were sorted from 3 day cultures of M-MDSC with GM-CSF with tumor explant supernatants. These cells potently inhibited T cell response (Fig. 2g). We were not able to generate granulocytic cells from F4/80+ tumor-associated macrophage after their culture with GM-CSF and tumor explant supernatants (data not shown).
To evaluate the fate of cells in vivo, sorted congenic CD45.1 BM cells from EL-4 tumor-bearing mice were transferred to CD45.2 EL-4 tumor-bearing recipients and the phenotype of donor cells was evaluated 48 h after the transfer. Consistent with the results of in vitro experiments, surviving PMN-MDSC from CD45.1+ donors retained their phenotype whereas more than 60% of M-MDSC from the CD45.1+ donors acquired the phenotype of PMN-MDSC (Fig. 3a). In addition, we also compared the fate of monocytes and M-MDSC using fluorescently (CMFDA) labeled donor cells. Two days after transfer of fluorescently-label monocytes to naive recipients, very few CMFDA+ donor cells expressed the phenotype typical for PMN (CD11b+Ly6CloLy6G+). In sharp contrast, the majority CMFDA+M-MDSC transferred in tumor-bearing recipients expressed CD11b+Ly6CloLy6G+ markers of PMN-MDSC (Fig. 3b). Similar results were obtained when M-MDSC were transferred to naïve recipients. Within 2 days of transfer, only few M-MDSC became macrophages (Gr-1−F4/80+) or DCs (Gr-1−CD11c+), whereas about 45% of transferred monocytes differentiated into DCs or macrophages in naive mice (Fig. 3b). These data demonstrate that whereas in naïve mice monocytes cannot differentiate to PMN; in tumor-bearing mice M-MDSC can generated cells with CD11b+Ly6CloLy6G+ phenotype of PMN-MDSC in vitro and in vivo.
Figure 3. Differentiation of PMN-MDSC from M-MDSC in vivo.
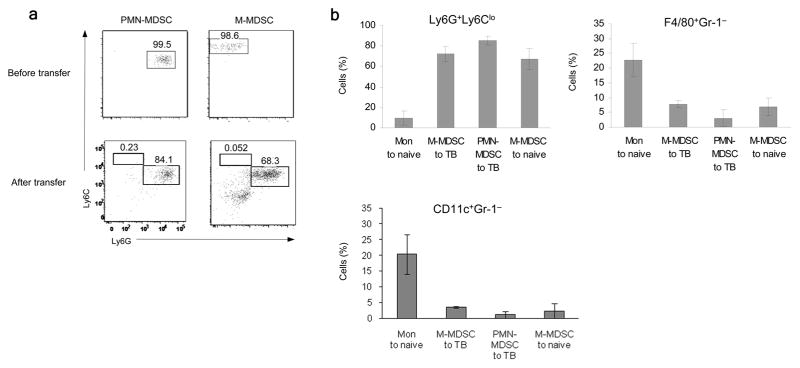
(a) Differentiation of sorted CD45.1+ PMN-MDSC and M-MDSC in vivo in CD45.2+ recipients. 2×10⁷ PMN-MDSC or 5×10⁶ M-MDSC were injected and evaluated 2 days later. A typical example from two performed experiments is shown. Donor’s (CD45.1+) cells were analyzed. (b) Differentiation of sorted and CMFDA labeled PMN-MDSC (2×10⁷), monocytes (Mon) (5×10⁶) or M-MDSC (5×10⁶) two days after transfer to either EL-4 tumor-bearing (TB) or tumor-free (naïve) mice. Cumulative results (Mean ± SD) of 4 experiments are shown. Donor’s (CMFDA+) cells were analyzed. The differences between monocytes and all other groups were statistically significant (p<0.05).
Retinoblastoma protein expression is low in MDSC
To investigate the mechanism that drives monocyte and M-MDSC differentiation we analyzed the gene expression profile of spleen M-MDSC vs. PMN-MDSC. Because we noticed low expression of retinoblastoma (Rb) genes in PMN-MDSC (Supplementary Table 1 and data not shown), we looked more closely at Rb expression in MDSC. Splenocytes isolated from tumor-bearing mice had lower amounts of total and phosphorylated Rb1 than splenocytes from naive mice (Fig. 4a). This decrease correlated with tumor progression and was associated with an increased expression of the transcription factor E2F1 (Fig. 4b), suggesting that Rb1 down-regulation had functional consequences. When splenocytes from EL-4 tumor-bearing mice were separated on Gr-1+ and Gr-1− cells, the Gr-1− cells contained high Rb1, whereas Rb1 was practically undetectable in Gr-1+ cells (Fig. 4c), indicating that the decrease of Rb1 was associated with an accumulation of MDSC in spleens. This was associated with the down-regulation of rb1 gene expression (Fig. 4d).
Figure 4. Expression of Rb in MDSC.

(a) The presence of Rb1 protein in splenocytes from naïve (N) or EL-4 tumor-bearing (TB) mice. (b) The expression of Rb1 and E2F1 in spleens of EL-4 tumor-bearing mice, during tumor progression at 0, 1, 2 or 3 weeks after tumor inoculation. (c) Rb1 expression in Gr1+ and Gr1− cells isolated from the splenocytes of EL-4 tumor-bearing mice. (a–c) Proteins were analyzed by western blot and all experiments were repeated at least twice. (d) The relative expression of rb1 gene in Gr1+ and Gr1− cells, F4/80 macrophages (MΦ), and CD11c+ DCs, isolated from spleen of EL-4 tumor-bearing mice, and measured by qRT-PCR. The values were normalized to β-actin. Each experiment was performed in triplicate and repeated twice. Cumulative mean ± SD are shown. The differences between Gr-1+ and all other populations were statistically significant with p<0.001. (e) Rb1 protein amount in the total population of Gr1+ MDSC, PMN-MDSC and M-MDSC isolated from spleens of EL-4 tumor-bearing mice. PMN were isolated from peritoneum after mobilization by casein; DCs, T-, and B-lymphocytes were isolated from spleens of tumor-free mice. Two experiments were performed. (f) Relative expression of rb1 in M-MDSC and PMN-MDSC isolated from spleens (SPL) or bone marrow (BM) of EL-4 tumor-bearing (TB) mice. Each experiment was performed in triplicate and repeated twice. The differences between M-MDSC and PMN-MDSC was statistically significant with p<0.01. (g) Rb1 expression in PMN, isolated from spleens of tumor-free mice, and PMN-MDSC, isolated from spleens of EL-4 tumor-bearing mice, measured by qRT-PCR. The difference between PMN and PMN-MDSC was statistically significant with p<0.01. (h) The amount of Rb1 protein in PMN, isolated from spleen of tumor-free mice, and PMN-MDSC, isolated from spleen of EL-4 TB mice. (i) Rb1 protein in PMN, isolated from BM of naive mice and PMN-MDSC, isolated from BM of EL-4 tumor-bearing mice, and cultured with GM-CSF for 2 days. Two experiments were performed. (j) Expression of rb1 in sorted M-MDSC and monocytes isolated from BM of tumor-bearing and tumor-free mice. Experiment was performed in triplicate and repeated once. The differences was statistically significant with p<0.05. (k) Rb1 protein level in sorted BM Mon and M-MDSC.
We investigated the expression of Rb1 in two MDSC subsets in spleen. M-MDSC had similar amounts of Rb1 protein as mature myeloid cells (PMN, DCs) or lymphoid cells (T or B lymphocytes), while PMN-MDSC had barely detectable Rb1 protein (Fig. 4e). In cells isolated from either spleen or BM, rb1 mRNA was 3–5 folds higher in M-MDSC than in PMN-MDSC (Fig. 4f). PMN-MDSCs from spleens of tumor-bearing mice had a 3 times lower expression of rb1 mRNA (Fig. 4g) and a substantially lower amount of Rb1 protein (Fig. 4h) than PMN isolated from spleens of naive mice. Freshly isolated BM PMN from naive mice had low amounts of Rb1 protein, similar to that in PMN-MDSC. However, during culture, Rb1 was rapidly up-regulated in PMN, whereas it remained low in PMN-MDSC (Fig. 4i). Thus, in contrast to PMN and other mature myeloid cells, PMN-MDSC failed to up-regulate Rb1 protein after leaving the BM. BM M-MDSC from tumor-bearing mice had significantly lower expression of rb1 mRNA (Fig. 4j) and Rb1 protein (Fig. 4k) than monocytes from naive mice. Thus, PMN-MDSC had much lower amount of Rb1 protein than PMN and M-MDSC had lower amount of Rb1 protein than monocytes.
Rb expression associates with abnormal M-MDSC differentiation
We next asked if Rb1 down-regulation is required for M-MDSC to acquire characteristics of PMN-MDSC. We used immunofluorescent staining to study the pattern of Rb1 expression in M-MDSCs, using splenocytes from Rb1-deficient mice as control (Supplementary Fig. 4). Rb1 expression was lower in BM M-MDSC than in BM monocytes, but also quite heterogeneous in both type of cells (Fig. 5a). To assess the specific role of Rb1 in M-MDSC differentiation, we tried to separate Rb1+ and Rb1− cells. Because direct functional analysis of cells after Rb1 intracellular staining was not possible, we tested if Rb1 expression associates with proliferation of M-MDSC and monocytes by using Hoechst 33342, a dye that allows the vital labeling of dividing cells. M-MDSCs sorted from BM of tumor-bearing mice and monocytes from the BM of naive mice were labeled with Hoechst 33342 after overnight culture with GM-CSF (and tumor explant supernatants in the case of M-MDSC), to decrease the possibility of labeling proliferating precursors cells (Supplementary Fig. 5). The proportion of Hoechstlow cells was slightly higher than Hoechsthigh cells among monocytes, whereas Hoechstlow cells was the predominant population (66%) among M-MDSC (Supplementary Fig. 5). All Hoechstlow M-MDSC were Rb1−, similar to PMN-MDSC, while the all Hoechsthigh M-MDSCs were Rb1+ (Fig. 5b,e). Freshly isolated Hoechstlow monocytes had relatively low expression of Rb1 (albeit higher than M-MDSC; Fig. 5c) and they rapidly up-regulated Rb1 expression during culture. In contrast, Rb1 expression in Hoechstlow M-MDSC remained unchanged (Fig. 5d,e). Thus, Hoechst 33342 labeling was closely associated with Rb1 expression.
Figure 5. Association of Rb1 with subset of M-MDSC.

(a) The staining of sorted BM M-MDSC and monocytes with Rb1-specifc antibody by immunofluorescence (red fluorescence). Nuclei are stained with DAPI (blue fluorescence). Scale bar: 10 μm. Bottom panel – fluorescence intensity from three samples. ** - the statistically significant (p<0.01) differences between groups. (b) The staining of sorted PMN-MDSC, Hoechsthigh and Hoechstlow M-MDSC with Rb1 antibody and counterstained with DAPI. Scale bar: 10 μm. c. Rb1 staining of sorted monocytes from BM of naïve mice. (d,e). Rb1 staining of sorted Hoechstlow Mon or M-MDSC, 48 hr after the culture with GM-CSF. (d) A typical example of staining. Scale bar: 10 μm. (e) Fluorescence intensity calculated from three performed experiments * - the statistically significant (p<0.05) differences from Hoechsthigh cells (positive control). (f) Differentiation of sorted Hoechsthigh and Hoechstlow M-MDSC and monocytes cultured for 4 days with GM-CSF and tumor-explant supernatants (M-MDSC). Three experiments with similar results were performed. Each experiment include cells pooled from 4–5 mice.
We next asked whether Hoechsthigh and Hoechstlow cells differed in their ability to differentiate to myeloid cells. Hoechsthigh and Hoechstlow monocytes differentiated to macrophages and DCs equally well, with few Ly6G+ cells generated from either of these two populations (Fig. 5f). Hoechsthigh M-MDSC showed the same pattern of differentiation as monocytes, whereas the majority of Hoechstlow M-MDSC became Ly6G+, with only 20% of cells differentiating in macrophages or DCs (Fig 5f). Thus, BM M-MDSC from tumor-bearing mice contain a large population of Rb1low cells, which in contrast to Rb1+ M-MDSC and monocytes differentiate predominantly into PMN-MDSC.
M-MDSC differentiate to PMN-MDSC in cancer patients
In human cancer patients, CD11b+CD14−CD33+CD15+ or CD66b+ cells are defined as immune suppressive PMN-MDSC, and CD11b+CD14−CD33+CD15− cells as immune suppressive M-MDSC21–23 (a typical profile is presented in Supplementary Fig. 6). In healthy donors, very few mononuclear cells had a MDSC phenotype, with monocytic cells outnumbering polymorphonuclear cells by a 3:1 ratio (Fig. 6a). In contrast, in patients with pancreatic, lung and head and neck cancers, 10–20% of mononuclear cells classified as MDSCs, with a PMN-MDSC/M-MDSC ratio of more than 5:1 (Fig. 6a). Thus, similar to the results observed in mice, PMN-MDSC were the predominant population of MDSC in patients with various cancers.
Figure 6. PMN-MDSC and M-MDSC in cancer patients.

(a) The Percentages of CD14−CD11b+CD33+CD15+ granulocytic and CD14−CD11b+CD33+CD15− monocytic cells in the fraction of mononuclear cells from healthy donors or from patients with different types of cancer. *** - p<0.001; ** - p<0.01; * - p<0.05. (b) Differentiation of sorted BM CD14+HLA-DR−/low cells from healthy donors and multiple myeloma (MM) patients cultured for 5 days with GM-CSF. Top panel - typical examples of staining. Bottom panel – the result of all performed experiments. * - p<0.05 (c) Wright-Giemsa staining of the cells after 5-day culture of BM M-MDSC from a MM patient. Scale = 10 μm. (d). Proliferation of M-MDSC. BM mononuclear cells from a MM patient were labeled with 10 mM BrdU for 18 hr and stained for surface markers. Two experiments with similar results were performed. (e) RB1 expression (determined by qRT-PCR) in sorted PMN-MDSC and M-MDSC, in three healthy volunteers and 5 renal cell cancer patients,. Each sample was analyzed in triplicate. (f) RB1 expression in PMN-MDSC and PMN from the same renal cell cancer patients determined by qRT-PCR. ** - p<0.01. (g) RB1 expression in sorted BM CD14+HLA-DRhi and CD14+HLA-DR−/low cells from MM patients.
To investigate if human monocytes and M-MDSC differentiate to granulocytic cells, isolated CD14+ monocytes (>80% were HLA-DR+ cells) from BM of healthy donors and patients with multiple myeloma were cultured for five days with GM-CSF in the presence or absence of tumor cells conditioned medium. These cultures did not generate CD66b+ cells (Supplementary Fig. 7), demonstrating lack of granulocytic differentiation. Sorted CD14+HLA-DR−/low cells, which represent M-MDSC in cancer patients24, 25, did not produce CD66b+ cells when isolated from BM of healthy donors (Fig. 6b). In contrast, CD14+HLA-DR−/low cells from the BM of multiple myeloma patients generated around 8% CD66b+ cells (Fig. 6b) and cells with polymorphonuclear morphology were clearly visible in the cultures (Fig. 6c). Consistent with the results obtained in Hoechst labeled M-MSDC in mice, CD14+HLA-DR−/low cells did not proliferate in the culture, as was measured by BrdU incorporation, whereas CD14+HLA-DRhigh cells actively proliferated (Fig. 6d). Small numbers of M-MDSC sorted from the peripheral blood of patients with non-small cell lung cancer and renal cell cancer did not generate cells with a granulocytic phenotype (CD66b+) were generated in culture (data not shown).
We next evaluated the expression of RB1 in PMN-MDSC and M-MDSC isolated from cancer patients. In healthy donor cells, a small number of PMN sorted from the mononuclear fraction had either a similar or higher expression of RB1 as the monocytic cells from the same fraction, while PMN-MDSC from cancer patients had a much lower RB1 expression than M-MDSC (Fig. 6e). Expression of RB1 was significantly lower in PMN-MDSC sorted from the mononuclear fraction than in PMN cells sorted from high density Percoll gradient (standard for PMN isolation; Fig. 6f). CD14+HLA-DRhi cells from the BM of multiple myeloma patients had higher RB1 expression than CD14+HLA-DR−/low cells (Fig. 6g). These data indicate that PMN-MDSC could be generated from M-MDSC in cancer patients and that this process is associated with low RB1 expression.
Rb1 regulates myeloid differentiation in cancer
To evaluate the direct role of Rb1 in regulation of monocyte differentiation we used Rbfl/fl mice crossed with Mx1-Cre mice, in which Rb1 deletion was induced by repeated poly:IC injections in Mx1-Cre+/−Rbfl/fl, using Mx1-Cre−/−Rbfl/fl as controls (Fig. 7a). Consistent with previous observation26, the loss of Rb1 resulted in increased cellularity of spleens in Rb-deficient mice, as compared with wild-type mice (data not shown). The proportion of monocytes in the spleen was similar in Rb1-deficient and wild-type mice, while the proportion of PMN was dramatically increased in Rb-deficient mice (Fig. 7b). When Rb-deficient and wild-type BM sorted monocytes were cultured for 5 days with GM-CSF, only a small proportion of wild-type monocytes became Ly6G+ (Fig. 7c) and acquired a polymorphonuclear morphology (Fig. 7d). In contrast, 20% of monocytes from Rb-deficient mice acquired the phenotype (Ly6G+) and morphology of PMN (Fig. 7c, d). Rb1 deficiency was not sufficient to generate cells with immune suppressive activity. Sorted CD11b+Ly6CloLy6G+ cells from spleens of Rb1-deficient mice failed to inhibit T cell response to CD3+CD28 antibodies (data not shown). However, immunogeneic EG7 tumors (EL4 tumor expressing chicken ovalbumin) grew much faster in Rb1-deficient mice than in wilt-type littermates (Fig. 7e), indicating that in a tumor environment these cells could acquire immune suppressive features and promote tumor growth. However, expansion of granulocytes may affect other cells important for induction of immune responses in Rb1-deficient mice.
Figure 7. Rb and regulation of myeloid differentiation in cancer.

(a) Rb1 protein in splenocytes of wild type (Rb1-WT) Rbfl/flMx1-Cre−/− and knockout (Rb1-KO) Rbfl/flMx1-Cre+/− mice, treated with 3 polyI:C injections. (b). The phenotypes of splenocytes analyzed 8 weeks after polyI:C injections. Four mice were analyzed. (c) Differentiation of monocytes, sorted from BM of Rb1-WT or Rb1-KO mice cultured for 5 days with GM-CSF. The proportion of CD11b+Ly6CloLy6G+ granulocytic cells was analyzed. Each point represents an individual mouse. ** - p<0.01. (d). Wright-Giemsa stain of cells differentiated from monocytes on day 5. Scale bar: 10 μm. (e). Growth of EG7 tumor in Rb1-KO mice and their wild-type (Rb1-WT) littermates after inoculation of 3×10⁶ cells. Tumor growth of individual mice is shown. (f) Differentiation of Hoechstlow M-MDSC after infection with 25 MOI of control Ad-GFP or Ad-Rb1-GFP viruses and 4-day culture with GM-CSF and tumor explant supernatants. Two experiments with similar results were performed. (g) The phenotype of gated GFP negative cells from the experiment described in Fig. 7f.
We then asked whether up-regulation of Rb in M-MDSC affects their differentiation. Hoechstlow M-MDSC isolated from the BM of EL-4 tumor-bearing mice were infected with either adenovirus expressing Rb1 (Ad-Rb1-GFP) or control adenovirus (Ad-GFP) and then cultured for 4 days with GM-CSF and tumor explant supernatants. Rb1 overexpression reduced the proportion of PMN-MDSC (Fig. 7f) and induced a 6-fold increase in the proportion of Gr-1−CD11c+ DCs and almost a two-fold increase in the proportion of Gr-1−F4/80+ macrophages from GFP+ M-MDSC, compared to GFP+ control transduced cells (Fig. 7f). No differences in the proportion of PMN-MDSC were observed among GFP− cells (Fig. 7g). Thus, loss of Rb1 expression is associated with abnormal regulation of myeloid cell differentiation in cancer.
HDAC-2 mediates Rb1 silencing in myeloid cells in cancer
We tested several mechanisms of epigenetic regulation of gene expression and found that inhibition of histone deacetylases (HDAC) with trichostatin A (TSA) up-regulated rb1 expression during differentiation of enriched mixed population of hematopoietic progenitor cells in the presence of tumor explant supernatants (data not shown). Several pan-HDAC inhibitors, such as valproic acid (VPA), suberoylanilide hydroxamic acid (SAHA) and panobinostat (LBH-589) up-regulated the expression of rb1 mRNA and protein in PMN-MDSC isolated from tumor-bearing mice and cultured with tumor explant supernatants (Fig. 8a,b).
Figure 8. The role of HDAC-2 in silencing of Rb1 in MDSC.

(a). Expression of rb1 in PMN-MDSC isolated from spleen of EL-4 tumor-bearing mice and cultured in presence of TES, with or without 1 mM VPA, 6 μM SAHA (1–2 days) or 10 nM LBH-589 (1 day). The relative expression of rb1 was analyzed in triplicate by qRT-PCR. Three experiments were performed. The differences between untreated and treated cells were statistically significant (p<0.05). (b). The amount of Rb1 protein in splenic Gr-1+ and Gr-1− cells isolated from spleens of tumor-bearing mice (left panel) or in Gr-1+ cells cultured for 24 hr with or without 1 mM VPA in the presence of tumor explant supernatants (TES). (c) Differentiation of Hoechstlow M-MDSC from BM of tumor-bearing mice cultured, with or without 1 mM VPA in the presence of GM-CSF and tumor explant supernatants for 24 hr. After that time, the VPA was removed and the cells were cultured for an additional 4 days. Two experiments with the same results were performed. (d). Differentiation of monocytes from BM of Rb KO mice, in the presence of GM-CSF and tumor explant supernatants, with or without 1 mM VPA for 24 hr. After that time, the VPA was removed and cells were cultured for additional 4 days. Two experiments with the same results were performed. (e) ChIP of rb1 promoter with acetylated histone H3 or acetylated histone H4 antibodies in DC and splenic PMN-MDSC cultured overnight, with or without 10 nM LBH 589. The results are expressed as DNA enrichment, normalized to corresponding input values. Each experiment was performed in triplicate 3 times. The differences in PMN-MDSC between LBH 589 treated and not-treated groups were significant (p<0.01) (f). ChIP of rb1 promoter with HDAC-1, -2, -3 or -6 specific antibodies in DC and PMN-MDSC. Each experiment was performed in triplicate 5 times. The differences between DC and PMN-MDSC with HDAC-2 antibody group were significant (p<0.01) (g). ChIP of rb1 promoter performed similar to that described in Fig. 8f with PMN mobilized to peritoneum after casein injection used as a control. Each experiment was performed in triplicate twice. p<0.01 between the groups. (h) Rb1 expression in splenic PMN-MDSC cultured with GM-CSF. Each experiment was performed in triplicates three times. (i). ChIP of rb1 promoter with HDAC-2 antibody in splenic PMN-MDSC cultured for 48 hr with GM-CSF, in the presence of tumor explant supernatants. The mature DCs were used as a control. The differences between PMN-MDSC (0 hr) and all other groups were significant (p<0.01) (j). Rb1 expression in splenic PMN-MDSC transfected with scramble siRNA, or siRNA specific for HDAC-1 or HDAC-2 and cultured for 48 hr. Each experiment was performed in triplicate and repeated twice. * - significant differences from values in scramble siRNA samples (p<0.05).
To address whether HDAC inhibition could affect differentiation of myeloid cells in cancer, Hoechstlow M-MDSC were isolated from BM of tumor-bearing mice and cultured in the presence of GM-CSF and tumor explant supernatants for 24 hr, with and without the HDAC inhibitor VPA, and cells were analyzed four days after VPA removal from culture. The total number of recovered cells was not affected by VPA treatment (data not shown). Consistent with the results described above, in the absence of VPA, a substantial proportion of M-MDSC became Ly6G+. More than 60% of the cells retained expression of Gr-1 and less than 30% of cells were macrophages or DCs (Fig. 8c). VPA treatment of M-MDSC induced a 3-fold smaller (less than 15%) proportion of Ly6G+, while more than 60% of the cells were macrophages and DCs (Fig. 8c). In similar experiments, monocyte isolated from the BM of RB1-deficient mice showed defective differentiation towards macrophages and DCs. More than 50% of the cells retained Gr-1 expression and 25% of cells acquired the Ly6G marker (Fig. 8d). VPA failed to improve the differentiation of Rb1-deficient BM monocytes (Fig. 8d). Thus, even in the presence of tumor explant supernatants, the HDAC inhibitor was able to re-direct M-MDSC differentiation towards macrophages and DCs. This effect was absent in Rb1-deficient cells, suggesting epigenetic regulation of rb1 is important during abnormal myeloid cell differentiation.
We used ChIP assay to investigate the role of HDAC in the silencing of Rb1 gene in PMN-MDSC. Mature DCs were used as a control. Inhibition of HDAC with LBH 589 up-regulated histone acetylation of the rb1 promoter in PMN-MDSC, but not in DCs (Fig. 8e). We found no specific recruitment of HDAC-1, HDAC-3 or HDAC-6 to the rb1 promoter in PMN-MDSC. However, PMN-MDSC had a much higher level of HDAC-2 association with rb1 promoter than DCs (Fig. 8f). In addition, PMN-MDSC had significantly higher level of HDAC-2 association with rb1 promoter than PMN (Fig. 8g). Culture of PMN-MDSC with GM-CSF gradually increased the expression of rb1 (Fig. 8h) and this was associated with the reduction in HDAC-2 association to the rb1 promoter (Fig. 8i). To test if HDAC-2 is involved in silencing rb1 expression in MDSC, we down-regulated HDAC-2 and HDAC-1 in MDSC using siRNA (Supplementary Fig. 8). Down-regulation of HDAC-2, but not HDAC-1, induced significant up-regulation of rb1 expression in MDSC cultured with tumor explant supernatants (Fig. 8j). Thus, it appears that silencing of rb1 expression in MDSC was mediated by HDAC-2.
Discussion
Granulocytic and monocytic cells, although originating from the same common myeloid progenitors, largely develop alongside divergent pathways. The monocytic pathway includes differentiation of monocytes into macrophages and DCs in tissues27. Granulocytic cells include several terminal stages of PMN development28. In tumor-bearing hosts there is a dramatic expansion of myeloid cells with the phenotype and morphology similar to that of inflammatory monocytes and PMN. However, those cells have different biochemical and functional characteristics, which define them as MDSC3. Currently, M-MDSC and PMN-MDSC are believed to differentiate along the same developmental pathways as monocytes and PMN, respectively. Our study provides evidence that this view may not be entirely accurate and proposes that, in tumor-bearing hosts, a large proportion of M-MDSC acquires the ability to differentiate to PMN-MDSC. Monocytes are characterized by high plasticity and known to be able to change the expression of the receptors under various conditions29. Although mature macrophages and PMN are functionally distinct, they have similar transcriptional profiles30. In this study, M-MDSC, in addition to down-regulating Ly6C expression, dramatically up-regulate Ly6G, the marker that is considered specific for granulocytes. Immune suppressive CD11b+Ly6CloLy6G+ cells generated from M-MDSC had typical PMN morphology, were positive for naphthol-AS-D esterase and expressed much higher MPO activity and amount of ROS than CD11b+Ly6ChiLy6G− cells differentiated under the same condition. All these features distinguish PMN from monocytes and argue that cells generated from M-MDSC could be PMN-MDSC.
In contrast to monocytes, M-MDSCs could be enriched for granulocytic progenitors that could expand in vitro or in vivo. However, the lack of Ly6G expression and typical mononuclear morphology in the absence on morphologically identifiable neutrophils made the possibility that M-MDSC could be enriched for non-dividing, late-stage progenitors unlikely. In addition, our data demonstrated that in contrast to late-stage PMN precursors, M-MDSC had very low level of MPO and ROS11. Expression of Ly6Chi by M-MDSC made unlikely the possibility that these cells could be enriched for dividing early progenitors, because high Ly6C expression is not associated with early granulocyte progenitors. Our morphological analysis showed that M-MDSC and monocytes included similar amounts of promyelocytic cells. The fact that PMN-MDSC were generated mostly from non- or poorly proliferating (Hoechstlow) population of M–MDSC further argues against the possibility that PMN progenitors among M-MDSC were responsible for differentiation into PMN-MDSC. Thus, it appears that in cancer M-MDSC probably acquire the ability to differentiate into PMN-MDSC and may represent an important pathway for the accumulation of these cells.
The three members of the Rb family of transcriptional regulators, Rb1, p107 and p130 integrate multiple cellular signals to control cellular proliferation and differentiation31–33. Hypophosphorylated Rb proteins binds to E2F transcription factor(s) and acts as a strong transcriptional repressor34. Rb also promotes terminal differentiation by inducing tissue-specific gene expression. Monocytic differentiation is associated with the hypophosphorylation of Rb35 and the monocytic lineage commitment of human progenitor cells, correlated with high levels of Rb36. In earlier reports the loss of Rb function had no direct effect on the cell cycle of hematopoietic stem cells (HSC), except under stress conditions37, and the loss of Rb was associated with a mild myeloid expansion38. More recently, the genetic inactivation of Rb resulted in a substantial expansion of immature myeloid cells26, 39. Our data indicated that MDSC, especially PMN-MDSC, had reduced amount of Rb1, which was not associated with an increased proliferation of these cells. This was not surprising, because deletion of Rb1 in mice does not necessarily result in an increased proliferation of targeted cells37, 38. The amount of Rb1 in BM monocytes or PMN increased rapidly during culture, while in M-MDSC or PMN-MDSC it remained low. The data obtained from the experiments with Rb1 overexpression in M-MDSC and Rb1 deficient mice, indicate a direct role of Rb1 in regulation of M-MDSC differentiation towards PMN-MDSC. However, the effect was more modest than with tumor-derived factors, which may suggest that other pocket proteins could be involved.
Our data suggested that silencing of Rb could be mediated by HDAC-2, which is known to be involved in modulating the repressive activity of Rb on E2F gene promoters and in the expression of genes involved in differentiation of various cells40. Rb can be associated with class I HDACs (HDAC1–HDAC3)41, 42. Here we show that HDAC-2 can directly interact with rb1 promoter and participate in silencing of rb1 expression. Several transcription factors were previously implicated in Rb-mediated regulation of cell differentiation. Among them, CEBP-β and Id243, 44, 45 can be involved in the regulation of myeloid cell differentiation. The role of these factors in observed effects needs further investigation.
Thus, silencing of Rb expression in monocytes and other myeloid progenitors may be critical in the accumulation of a population of PMN-MDSC. If the specific role of HDAC-2 in this process is confirmed, it may potentially open a new opportunity for the selective therapeutic targeting of these cells in cancer and possibly in other pathologic conditions.
Methods
Mice and tumor models
Female C57BL/6 and Balb/c, mice aged 6–8 weeks, were obtained from the National Cancer Institute (Frederick, MD). Rb1fl/fl mice were also obtained from NCI. Mx1-Cre, and CD45.1+ congenic mice (B6.SJL-PtrcaPep3b/BoyJ) were purchased from Jackson Laboratories. The conditional Rb1 knock-out mice were generated by crossing Rb1fl/fl mice with Mx1-Cre mice to produce Rb1fl/flMx1-Cre+/− mice. Rb1fl/flMx1-Cre−/− littermates were used as controls. To induce the Rb1 deletion, 250 μg poly (I:C) (Invivogene, San Diego, CA) were injected 3 times i.p. every other day. The mice were evaluated 8 weeks after the last poly (I:C) injection. All of the mice were housed in pathogen free conditions, and handled in accordance with the requirements of the Guideline for Animal Experiments. The research was approved by the University of South Florida IACUC. The following subcutaneous tumor models were used: EL-4 thymoma, Lewis Lung Carcinoma (LLC), (both obtained from American Type Culture Collection (ATCC)), and 4T1 mammary carcinoma provided by S. Ostrand-Rosenberg (University of Maryland, Baltimore, MD). The number of tumor cells injected was different for each model, and was selected based on the ability to form tumor with 1.5 cm in diameter within 3 weeks of injection. K-ras/CC10-cre transgenic mice were kindly provided by Dr. Amer Beg (H. Lee Moffitt Cancer Center, Tampa, FL). K-rasfl/fl transgenic mice (Jackson Laboratories) were crossed with CC10-cre mice (obtained from Dr. Wong, Dana-Farber Cancer Institute, Boston, MA). These mice develop tumors in the lung 7–8 weeks after birth46.
Human subjects
Several cohorts of persons with different types of cancer have been evaluated. All patients signed the University of South Florida IRB approved consent forms. The first cohort included 6 patients with advanced head and neck cancer (Stage III and IV) who were undergoing operative intervention for either newly diagnosed or recurrent squamous cell carcinoma of the aerodigestive tract: oral cavity, oropharynx or larynx. The second cohort included 6 subjects who had histologically-confirmed primary pancreatic adenocarcinoma, without radiographic or clinical evidence of metastasis and underwent surgery with intention to cure. Blood samples were taken prior to surgical resection. A third cohort of patients included 11 subjects with previously untreated stage II-IV non-small lung cancer (NSCLC). A fourth cohort of patients included 4 patients with advanced renal cell cancer. As a control, samples of peripheral blood from 7 healthy volunteers were used. BM samples were analyzed in 6 patients with multiple myeloma. As controls we used BM samples from healthy donors purchased from Lonza (Walkersville, MD). All patients were treated at H. Lee Moffitt Cancer Center. Mononuclear cell suspensions were obtained from whole blood using a density gradient centrifugation. The cells were labeled with indicated antibodies and analyzed by multi-color flow cytometry, using an LSRII flow cytometer (BD Biosciences, San Jose, CA). For isolation of PMN the standard protocol was used. Briefly, pellet obtained after centrifugation of peripheral blood on Ficoll gradient was resuspended in PBS and layered over 63%/72% Percoll gradient, and then centrifuged at 1,200 × g for 20 min at room temperature. PMN were collected above the 72% layer.
Reagents
RPMI 1640, DMEM, FBS, recombinant murine GM-CSF and antibiotics were obtained from Invitrogen Life Technologies (Carlsbad, CA). CMFDA (5-chloromethylfluorescein diacetate) was obtained from Invitrogen (Carlsbad, CA). The following antibodies were used for flow cytometry: mouse: CD11b (M1/70, BD Bioscience), Gr-1 (RB6-8C5, BD Bioscience), Ly-6G (1A8, BD Bioscience), Ly-6C (AL-21, BD Bioscience), CD11c (HL3, BD Bioscience), F4/80 (CI:A3-1, Serotec), BrdU Flow Kit (BD Bioscience); human: CD11b (ICRF44, BD Bioscience), CD33 (P67.6, BD Bioscience), CD15 (HI98, BD Bioscience), CD14 (MϕP9, BD Bioscience).
Flow cytometry
The cells were incubated for 30 min, on ice in staining media (1% FBS in PBS), with the relevant antibodies and then washed with PBS. FACS data were acquired using a FACSCalibur or LSR II cytometer (BD Biosciences, San Jose, CA) and were analyzed using FlowJo software (Tree Star, Ashland, OR).
Myeloperoxidase (MPO) activity
The activity of MPO was determined using a fluorescent MPO detection kit (FLMPO 100-3, Cell Technology, Mountain View, CA, USA), according to the manufacturer’s protocol. The fluorescent signal was measured by an Envision 2102 multilabel plate reader (Perkin Elmer, Waltham, MA, USA).
Esterase activity
Esterase activity, of the cells differentiated from M-MDSC, was determined by a naphthol-AS-D/chloroacetate esterase kit (Sigma, St. Louis, MO), according to manufacturer’s protocols.
Immunofluorescence microscopy
The cells were placed on cytospin slides (Cytoslide, Thermo Fisher Scientific, Pittsburgh, PA, USA), fixed with Cytofix Fixation solution (BD Bioscience) for 10 min, washed with PBS, and permeabilized using 0.1% Triton X-100 for 5 min. The cells were washed with PBS, blocked by 1% FBS in PBS, and labeled with mouse antibodies specific for Rb1 (G3-245, BD Biosciences) at a 1:100 dilution for 1 hr. A secondary antibody (anti-mouse IgG, Alexa Fluor 594) was used to label the cells. The slides were washed, dried, and mounted with an antifade mount, containing DAPI, and observed under a Zeiss fluorescence microscope. Fluorescence intensity was quantified using Image-Pro Plus (Media Cybernetics, Bethesda, MD, USA). Briefly, image pixels were ascribed values ranging from 0 (black) to 255 (white) on a 256-value gray scale; and the intensity of red fluorescence/cell was obtained as total gray-scale value, over all of the pixels contained in the area of a single cell. The average value of fluorescence intensity from 50 cells was presented.
Adenovirus infection
Purified M-MDSC, from EL-4 TB mice, were cultured in the presence of 10 ng/ml GM-CSF with 20% TES for 24 hr. The cells were stained with 20 ug/ml Hoechst 33342 (BD Bioscience) and 7-AAD (BD Bioscience) for 30 min and washed with PBS. Hoechstlow M-MDSC were sorted using a BD FACSAria Flow Cytometer and rested for 4 hr. Then, the cells were infected with 25 MOI of Ad-GFP or Ad-Rb1-GFP, in the serum free conditioned medium for 1 hr, and adjusted to 10% FBS and 20% TES culture condition. GM-CSF (10 ng/ml) was supplemented during the culture period. Ad-GFP and Ad-Rb1-GFP were previously described47 and were kindly provided by Dennis J. McCance (Queen’s University Belfast, UK).
siRNA transfection
The cells were mixed with 100 nM ON-TARGETplus SMARTpool HDAC-1, or -2 specific siRNA, or scrambled siRNA (Dharmacon) and transfection was carried out using an Amaxa Nucleofactor Kit (Lonza), according to the manufacturer protocol. After 48 hr, the cells were harvested and rb1 expression was analyzed by qRT-PCR.
qRT-PCR
Total RNA was extracted with a Trizol reagent (Invitrogen), and cDNA was synthesized using the High Capacity cDNA Reverse Transcriptase kit (Applied Biosystems). To detect mouse rb1, PCR was performed with 2 μL of cDNA, 12.5 μL of SYBR Master Mixture (Applied Biosystems) and the following primers: forward-5′-CAG GGC TGT GTT GAC ATC GGA GTA-3′ and reverse-5′-TCC ACG GGA AGG ACA AAT CTG TTC-3′. Amplification of endogenous β-actin was used as an internal control. To detect human Rb1, PCR was performed using the Taqman Universal PCR master mix (Applied Biosystems) and a target gene assay mix containing sequence-specific primers for human Rb1 and 6-carboxyfluorescein dye-labeled Taqman minor groove binder probe (assay ID Hs01078066_m1; Applied Biosystems).
Chromatin Immunoprecipitation (ChIP) assay
CHIP assay was performed using the Acetyl-histone Immunoprecipitation Assay kit (Millipore). Briefly, cells were incubated with 1% formaldehyde for 10 min with gentle agitation. The cross linking of chromatin was stopped by the addition of 0.125 M glycine. Thereafter, sonication was done to shear DNA to an average length of 200–1000 base pairs, followed by centrifugation for 10 min at 13,000 rpm. The samples were pre-cleared, with 50 uL of salmon sperm DNA/Protein A Agarose-50% Slurry for 30 min, and incubated overnight with primary antibody (anti-acetyl H3/H4, anti-HDAC-1, -2, -3 or -6) at 4°C. The immunocomplexes were recovered by adding 60 uL of a salmon sperm DNA/Protein A Agarose-50% Slurry, followed by washing, reverse cross linking with NaCl and DNA recovery by phenol/chloroform extraction and ethanol precipitation. The DNA was amplified by qPCR using the primer specific for rb1 promoter sequence: Forward, 5′-TAC TTG GGT TCG AGT CCT CTG CCA G-3′, reverse, 5′-AGT TGG CCG TGT TCA TGC G-3′.
Statistical analysis
Statistical analysis was performed using a 2-tailed Student t-test and GraphPad Prism 5 software (GraphPad Software Inc.), with significance determined at P < 0.05.
Supplementary Material
Acknowledgments
We thank Dr. A. Beg (H. Lee Moffitt Cancer Center) for providing us with K-ras/mCC10 mice and Dr. D. J. McCance (Queen’s University Belfast, UK) for providing us with Ad-Rb1 vectors. This work was supported by NIH grant CA84488
J.Y. participated in design and performed most of the experiments evaluating MDSC, V.K. and M.C. did most of the experiments assessing Rb1; Y.N., T.C., P.C. performed some of the experiments; A.V. assisted in experiments with HDAC and provided advice; P. H. performed cytological evaluation of the samples; S.A., J.C.M, M.F., A.S., E.S. provided human samples and advice. D.I.G. designed most of the experiments, analyzed the data and together with J.Y., Y.N, and T.C wrote the paper.
References
- 1.Gabrilovich DI, et al. The terminology issue for myeloid-derived suppressor cells. Cancer Res. 2007;67:425. doi: 10.1158/0008-5472.CAN-06-3037. author reply 426. [DOI] [PMC free article] [PubMed] [Google Scholar]
- 2.Gabrilovich DI, Nagaraj S. Myeloid-derived suppressor cells as regulators of the immune system. Nat Rev Immunol. 2009;9:162–174. doi: 10.1038/nri2506. [DOI] [PMC free article] [PubMed] [Google Scholar]
- 3.Gabrilovich DI, Ostrand-Rosenberg S, Bronte V. Coordinated regulation of myeloid cells by tumours. Nat Rev Immunol. 2012;12:253–268. doi: 10.1038/nri3175. [DOI] [PMC free article] [PubMed] [Google Scholar]
- 4.Ostrand-Rosenberg S, Sinha P. Myeloid-derived suppressor cells: linking inflammation and cancer. J Immunol. 2009;182:4499–4506. doi: 10.4049/jimmunol.0802740. [DOI] [PMC free article] [PubMed] [Google Scholar]
- 5.Cuenca AG, et al. A paradoxical role for myeloid-derived suppressor cells in sepsis and trauma. Mol Med. 2012;17:281–292. doi: 10.2119/molmed.2010.00178. [DOI] [PMC free article] [PubMed] [Google Scholar]
- 6.Highfill SL, et al. Bone marrow myeloid-derived suppressor cells (MDSCs) inhibit graft-versus-host disease (GVHD) via an arginase-1-dependent mechanism that is up-regulated by interleukin-13. Blood. 2010;116:5738–5747. doi: 10.1182/blood-2010-06-287839. [DOI] [PMC free article] [PubMed] [Google Scholar]
- 7.Jeisy-Scott V, et al. Increased MDSC accumulation and Th2 biased response to influenza A virus infection in the absence of TLR7 in mice. PloS one. 2011;6:e25242. doi: 10.1371/journal.pone.0025242. [DOI] [PMC free article] [PubMed] [Google Scholar]
- 8.Chen S, Akbar SM, Abe M, Hiasa Y, Onji M. Immunosuppressive functions of hepatic myeloid-derived suppressor cells of normal mice and in a murine model of chronic hepatitis B virus. Clin Exp Immunol. 166:134–142. doi: 10.1111/j.1365-2249.2011.04445.x. [DOI] [PMC free article] [PubMed] [Google Scholar]
- 9.Zhu X, Herrera G, Ochoa JB. Immunosupression and infection after major surgery: a nutritional deficiency. Critical care clinics. 26:491–500. ix. doi: 10.1016/j.ccc.2010.04.004. [DOI] [PubMed] [Google Scholar]
- 10.Sander LE, et al. Hepatic acute-phase proteins control innate immune responses during infection by promoting myeloid-derived suppressor cell function. J Exp Med. 2010;207:1453–1464. doi: 10.1084/jem.20091474. [DOI] [PMC free article] [PubMed] [Google Scholar]
- 11.Youn JI, Nagaraj S, Collazo M, Gabrilovich DI. Subsets of myeloid-derived suppressor cells in tumor-bearing mice. J Immunol. 2008;181:5791–5802. doi: 10.4049/jimmunol.181.8.5791. [DOI] [PMC free article] [PubMed] [Google Scholar]
- 12.Movahedi K, et al. Identification of discrete tumor-induced myeloid-derived suppressor cell subpopulations with distinct T-cell suppressive activity. Blood. 2008;111:4233–4244. doi: 10.1182/blood-2007-07-099226. [DOI] [PubMed] [Google Scholar]
- 13.Dolcetti L, et al. Hierarchy of immunosuppressive strength among myeloid-derived suppressor cell subsets is determined by GM-CSF. Eur J Immunol. 2010;40:22–35. doi: 10.1002/eji.200939903. [DOI] [PubMed] [Google Scholar]
- 14.Peranzoni E, et al. Myeloid-derived suppressor cell heterogeneity and subset definition. Curr Opin Immunol. 2010 doi: 10.1016/j.coi.2010.01.021. [DOI] [PubMed] [Google Scholar]
- 15.Auffray C, Sieweke MH, Geissmann F. Blood monocytes: development, heterogeneity, and relationship with dendritic cells. Annu Rev Immunol. 2009;27:669–692. doi: 10.1146/annurev.immunol.021908.132557. [DOI] [PubMed] [Google Scholar]
- 16.Youn JI, Collazo M, Shalova I, Biswas S, Gabrilovich D. Characterization of the nature of granulocytic myeloid-derived suppressor cells in tumor-bearing mice. J Leukoc Biol. 2012;91:167–181. doi: 10.1189/jlb.0311177. [DOI] [PMC free article] [PubMed] [Google Scholar]
- 17.Brandau S, et al. Myeloid-derived suppressor cells in the peripheral blood of cancer patients contain a subset of immature neutrophils with impaired migratory properties. J Leukoc Biol. 2011;89:311–317. doi: 10.1189/jlb.0310162. [DOI] [PubMed] [Google Scholar]
- 18.Nagaraj S, Gabrilovich DI. Myeloid-derived suppressor cells in human cancer. Cancer journal (Sudbury, Mass. 2010;16:348–353. doi: 10.1097/PPO.0b013e3181eb3358. [DOI] [PubMed] [Google Scholar]
- 19.Sonda N, Chioda M, Zilio S, Simonato F, Bronte V. Transcription factors in myeloid-derived suppressor cell generation. Curr Opin Immunol. 2011 doi: 10.1016/j.coi.2010.12.006. [DOI] [PubMed] [Google Scholar]
- 20.Condamine T, Gabrilovich DI. Molecular mechanisms regulating myeloid-derived suppressor cell differentiation and function. Trends Immunol. 2011;32:19–25. doi: 10.1016/j.it.2010.10.002. [DOI] [PMC free article] [PubMed] [Google Scholar]
- 21.Nagaraj S, et al. Anti-inflammatory triterpenoid blocks immune suppressive function of myeloid-derived suppressor cells and improves immune response in cancer. Clin Cancer Res. 2010;16:1812–1823. doi: 10.1158/1078-0432.CCR-09-3272. [DOI] [PMC free article] [PubMed] [Google Scholar]
- 22.Solito S, et al. A human promyelocytic-like population is responsible for the immune suppression mediated by myeloid-derived suppressor cells. Blood. 2011 doi: 10.1182/blood-2010-12-325753. [DOI] [PMC free article] [PubMed] [Google Scholar]
- 23.Zea AH, et al. Arginase-producing myeloid suppressor cells in renal cell carcinoma patients: a mechanism of tumor evasion. Cancer Res. 2005;65:3044–3048. doi: 10.1158/0008-5472.CAN-04-4505. [DOI] [PubMed] [Google Scholar]
- 24.Filipazzi P, et al. Identification of a new subset of myeloid suppressor cells in peripheral blood of melanoma patients with modulation by a granulocyte-macrophage colony-stimulation factor-based antitumor vaccine. J Clin Oncol. 2007;25:2546–2553. doi: 10.1200/JCO.2006.08.5829. [DOI] [PubMed] [Google Scholar]
- 25.Poschke I, Mougiakakos D, Hansson J, Masucci GV, Kiessling R. Immature immunosuppressive CD14+HLA-DR-/low cells in melanoma patients are Stat3hi and overexpress CD80, CD83, and DC-sign. Cancer Res. 2010;70:4335–4345. doi: 10.1158/0008-5472.CAN-09-3767. [DOI] [PubMed] [Google Scholar]
- 26.Walkley CR, Shea JM, Sims NA, Purton LE, Orkin SH. Rb regulates interactions between hematopoietic stem cells and their bone marrow microenvironment. Cell. 2007;129:1081–1095. doi: 10.1016/j.cell.2007.03.055. [DOI] [PMC free article] [PubMed] [Google Scholar]
- 27.Geissmann F, et al. Development of monocytes, macrophages, and dendritic cells. Science. 2010;327:656–661. doi: 10.1126/science.1178331. [DOI] [PMC free article] [PubMed] [Google Scholar]
- 28.Borregaard N, Cowland JB. Granules of the human neutrophilic polymorphonuclear leukocyte. Blood. 1997;89:3503–3521. [PubMed] [Google Scholar]
- 29.Varol C, et al. Monocytes give rise to mucosal, but not splenic, conventional dendritic cells. J Exp Med. 2007;204:171–180. doi: 10.1084/jem.20061011. [DOI] [PMC free article] [PubMed] [Google Scholar]
- 30.Sasmono RT, et al. Mouse neutrophilic granulocytes express mRNA encoding the macrophage colony-stimulating factor receptor (CSF-1R) as well as many other macrophage-specific transcripts and can transdifferentiate into macrophages in vitro in response to CSF-1. J Leukoc Biol. 2007;82:111–123. doi: 10.1189/jlb.1206713. [DOI] [PubMed] [Google Scholar]
- 31.Burkhart DL, Sage J. Cellular mechanisms of tumour suppression by the retinoblastoma gene. Nat Rev Cancer. 2008;8:671–682. doi: 10.1038/nrc2399. [DOI] [PMC free article] [PubMed] [Google Scholar]
- 32.Giacinti C, Giordano A. RB and cell cycle progression. Oncogene. 2006;25:5220–5227. doi: 10.1038/sj.onc.1209615. [DOI] [PubMed] [Google Scholar]
- 33.Calo E, et al. Rb regulates fate choice and lineage commitment in vivo. Nature. 2010;466:1110–1114. doi: 10.1038/nature09264. [DOI] [PMC free article] [PubMed] [Google Scholar]
- 34.Macleod KF. The role of the RB tumour suppressor pathway in oxidative stress responses in the haematopoietic system. Nat Rev Cancer. 2008;8:769–781. doi: 10.1038/nrc2504. [DOI] [PMC free article] [PubMed] [Google Scholar]
- 35.Traore K, et al. Signal transduction of phorbol 12-myristate 13-acetate (PMA)-induced growth inhibition of human monocytic leukemia THP-1 cells is reactive oxygen dependent. Leuk Res. 2005;29:863–879. doi: 10.1016/j.leukres.2004.12.011. [DOI] [PubMed] [Google Scholar]
- 36.Bergh G, Ehinger M, Olsson I, Jacobsen SE, Gullberg U. Involvement of the retinoblastoma protein in monocytic and neutrophilic lineage commitment of human bone marrow progenitor cells. Blood. 1999;94:1971–1978. [PubMed] [Google Scholar]
- 37.Daria D, et al. The retinoblastoma tumor suppressor is a critical intrinsic regulator for hematopoietic stem and progenitor cells under stress. Blood. 2008;111:1894–1902. doi: 10.1182/blood-2007-02-071746. [DOI] [PMC free article] [PubMed] [Google Scholar]
- 38.Walkley CR, Orkin SH. Rb is dispensable for self-renewal and multilineage differentiation of adult hematopoietic stem cells. Proc Natl Acad Sci U S A. 2006;103:9057–9062. doi: 10.1073/pnas.0603389103. [DOI] [PMC free article] [PubMed] [Google Scholar]
- 39.Viatour P, et al. Hematopoietic stem cell quiescence is maintained by compound contributions of the retinoblastoma gene family. Cell stem cell. 2008;3:416–428. doi: 10.1016/j.stem.2008.07.009. [DOI] [PMC free article] [PubMed] [Google Scholar]
- 40.Fajas L, et al. The retinoblastoma-histone deacetylase 3 complex inhibits PPARgamma and adipocyte differentiation. Developmental cell. 2002;3:903–910. doi: 10.1016/s1534-5807(02)00360-x. [DOI] [PubMed] [Google Scholar]
- 41.Zhang HS, et al. Exit from G1 and S phase of the cell cycle is regulated by repressor complexes containing HDAC-Rb-hSWI/SNF and Rb-hSWI/SNF. Cell. 2000;101:79–89. doi: 10.1016/S0092-8674(00)80625-X. [DOI] [PubMed] [Google Scholar]
- 42.Takaki T, Fukasawa K, Suzuki-Takahashi I, Hirai H. Cdk-mediated phosphorylation of pRB regulates HDAC binding in vitro. Biochem Biophys Res Commun. 2004;316:252–255. doi: 10.1016/j.bbrc.2004.02.044. [DOI] [PubMed] [Google Scholar]
- 43.Fan LX, Li X, Magenheimer B, Calvet JP, Li X. Inhibition of histone deacetylases targets the transcription regulator Id2 to attenuate cystic epithelial cell proliferation. Kidney Int. 2012;81:76–85. doi: 10.1038/ki.2011.296. [DOI] [PMC free article] [PubMed] [Google Scholar]
- 44.Gutsch R, et al. CCAAT/enhancer-binding protein beta inhibits proliferation in monocytic cells by affecting the retinoblastoma protein/E2F/cyclin E pathway but is not directly required for macrophage morphology. J Biol Chem. 2011;286:22716–22729. doi: 10.1074/jbc.M110.152538. [DOI] [PMC free article] [PubMed] [Google Scholar]
- 45.Lasorella A, Rothschild G, Yokota Y, Russell RG, Iavarone A. Id2 mediates tumor initiation, proliferation, and angiogenesis in Rb mutant mice. Mol Cell Biol. 2005;25:3563–3574. doi: 10.1128/MCB.25.9.3563-3574.2005. [DOI] [PMC free article] [PubMed] [Google Scholar]
- 46.Ji H, et al. K-ras activation generates an inflammatory response in lung tumors. Oncogene. 2006;25:2105–2112. doi: 10.1038/sj.onc.1209237. [DOI] [PubMed] [Google Scholar]
- 47.Pickard A, Wong PP, McCance DJ. Acetylation of Rb by PCAF is required for nuclear localization and keratinocyte differentiation. J Cell Sci. 2010;123:3718–3726. doi: 10.1242/jcs.068924. [DOI] [PMC free article] [PubMed] [Google Scholar]
Associated Data
This section collects any data citations, data availability statements, or supplementary materials included in this article.