

Abstract
MicroRNAs (miRNAs) precipitate in many diseases including cardiovascular disease. In contrast to our original thought, miRNAs exist in circulating blood and they are relatively stable due to binding with other materials. The current translational study is to establish a method to determine the absolute amount of a miRNA in blood and to determine the potential applications of circulating cell-free microRNA-1 (miR-1) in acute myocardial infarction (AMI). The results revealed that miR-1 is the most abundant miRNA in the heart and is also a heart and muscle specific miRNA. In a cardiac cell necrosis model induced by Triton-100 in vitro, we found that cardiac miR-1 can be released into cultured medium and is stable at least for 24 h. In a rat model of AMI induced by coronary ligation, we found that serum miR-1 is quickly increased after AMI with the peak at 6h, in which an over 200-fold increased miR-1 was demonstrated. The miR-1 level was returned to basal level at 3 days after AMI. Moreover, the serum miR-1 level in rats with AMI has a strong positive correlation with the myocardial size. To further verify the relationship between myocardial size and miR-1 level, an ischemic preconditioning model was applied. The result showed that ischemic preconditioning significantly reduced the circulating miR-1 and the myocardial size induced by ischemia-reperfusion injury. Finally, the levels of circulating cell-free miR-1 were significantly increased in patients with AMI and had a positive correlation with serum CK-MB levels. The results suggest that serum miR-1 could be a novel sensitive diagnostic biomarker for AMI.
Keywords: Acute myocardial infarction, microRNA, microRNA-1, serum, biomarker, ischemic preconditioning
Introduction
MicroRNAs (miRNAs) are endogenous, noncoding, single-stranded RNAs of ∼22 nucleotides and constitute a novel class of gene regulators [1]. Analogous to the first RNA revolution in the 1980s, when Cech's group discovered the enzymatic activity of RNA, the more recent discoveries of RNAi and miRNA may represent the second RNA revolution [2]. Although the first miRNA, lin-4, was discovered in 1993 [3, 4], their presence in vertebrates was confirmed only in 2001 [5]. Currently, about 800 miRNAs have been cloned and sequenced in humans, and the estimated number of miRNA genes is as high as 1,000 in the human genome [6]. The mature miRNAs bind to the 3′-UTR of their mRNA targets and negatively regulate gene expression via degradation or translational inhibition. Functionally, an individual miRNA is important as a transcription factor because it is able to regulate the expression of its multiple target genes [7]. As a group, miRNAs are estimated to regulate over 30% of the genes in a cell [8]. It is thus not surprising that miRNAs are involved in the regulation of almost all major cellular functions including apoptosis and necrosis. Accordingly, miRNAs may precipitate in many diseases including cardiovascular disease as described in our recent review articles [9, 10].
Tissue- and cell-specific expression is one important characteristic of miRNA expression [11]. Indeed, one miRNA may be highly expressed in one tissue or one cell but has no or low expression in other tissues or other cells. For example, miR-1 is reported to be a muscle or heart specific miRNA [11], whereas miR-145 is a vascular smooth muscle cell specific miRNA as described in our recent article [12]. The tissue specific miRNA expression and tissue expression signatures of diseases have provided a great diagnostic opportunity for diverse diseases [10].
Recent studies have revealed that miRNAs exist in circulating blood. In contrast to our original thought, the cell-free miRNAs are relatively stable due to binding with other materials such as exosomes in circulating blood [13]. Moreover, cancer tissue miRNAs are able to be released into circulating blood and the serum or plasma cell-free miRNAs can be used as novel biomarkers for diverse cancers [13]. However, the quantitative method to measure the absolute amount of a miRNA in blood has not been well-established due to lack of stable control RNAs in blood especially under disease conditions. More importantly, the roles of the circulating-cell free miRNAs in patient with cardiovascular diseases are currently unclear. In the current study, the quantitative method to determine the serum level of miR-1 was established based on quantitative real-time PCR (qRT-PCR) technology. The potential applications of serum miR-1 in acute myocardial infarction (AMI) were also determined by the translational study from cell to animal and human.
Materials and Methods
AMI, ischemic preconditioning (IP), and ischemia-reperfusion injury (I/R) animal models
AMI, IP and I/R in rats were induced by left anterior descending coronary artery (LAD) ligation as described in our recent study [14]. In brief, 10-week-old male Sprague-Dawley rats (weighing 250-300 g) were anesthetized with ketamine (80 mg/kg i.p.) and xylazine (5 mg/kg i.p.). Under sterile conditions, an anterior transmural AMI was created by occlusion of the LAD with a silk suture. Sham-operated rats served as controls. Sham operation involved an identical procedure, except the suture was passed around the vessel without LAD occlusion. IP was achieved via four cycles of 5-min LAD occlusion/5-min reperfusion cycles. I/R was induced in rat hearts via 1h LAD occlusion/3-h reperfusion. The animals were divided into 3 study groups. Group 1 is for the time course study of serum miR-1. In this group, the blood samples were obtained via tail vein from rats before (0 h) and at 1h, 3h, 6h, 12h, 24h, 3 day, 7 day, 14 day, 21 day, and 28 day after AMI. Eight rats were finished the time course study. In addition, 8 sham-opened rats were used as sham control for the study. Group 2 had 12 rats that were used to study the relationship between serum miR-1 and myocardial infract size induced by I/R. Group 3 was used to study the effect of IP on serum miR-1 and myocardial infract size induced by I/R, in which 6 sham-opened rats, 6 I/R rats and 6 IP plus I/R rats were finished the experiment. All protocols were approved by the Institutional Animal Care and Use Committee at the University of Medicine & Dentistry of New Jersey-New Jersey Medical School, and were consistent with the Guide for the Care and Use of Laboratory Animals (National Institutes of Health publication 85-23, revised 1985).
Measurement of infarct size
Myocardial infarct size was determined by pathological staining, which is the golden method for AMI. At the end of experiments, rats were anesthetized and 6 ml of 10% Evans blue dye was injected into the vena cava to define the area that was not supplied by LAD. The myocardial ischemic area at risk (IAR) was identified as the region lacking blue staining. The ventricles of the hearts were sliced transversely into 2-mm thick slices. The slices were incubated in 1% triphenyltetrazolium chloride (TTC) at 37°C for 10 min to identify the noninfarcted and infarcted areas. TTC staining was displayed as red color. The infarcted area was defined as TTC unstained area (write color). Infarct size was expressed as a percentage of the IAR (% IAR) [14].
Blood sample collection, serum miRNA isolation and establishment of the quantitative method for miR-1 assay
Before and at different times after AMI, IP, I/R or sham surgery, the blood samples were collected via tail vein. The samples were placed for 1h at room temperature (26°C) and were centrifuged at 1600g for 20 min at 4°C. Serum samples were carefully transferred into plain propylene tubes and stored at 70°C until miRNA isolation. Serum miRNAs were isolated in 200 μl serum using the solution miRNAs Isolation Kit provided by RNA Bioscience (Short Hills, NJ) according the kit procedures. In brief, miRNAs in serum were first denatured by denaturing Solution (Solution A) and were separated by phase separation solution (Solution B). Then, the samples were processed by precipitation solution (Solution C), washing solution (Solution D) and dissolving solution (Solution E). miR-1 was measured by qRT-PCR with a Roche Lightcycler 480 Detection System using the primer [12]: GTCGTATCCAGTGCGTGTCGTGGAGTCGGCAATTGCACTGGATACGACTACATAC (Applied Biosystems). The same isolation and assay were performed using a series of concentrations of standard miR-1 (synthesized by IDT) to make standard curve. The absolute amount of miR-1 was calculated by software based on serum sample qRT-PCR numbers and the standard curve, and expressed as pmol/L.
miRNA expression signature assay
To verify the specific expression of miR-1 in heart, miRNAs were isolated from rat heart, aorta, lung using mirVana miRNA isolation kit (Ambion, Inc.) and miRNA expression signature was performed by miRNA microarray analysis using a chip containing 341 mature miRNAs (Chip ID miRRat 12.0 version; LC Sciences) as described in our recent studies [15-17]. In addition, the miRNAs in rat heart, aorta, lung, liver, brain, small intestine, and kidney were also isolated for miR-1 assay.
Cell culture
Primary cultures of neonatal rat cardiac ventricular myocytes were performed as described [14, 18]. In brief, the hearts from 1- to 2-day-old Sprague-Dawley rats were removed after hypothermia anesthesia immersion in ice water and placed in ice-cold 1× phosphate-buffered saline solution. After repeated rinsing, the atria were cut off, and the ventricles were minced with scissors. The minced tissue and ventricular cells were dispersed by digestion with collagenase type IV (0.45 mg/ml), 0.1% trypsin, and 15 μg/ml DNase I. Cardiomyocytes (0.33 × 10⁶ cells/ml) were cultured in the cardiac myocyte culture medium containing Dulbecco's modified Eagle's medium supplemented with 10% serum, 4 μg/ml transferrin, 0.7 ng/ml sodium selenite, 2 g/L bovine serum albumin (fraction V), 3 mmol/L pyruvic acid, 15 mmol/L HEPES, 100 μmol/L ascorbic acid, 100 μg/ml ampicillin, 5 μg/ml linoleic acid, 1% penicillin and 1% streptomycin, and 100 μmol/L 5-bromo-2′-deoxyuridine, and seeded into six-well plates.
Necrosis model of cultured cardiac myocytes and miR-1 release assay
Necrosis model of cultured cardiac myocytes was induced by Triton X-100 as described [19]. Briefly, rat cardiac myocytes in 6 well plates cultured with 10% serum were washed 3 times with 0.01 M PBS to remove medium and serum. Then, the cells were treated for 20 min at room temperature with different concentration of Triton X-100 (0.25, 1, and 2%) diluted in 0.1% sodium citrate. As a negative control, the cells were incubated with PBS alone (Vehicle). After treatments, the culture supernatant from each well was collected for miR-1 assay. In addition, in 2% Triton X-100-treated group, the supernatants were kept at 37°C for 6, 12 and 24 h for the stability assay of miR-1.
Clinical study
AMI was defined as 1) chest pain characteristic of myocardial ischemia for 30 minutes or more, 2) ST segment elevation within 6 hours of chest pain at least 0.1 mV in at least two leads of the ECG., and 3) confirmation of the diagnosis of AMI by elevated by creatine kinase-MB isoenzyme (CK-MB) in serum which was at least twice the normal range. The blood samples from patients without the confirmation of AMI were not used in this study. In total, thirty-one patients with AMI were used in this study (18 men, 13 women; mean age 57 +/- 10.1, range 45 to 71 years). Twenty of them had coronary angiography data showing at least one vessel disease. Among the patients studied, 11 had hypertension with antihypertetive medicines, Ang II inhibitor and/or beta-blocker; 8 patients had hyperlipidemia with simvastatin therapy. No patients with diabetes were included in this study. Blood samples were obtained within 24 h 24h of AMI. The time interval between the onset of typical chest pain and blood samples was 8.5±3.82 h. Blood samples obtained from age and sex matched 20 healthy volunteers were used as the controls. The protocol was approved by the Institutional Review Board at Guangdong Provincial People's Hospital. All the blood samples were placed at 1h at room temperature (26°C) and were centrifuged at 1600g for 20 min at 4°C. Serum miR-1 levels were determined as described above. CK-MB was determined by immunoinhibition assay method (Roche Diagnostics, normal range 0-25 U/L).
Statistics
All data is presented as mean ± standard error. For relative gene expression, the mean value of the vehicle control group was defined as 100% or 1. Two-tailed unpaired Student's t tests and ANOVA were used for statistical evaluation of the data. Linear regression analysis was used to determine the relationship between myocardial infarct size and serum miR-1, and the relationship between serum CK-MB and serum miR-1. Sigma stat statistical analysis program was used for data analysis. A p value < 0.05 was considered significant.
Results
miR-1 is the heart selective miRNA and is also the most abundant miRNA in normal rat heart
The Microarray analysis of miRNAs in heart revealed that miR-1 is the most abundant miRNA in normal rat heart. However, the expression of miR-1 in aorta and lung samples was almost undetectable. The average microarray signal of miR-1 in heart was 51,191.30, whereas in lung and aorta the signals were only 62.12 and 31.23 separately. To further verify the heart selectivity of miR-1 expression, miR-1 levels in rat liver, brain, small intestine, and kidney were determined by qRT-PCR. No significant miR-1 expression was found in these tissues. The results were consistent with recent reports from other research groups [20-22].
miR-1 is able to be released by necrotic cardiac myocytes in vitro
As shown in Figure 1A, the necrosis of cardiac myocytes was induced by Triton X-100. Accordingly, miR-1 was released into cultured medium (Figure 1B) at 20 min after treatment with Triton X-100. The amount of miR-1 release was related to the number of necrotic cardiac myocytes, as the increased miR-1 levels were found with the increasing concentration of Triton X-100 (Figure 1B). Moreover, the released miR-1 is stable in cultured solution at least for 24 h as shown in Figure 1C.
Figure 1. miR-1 is able to be released by necrotic cardiac myocytes in vitro.
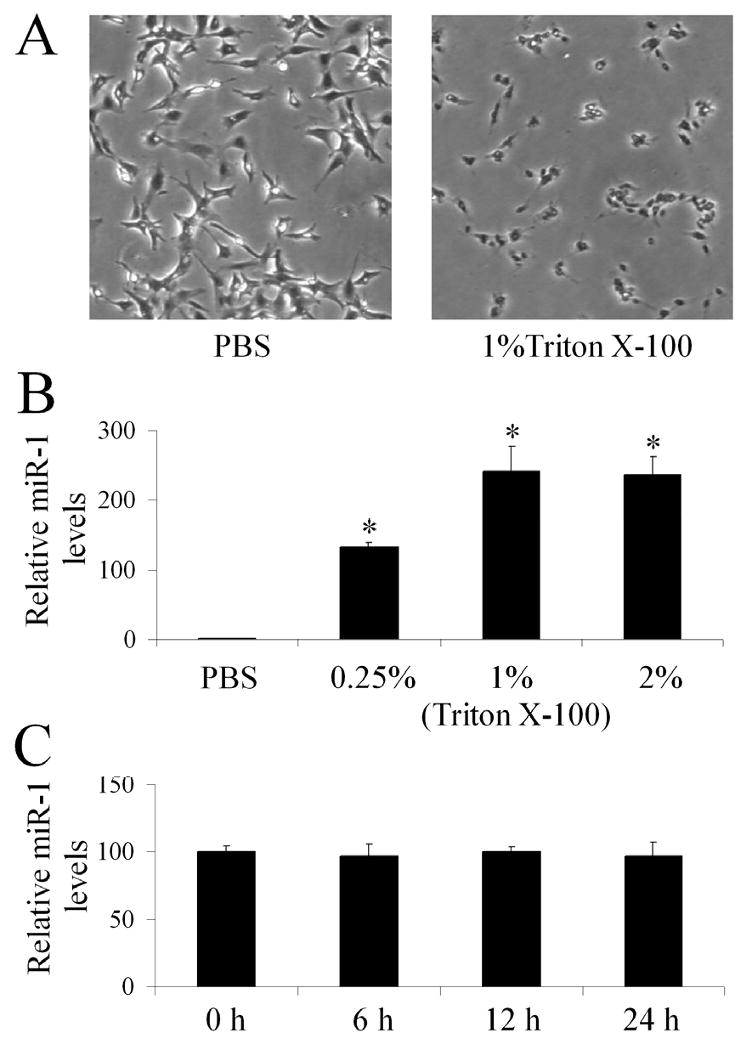
(A) Representative images from vehicle (PBS) or Triton X-100-treated cardiac cells. (B) The relative levels of miR-1 in culture medium of rat cardiac cells treated with vehicle (PBS) or different concentrations of Triton X-100 for 20 min determined by qRT-PCR. Note: The miR-1 level in vehicle-treated group is expressed as 1. n=6; *P<0.05 compared with PBS control. (C) The stability assay of miR-1 in cultured medium. The cardiac cells were treated 2% Triton X-100 for 20 min. Then, the cultured medium was collected and was kept at 37°C up to 24 h. The miR-1 levels were determined by qRT-PCR at 0, 6, 12 and 24 h after medium collection. Note: n=6.
Establish of the quantitative method for miR-1 assay in blood
The linear range was determined by analysis of synthesized standard miR-1, normal rat serum miR-1 and serum miR-1-1 from rats with AMI. CT values of the standard curve were plotted against the logarithmic concentration of the serial dilutions of the isolated miR-1.The amplification chart of different concentrations of miR-1 was displayed in Figure 2A.The representative standard curve of these assays was shown in Figure 2B. The assay showed linearity over a range of 0.01 to 10 pmol/L miR-1. There was a correlation coefficient of the analysis (R2=0.99) and efficient amplification (slope=-3.4573) for all the experiments (Figure 2B).
Figure 2. Establish of the quantitative method for serum miR-1 assay.
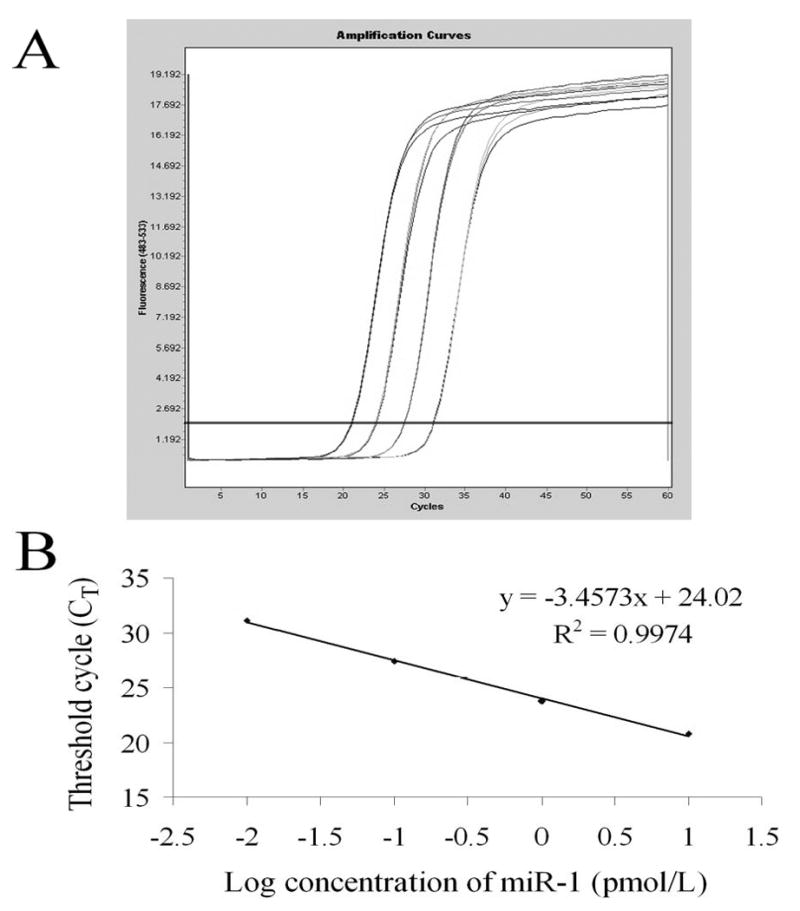
(A) Amplification chart of different concentrations of miR-1. (B) Standard curve of the miR-1 concentration in serial dilutions vs. cycle number (CT). Each dot represents the result of triplicate PCR amplification for each dilution.
Serum miR-1 is a novel biomarker for AMI
As shown in Figure 3A, AMI was induced by LAD ligation as demonstrated by pathological method. In normal serum (sham group), the miR-1 level was pretty low and can be barely detected by high sensitive qRT-PCR (0.016±0.008 pmol/L). Interestingly, serum miR-1 level was significantly increased to 3.67 pmol/L in rats at 6 h after AMI (Figure 3C). To determine the time course changes of miR-1 after AMI, the serum miR-1 levels were determined at before (0h), and at 1h, 3h, 6h, 12h, 24h, 3 day, 7 day, 14 day, 21 day, and 28 day after AMI in 8 rats. As shown in Figure 3B & 3C, compared with normal controls (sham and 0h groups), the serum miR-1 levels were quickly increased with peak at 6h after AMI, in which over 200-fold increase in miR-1 level was demonstrated. At 3 days after AMI, the serum miR-1 level was return to basal level.
Figure 3. Circulating cell-free miR-1 in rats with or without acute myocardial infarction (AMI).
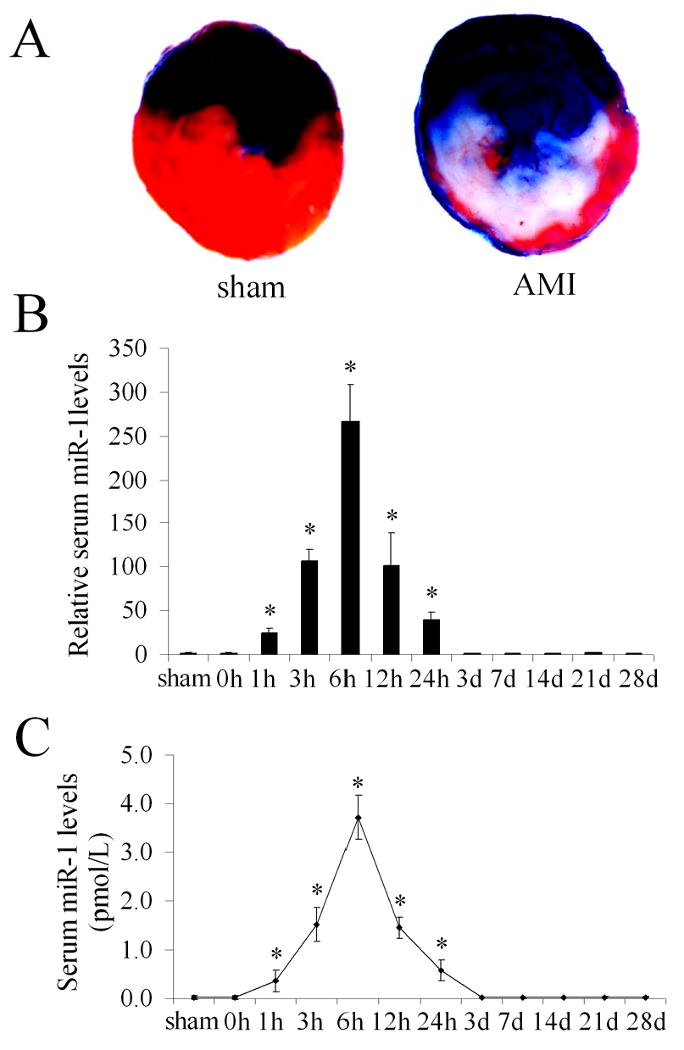
(A) Myocardial infarction in rat heart was induced by left anterior descending coronary artery ligation and the infarct size was determined by pathological staining in heart slices. Note: Color blue is Evans blue staining. The region without Evans blue staining is myocardial ischemic area at risk (IAR). Color red is the triphenyltetrazolium chloride (TTC) staining. TTC unstained area within IAR was the infarcted area. Infarct size is expressed as a percentage of the IAR (% IAR). (B) The relative serum miR-1 levels in 8 sham-opened control rats, and in 8 rats before (0 h) and at different time points after AMI. Note: the mean value of serum miR-1 before AMI was expressed as 1. n=8, *P<0.05 compared with the group before AMI (0 h). (C) The absolute amount of serum miR-1 sham-opened control rats, and in rats before (0 h) and at different time points after AMI. Note: n=8, *P<0.05 compared with the group before AMI.
Serum miR-1 levels are associated with the myocardial infarct sizes
To determine the relationship between serum miR-1 levels and myocardial infarct sizes, the infarct sizes induced by I/R and serum miR-1 levels were determined in 12 rats. As shown in Figure 4, a strong positive correlation was demonstrated between the two variables (r=0.88; p<0.05).
Figure 4. The relationship between serum miR-1 levels and myocardial infarct sizes in rats with AMI.
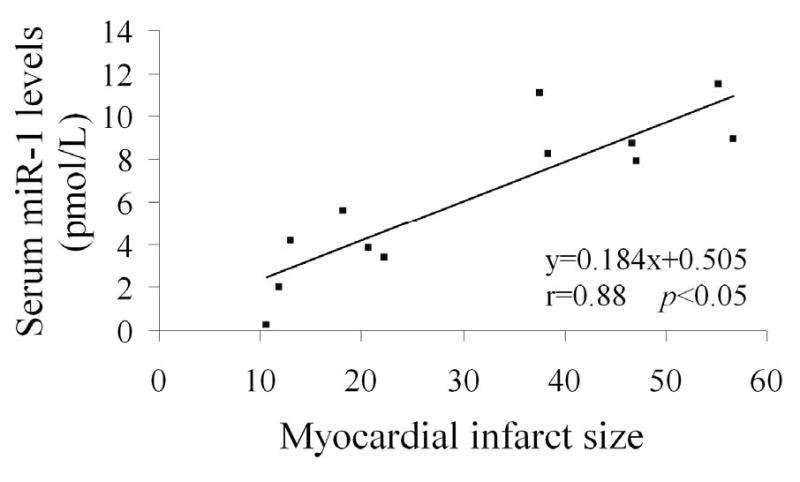
AMI was induced by I/R in 12 rats, the infarct sizes and serum miR-1 levels were determined in rats at 3 h after reperfusion. Note: n=12; a strong positive correlation was demonstrated between the two variables (r=0.88; p<0.05).
IP reduces myocardial infarct size and serum miR-1 level
To further determine the relationship between serum miR-1 level and myocardial infarct size, IP was applied in rat hearts with I/R. As shown in Figure 5A & 5B, AMI was induced by I/R. Accordingly, serum miR-1 level was significantly increased in rats with I/R (Figure 5C). Obviously, the myocardial infarct size was significantly reduced by IP (Figure 5A & 5B). Interestingly, the serum miR-1 induced by I/R was also inhibited by IP (Figure 5C).
Figure 5. Ischemic preconditioning (IP) reduces myocardial infarct size and serum miR-1 level.
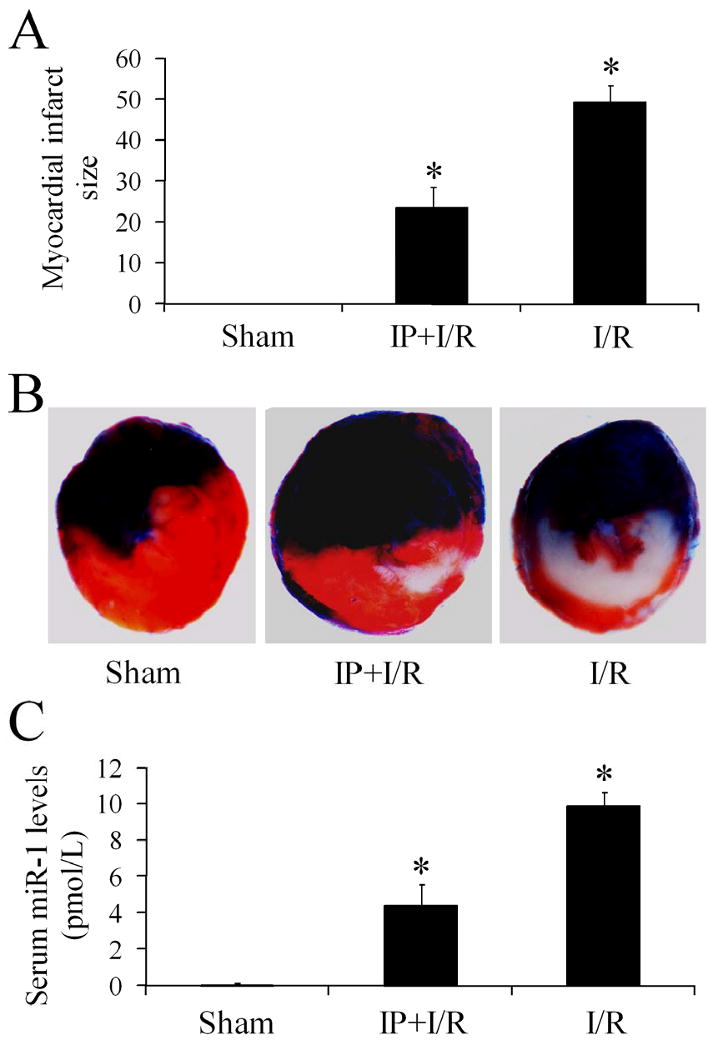
(A) Myocardial infarct size induced by ischemia-reperfusion injury (I/R) was reduced by IP. Note: n=6; *P<0.05 compared with I/R group. (B) Representative heart slice images from rats in sham-opened group, IP and I/R group, and I/R group. Note: Color blue is Evans blue staining. The region without Evans blue staining is myocardial ischemic area at risk (IAR). Red color was the triphenyltetrazolium chloride (TTC) staining. TTC unstained area within IAR is the infarcted area. (C) The increased serum miR-1 induced by I/R isinhibited by IP. Note: n=6; *P<0.05 compared with I/R group.
Serum miR-1 is significantly increased in patients with AMI
As shown in Figure 6A, the serum miR-1 levels from 31 patients within 24h of AMI were significantly increased compared with normal controls. Among them, a nearly 100-fold increase in serum miR-1 was found in patients at 6h after AMI. The release of miR-1 into the circulation was very quick, because the increase in serum miR-1 was found in patients within hours. No increase in serum miR-1 levels was found in patients at 3 and 7 days after AMI (Data not shown). To investigate the potential relationship between serum miR-1 levels and myocardial sizes in human, CK-MB in these patients were also determined. As shown in Figure 5B, a positive correlation was demonstrated between serum miR-1 and CK-MB levels (r=0.68; p<0.05).
Figure 6. Serum miR-1 is increased in patients with AMI.
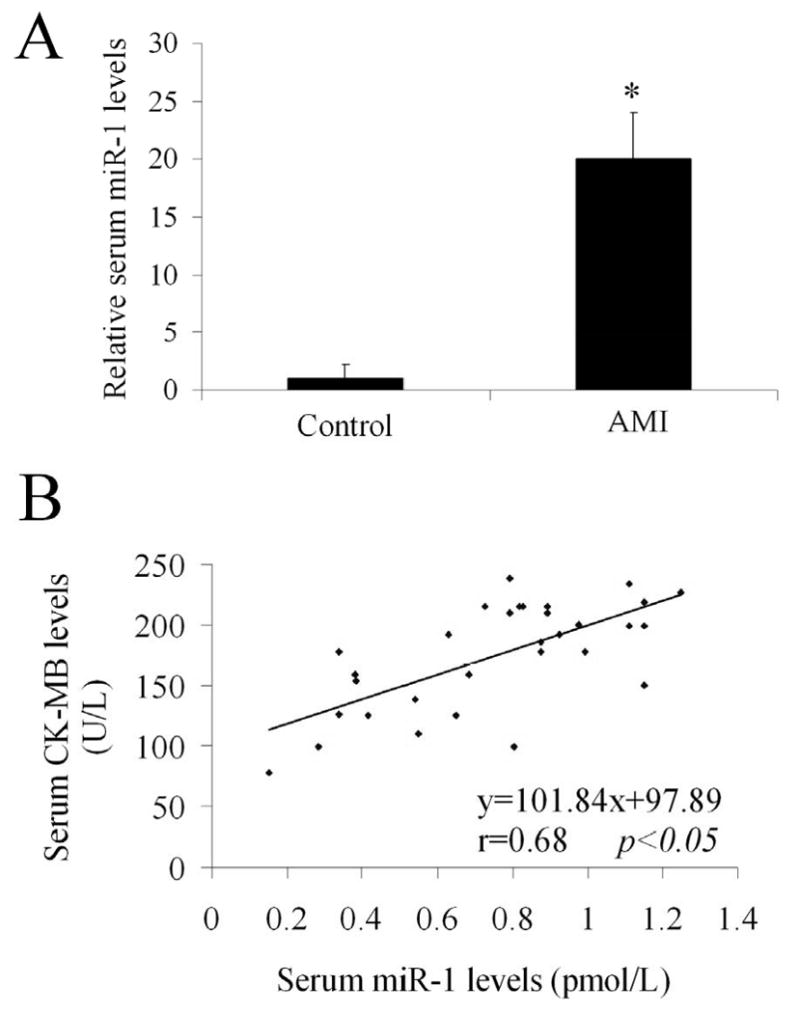
(A)The serum miR-1 levels were determined from patients within 24h of AMI. The serum from age matched normal controls was used as the control group. Note: n=31 in AMI group and n=20 in control group; P< 0.05 compared with the control group. (B) The relationship between serum miR-1 levels and CK-MB levels in patients. Note: n=31; a positive correlation was demonstrated between the two variables (r=0.68; p<0.05).
Discussion
Recent studies have revealed that miRNAs are critical regulators in the pathogenesis of many diseases including disorders in cardiovascular system [9, 10]. The tissue- and cell-specific expression of miRNAs indicates that miRNAs may be used as biomarkers for tissue and cell identification. Moreover, different diseases have different expression profiles of miRNAs [10]. The unique tissue miRNA expression signatures provide novel diagnostic tools for diseases as it is well demonstrated in cancer studies [23]. However, the diseased tissues are often difficult to obtain under most disease conditions such as cardiovascular disease. The fortunate part out of the misfortune is that miRNAs are able to be released into circulating blood from tissue [13]. More important, recent reports revealed that the circulating miRNAs released from tissue are stable due to binding with other materials [24]. The circulating cell-free miRNAs could be used as novel biomarkers for diverse cancers [25]. In this respect, miRNAs in the peripheral blood have been proven to be useful biomarkers for diseases such as cancer [26] and liver injury [27].
miRNAs are highly expressed in cardiovascular system. Moreover, recent studies including those from us revealed that miRNA expression in cardiovascular system may also be tissue and cell-specific [15, 16]. For example, miR-145 is selective expressed in vascular smooth muscle cells, but has no or very low expression in endothelial cells [12]. In the current studies, using microarray analysis and qRT-PCR, we identified that miR-1 is the most abundant miRNA in heart and it is a heart specific miRNA. In addition, recent studies have demonstrated that cardiac tissue miR-1 is involved in the pathogenesis of cardiac diseases such as cardiac hypertrophy, heart failure [28, 29] and AMI [30, 31]. However, whether the cardiac miR-1 can be released into circulating under AMI is currently unclear.
Establishment of a method to determine the absolute amount of a miRNA in blood is the prerequisite for blood miRNA study. Unlike tissue which has many good markers such as U6 for normalization and calculating the amount of tissue miRNAs, the blood lacks of this kind of internal controls for miRNA normalization. Although there are some reports to use some RNAs such as 18S, 5S, snoRNA U38B, snoRNA U43, snRNA U6 and other miRNAs as the internal controls for normalization, the levels of these control makers can often be changed especially under pathological conditions. After several years of hard work targeting the critical drawback in blood miRNA array, we have identified that using the serum (plasma or blood) volume as normalization (pmol/L) is the best method to determine the levels of miRNAs in blood. The amount of molecules per ml or per L serum (plasma or blood) is also the standard method to evaluate blood levels for other molecules in clinics. As described in the section of materials and methods in this article, we developed the method to determine the absolute amount of a miRNA for the circulating cell-free miR-1 based on the qRT-PCR technology. Our unpublished data also revealed that it is also suitable for other miRNA measurement in solutions such as serum or culture medium.
In the current study, we first performed the in vitro study to determine whether the damaged cardiac cell can release miR-1 into the culture medium and whether the released miR-1 is stable in cultured solution. The results showed that cardiac miR-1 is able to be released into the cultured solution and the released amount of miR-1 is associated with the extent of cardiac cell damage. Moreover, the released miR-1 is stable in the cultured solution at least for 24 h.
Although there is only trace amounts of miR-1 in normal rat and human serum, it can still be detectable by using high sensitive qRT-PCR technology. We hypothesized that the very low level of miR-1 may represent a novel metabolism pathway of miRNAs. It is reported that miRNAs are able to be packaged onto exosomes within the cells [24]. These miRNA-packaged exosomes are able to be released into circulating blood [24]. As the miR-1 is the most abundant miRNA in normal heart, the trace amount of miR-1 released into circulating blood under physiological conditions may be responsible for the low basal serum level of miR-1. However, after AMI, the rat serum miR-1 levels were quickly increased. The increased serum miR-1 can reach as high as 200-fold increase which occurred at 6 h after AMI. The time course study revealed that at 3 days after AMI, the levels of miR-1 returned to the basal level. In addition, the levels of serum miR-1 had a strong positive correlation with the myocardial infarct sizes. The relationship between serum miR-1 and myocardial infarct sizes was further verified by using a well established IP model. The results suggested that serum miR-1 is a novel early sensitive biomarker for AMI.
Stability is important for a circulating disease biomarker. We found that incubation of serum at room temperature for up to 4 h, or subjecting it to up to several cycles of freeze-thawing had no significant effect on endogenous miR-1 level, although the serum contain high levels of RNase activity. The observation is consistent with recent reports [13, 32]. Thus, serum miR-1 is a stable biomarker. The reasons why miRNAs are stable in blood are still not completely clear. However, binding with other materials either in blood or in released cells such as exosomes may be one of the critical reasons [24]. Indeed, in contrast to the endogenous binding miR-1, we found that exogenous added mature miR-1 the serum both in vitro and in vivo was quickly degraded (Data not shown).
Finally, in the clinical study, we found that serum miR-1 in patients with AMI was also quickly increased within hours. In patients within 24 h of AMI, There is an over 20-fold increase in miR-1 serum level. In addition, there is a positive relationship between serum miR-1 and CK-MB. The result suggested that serum miR-1 may also be related to myocardial size in humans. In addition, based on the animal study, the time course change of miR-1 is similar to that of CK-MB in AMI, but is different from that of TnT. In patients at 3 and 7 days after AMI, the serum level was returned to the basal level (Data not shown). Thus, miR-1 is an early biomarker for AMI.
There are some limitations in this study. First, the quantitative PCR to measure miR-1 in the serum takes longer than the method to determine CK-MB or troponin (TnT or TnI), and do not allow for easy and rapid detection of microRNAs for clinical routine. However, the development of high sensitive, quick assay of RNA is a very hot research area. In fact, the progress has been made such as fluoresce and ELISA methods in RNA array. The breakthrough in the research area may overcome the pitfall in the future. The second limitation is that there were only 31 patients in the clinical study. The patients were not enough to determine the time course changes of miR-1, relationship between serum miR-1 level and severity, as well as the effect of the therapeutic intervention of AMI. In addition, a large amount of AMI patients should be used to finalize the diagnostic standard, compare with other biomarkers such as TnT and TnI. The third limitation is that the skeletal muscle also has miR-1 expression [22, 33]. Thus, the damage of skeletal muscle should be excluded when miR-1 is used in the diagnosis of AMI, because miR-1 is also expressed in skeletal muscle. A strategy to compensate for this is to select more circulating miRNAs that have different expression levels between heart and skeletal muscle.
The search for new biomarkers of cardiovascular diseases including AMI remains a large and growing enterprise. Currently, all the clinically applied circulating biomarkers are peptides or proteins determined by biochemical or immunoassay techniques. The advances in molecular biology and technology have fueled an interest in nucleotide-based biomarkers that may enhance diagnostic or therapeutic effectiveness. An ideal nucleotide blood biomarker of AMI should be abundant, be preferentially (or exclusively) produced in heart, and be present at low concentrations in the blood. Upon AMI, such nucleotides should be released into the circulating blood, where they are relative stable and can be quickly detected by molecular technologies. The current study revealed that serum miR-1 matches the above requirements.
During the writing of this article, we are very happy to note that several new reports in the research area had been published. In an animal study, another cardiac selective miRNA, circulating miR-208 is related to cardiac injury [34]. In a much larger group with appropriate controls, patients with (n=93) or without AMI (n=66), circulating miR-1 levels were quantified using real-time RT-PCR and receiver-operator characteristic curve analysis was performed to evaluate the diagnostic ability of miR-1 [35]. The authors concluded that circulating miR-1 may be a novel marker for diagnosis of AMI. More recently, Wang et al reported that the levels of circulating miR-1, miR-133a, miR-499, and miR-208a were increased in both rats and patients with AMI [36]. These new reports support our stance that miRNA-based technology is visible to reflect cardiac injury. The current translational study from our group provided new information regarding the direct release of miR-1 from injured cardiac cells, the detained time course study of circulating miR-1 in AMI, and the effect of therapy on the level of circulating miR-1.
In the current study, we established, for the first time, the quantitative method to determine the absolute amount of a miRNA in blood (solutions) as pmol/L. It will be important for not only cardiovascular diseases but for other diseases as well. To our knowledge, this is the first translational study to determine the role of circulating cell-free miRNA in cardiovascular diseases especially in AMI. The results suggest that miR-1 can be used as a highly sensitive early biomarker for AMI. Using circulating cell-free miRNAs as the diagnostic biomarkers may represent a new revolution in modern cardiology.
Acknowledgments
This work was supported by NIH Grants HL080133, HL095707 and a grant from American Heart Association 09GRNT2250567 to C. Zhang
References
- 1.Chua JH, Armugam A, Jeyaseelan K. MicroRNAs: biogenesis, function and applications. Curr Opin Mol Ther. 2009;11:189–199. [PubMed] [Google Scholar]
- 2.Kong Y, Han JH. MicroRNA: biological and computational perspective. Genomics Proteomics Bioinformatics. 2005;3:62–72. doi: 10.1016/S1672-0229(05)03011-1. [DOI] [PMC free article] [PubMed] [Google Scholar]
- 3.Lee RC, Feinbaum RL, Ambros V. The C. elegans heterochronic gene lin-4 encodes small RNAs with antisense complementarity to lin-14. Cell. 1993;75:843–854. doi: 10.1016/0092-8674(93)90529-y. [DOI] [PubMed] [Google Scholar]
- 4.Wightman B, Ha I, Ruvkun G. Posttranscriptional regulation of the heterochronic gene lin-14 by lin-4 mediates temporal pattern formation in C. elegans. Cell. 1993;75:855–862. doi: 10.1016/0092-8674(93)90530-4. [DOI] [PubMed] [Google Scholar]
- 5.Lagos-Quintana M, Rauhut R, Lendeckel W, Tuschl T. Identification of novel genes coding for small expressed RNAs. Science. 2001;294:853–858. doi: 10.1126/science.1064921. [DOI] [PubMed] [Google Scholar]
- 6.Bentwich I, Avniel A, Karov Y, Aharonov R, Gilad S, Barad O, Barzilai A, Einat P, Einav U, Meiri E, Sharon E, Spector Y, Bentwich Z. Identification of hundreds of conserved and nonconserved human microRNAs. Nat Genet. 2005;37:766–770. doi: 10.1038/ng1590. [DOI] [PubMed] [Google Scholar]
- 7.Chen K, Rajewsky N. The evolution of gene regulation by transcription factors and microRNAs. Nat Rev Genet. 2007;8:93–103. doi: 10.1038/nrg1990. [DOI] [PubMed] [Google Scholar]
- 8.Lewis BP, Burge CB, Bartel DP. Conserved seed pairing, often flanked by adenosines, indicates that thousands of human genes are microRNA targets. Cell. 2005;120:15–20. doi: 10.1016/j.cell.2004.12.035. [DOI] [PubMed] [Google Scholar]
- 9.Zhang C. MicroRNAs: Role in Cardiovascular Biology and Disease. Clin Sci (Lond) 2008;114:699–706. doi: 10.1042/CS20070211. [DOI] [PubMed] [Google Scholar]
- 10.Zhang C. MicroRNomics: a newly emerging approach for disease Biology. Physiol Genomics. 2008;33:139–147. doi: 10.1152/physiolgenomics.00034.2008. [DOI] [PubMed] [Google Scholar]
- 11.Lagos-Quintana M, Rauhut R, Yalcin A, Meyer J, Lendeckel W, Tuschl T. Identification of tissue-specific microRNAs from mouse. Curr Biol. 2002;12:735–739. doi: 10.1016/s0960-9822(02)00809-6. [DOI] [PubMed] [Google Scholar]
- 12.Cheng Y, Liu X, Yang J, Lin Y, Xu D, Lu Q, Deitch EA, Huo Y, Delphin E, Zhang C. MicroRNA-145, a novel smooth muscle cell phenotypic marker and modulator, controls vascular neointimal lesion formation. Circ Res. 2009;105:158–166. doi: 10.1161/CIRCRESAHA.109.197517. [DOI] [PMC free article] [PubMed] [Google Scholar]
- 13.Cortez MA, Calin GA. MicroRNA identification in plasma and serum: a new tool to diagnose and monitor diseases. Expert Opin Biol Ther. 2009;9:703–711. doi: 10.1517/14712590902932889. [DOI] [PubMed] [Google Scholar]
- 14.Dong S, Cheng Y, Yang J, Li J, Liu X, Wang X, Wang D, Krall TJ, Delphin ES, Zhang C. MicroRNA expression signature and the role of microRNA-21 in the early phase of acute myocardial infarction. J Biol Chem. 2009;284:29514–29525. doi: 10.1074/jbc.M109.027896. [DOI] [PMC free article] [PubMed] [Google Scholar]
- 15.Ji R, Cheng Y, Yue J, Yang J, Liu X, Chen H, Dean DB, Zhang C. MicroRNA expression signature and antisense-mediated depletion reveal an essential role of microRNA in vascular neointimal lesion formation. Circ Res. 2007;100:1579–1588. doi: 10.1161/CIRCRESAHA.106.141986. [DOI] [PubMed] [Google Scholar]
- 16.Cheng Y, Ji R, Yue J, Yang J, Liu X, Chen H, Dean DB, Zhang C. MiroRNAs are aberrantly expressed in hypertrophic heart: do they play a role in cardiac hypertrophy? Am J Pathol. 2007;170:1831–1840. doi: 10.2353/ajpath.2007.061170. [DOI] [PMC free article] [PubMed] [Google Scholar]
- 17.Lin Y, Liu X, Cheng Y, Yang J, Huo Y, Zhang C. Involvement of microRNAs in hydrogen peroxide-mediated gene regulation and cellular injury response in vascular smooth muscle cells. J Biol Chem. 2009;284:7903–7913. doi: 10.1074/jbc.M806920200. [DOI] [PMC free article] [PubMed] [Google Scholar]
- 18.Cheng Y, Liu X, Zhang S, Lin Y, Yang J, Zhang C. MicroRNA-21 protects against the H2O2-induced injury on cardiac myocytes via its target gene PDCD4. J Mol Cell Cardiol. 2009;47:5–14. doi: 10.1016/j.yjmcc.2009.01.008. [DOI] [PMC free article] [PubMed] [Google Scholar]
- 19.Souza EM, Henriques-Pons A, Bailly C, Lansiaux A, Araújo-Jorge TC, Soeiro Mde N. In vitro measurement of enzymatic markers as a tool to detect mouse cardiomyocytes injury. Mem Inst Oswaldo Cruz. 2004;299:697–701. doi: 10.1590/s0074-02762004000700006. [DOI] [PubMed] [Google Scholar]
- 20.Landgraf P, Rusu M, Sheridan R, Sewer A, Iovino N, Aravin A, Pfeffer S, Rice A, Kamphorst AO, Landthaler M, Lin C, Socci ND, Hermida L, Fulci V, Chiaretti S, Foà R, Schliwka J, Fuchs U, Novosel A, Müller RU, Schermer B, Bissels U, Inman J, Phan Q, Chien M, Weir DB, Choksi R, De Vita G, Frezzetti D, Trompeter HI, Hornung V, Teng G, Hartmann G, Palkovits M, Di Lauro R, Wernet P, Macino G, Rogler CE, Nagle JW, Ju J, Papavasiliou FN, Benzing T, Lichter P, Tam W, Brownstein MJ, Bosio A, Borkhardt A, Russo JJ, Sander C, Zavolan M, Tuschl T. A mammalian microRNA expression atlas based on small RNA library sequencing. Cell. 2007;129:1401–1414. doi: 10.1016/j.cell.2007.04.040. [DOI] [PMC free article] [PubMed] [Google Scholar]
- 21.Zhao Y, Samal E, Srivastava D. Serum response factor regulates a muscle-specific microRNA that targets Hand2 during cardiogenesis. Nature. 2005;436:214–220. doi: 10.1038/nature03817. [DOI] [PubMed] [Google Scholar]
- 22.Rao PK, Toyama Y, Chiang HR, Gupta S, Bauer M, Medvid R, Reinhardt F, Liao R, Krieger M, Jaenisch R, Lodish HF, Blelloch R. Loss of cardiac microRNA-mediated regulation leads to dilated cardiomyopathy and heart failure. Circ Res. 2009;105:585–594. doi: 10.1161/CIRCRESAHA.109.200451. [DOI] [PMC free article] [PubMed] [Google Scholar]
- 23.Garzon R, Calin GA, Croce CM. MicroRNAs in Cancer. Annu Rev Med. 2009;60:167–179. doi: 10.1146/annurev.med.59.053006.104707. [DOI] [PubMed] [Google Scholar]
- 24.Valadi H, Ekström K, Bossios A, Sjöstrand M, Lee JJ, Lötvall JO. Exosome-mediated transfer of mRNAs and microRNAs is a novel mechanism of genetic exchange between cells. Nat Cell Biol. 2007;9:654–659. doi: 10.1038/ncb1596. [DOI] [PubMed] [Google Scholar]
- 25.Chin LJ, Slack FJ. A truth serum for cancer--microRNAs have major potential as cancer biomarkers. Cell Res. 2008;18:983–984. doi: 10.1038/cr.2008.290. [DOI] [PubMed] [Google Scholar]
- 26.Zhu W, Qin W, Atasoy U, Sauter ER. Circulating microRNAs in breast cancer and healthy subjects. BMC Res Notes. 2009;2:89–95. doi: 10.1186/1756-0500-2-89. [DOI] [PMC free article] [PubMed] [Google Scholar]
- 27.Wang K, Zhang S, Marzolf B, Troisch P, Brightman A, Hu Z, Hood LE, Galas DJ. Circulating microRNAs, potential biomarkers for drug-induced liver injury. Proc Natl Acad Sci U S A. 2009;106:4402–4407. doi: 10.1073/pnas.0813371106. [DOI] [PMC free article] [PubMed] [Google Scholar]
- 28.Luo X, Lin H, Pan Z, Xiao J, Zhang Y, Lu Y, Yang B, Wang Z. Down-regulation of miR-1/miR-133 contributes to re-expression of pacemaker channel genes HCN2 and HCN4 in hypertrophic heart. J Biol Chem. 2008;283:2045–2052. doi: 10.1074/jbc.M801035200. [DOI] [PubMed] [Google Scholar]
- 29.Ikeda S, He A, Kong SW, Lu J, Bejar R, Bodyak N, Lee KH, Ma Q, Kang PM, Golub TR, Pu WT. MicroRNA-1 negatively regulates expression of the hypertrophy-associated calmodulin and Mef2a genes. Mol Cell Biol. 2009;29:2193–2204. doi: 10.1128/MCB.01222-08. [DOI] [PMC free article] [PubMed] [Google Scholar]
- 30.Shan ZX, Lin QX, Fu YH, Deng CY, Zhou ZL, Zhu JN, Liu XY, Zhang YY, Li Y, Lin SG, Yu XY. Upregulated expression of miR-1/miR-206 in a rat model of myocardial infarction. Biochem Biophys Res Commun. 2009;381:597–601. doi: 10.1016/j.bbrc.2009.02.097. [DOI] [PubMed] [Google Scholar]
- 31.Bostjancic E, Zidar N, Stajer D, Glavac D. MicroRNAs miR-1, miR-133a, miR-133b and miR-208 Are Dysregulated in Human Myocardial Infarction. Cardiology. 2009;115:163–169. doi: 10.1159/000268088. [DOI] [PubMed] [Google Scholar]
- 32.Mitchell PS, Parkin RK, Kroh EM, Fritz BR, Wyman SK, Pogosova-Agadjanyan EL, Peterson A, Noteboom J, O'Briant KC, Allen A, Lin DW, Urban N, Drescher CW, Knudsen BS, Stirewalt DL, Gentleman R, Vessella RL, Nelson PS, Martin DB, Tewari M. Circulating microRNAs as stable blood-based markers for cancer detection. Proc Natl Acad Sci U S A. 2008;105:10513–10518. doi: 10.1073/pnas.0804549105. [DOI] [PMC free article] [PubMed] [Google Scholar]
- 33.Sokol NS, Ambros V. Mesodermally expressed Drosophila microRNA-1 is regulated by Twist and is required in muscles during larval growth. Genes Dev. 2005;19:2343–2354. doi: 10.1101/gad.1356105. [DOI] [PMC free article] [PubMed] [Google Scholar]
- 34.Ji X, Takahashi R, Hiura Y, Hirokawa G, Fukushima Y, Iwai N. Plasma miR-208 as a Biomarker of Myocardial Injury. Clin Chem. 2009;55:1944–1949. doi: 10.1373/clinchem.2009.125310. [DOI] [PubMed] [Google Scholar]
- 35.Ai J, Zhang R, Li Y, Pu J, Lu Y, Jiao J, Li K, Yu B, Li Z, Wang R, Wang L, Li Q, Wang N, Shan H, Li Z, Yang B. Circulating microRNA-1 as a potential novel biomarker for acute myocardial infarction. Biochem Biophys Res Commun. 2010;391:73–77. doi: 10.1016/j.bbrc.2009.11.005. [DOI] [PubMed] [Google Scholar]
- 36.Wang GK, Zhu JQ, Zhang JT, Li Q, Li Y, He J, Qin YW, Jing Q. Circulating microRNA: a novel potential biomarker for early diagnosis of acute myocardial infarction in humans. Eur Heart J. 2010 Feb 16; doi: 10.1093/eurheartj/ehq013. Epub ahead of print. [DOI] [PubMed] [Google Scholar]