
Figure 3. A2BP1-dependent differential splicing events.
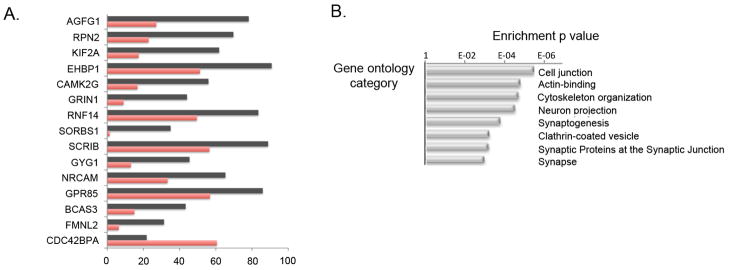
A. Top A2BP1-specific differential splicing events. DS events showing the most significant differences in alternative splicing between low-A2BP1 autism cases and controls as well as DS differences consistent with the A2BP1 binding site position. The horizontal axis depicts the percentage of transcripts including the alternative exon. Red-autism samples, black-control samples.
B. Relevant gene ontology categories enriched in the set of genes containing exons differentially spliced between low-A2BP1 autism cases and controls.