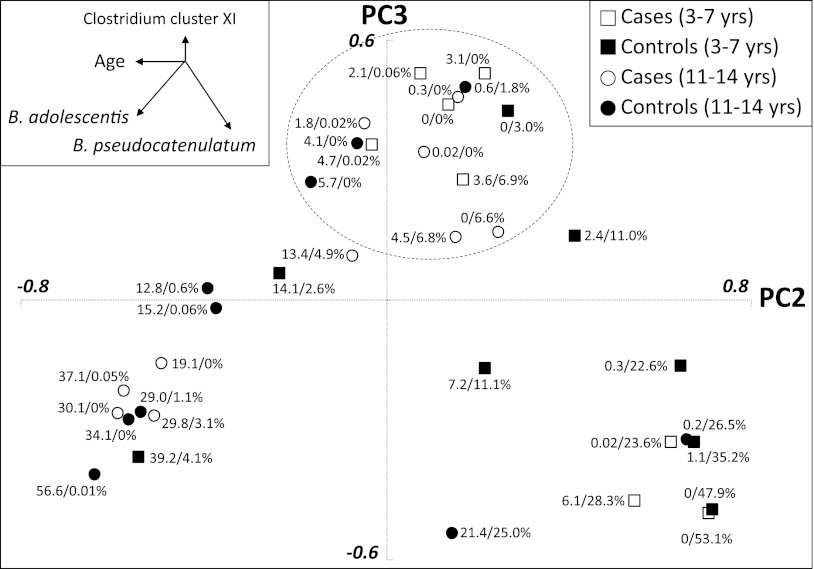
FIG. 2.
The distribution of children positive for β-cell autoantibodies (case subjects with open symbols) and autoantibody-negative children (control subjects with filled symbols) according to PC2 (x-axis) and PC3 (y-axis). PC2 shows an inverse correlation with the abundance of B. adolescentis and a positive correlation with B. pseudocatenulatum, whereas PC3 shows an inverse correlation with both B. adolescentis and B. pseudocatenulatum. Indicated percentages indicate the prevalence of B. adolescentis and B. pseudocatenulatum, respectively. Age of the children is associated with PC2, whereas autoantibody positivity is associated with PC3. The children 3 to 7 years of age (circle) from the FINDIA pilot have higher numbers of B. pseudocatenulatum and lower numbers of B. adolescentis than the children from the TRIGR pilot 11 to 14 years of age (square). The main correlations with PC2 and PC3 are depicted with vectors in the top left. Children with a dearth of both B. adolescentis and B. pseudocatenulatum (sum <12%) are encompassed by the dashed circle near the top and the number of autoantibody-positive children is higher than the number of control subjects at the apex (10/18 vs. 4/18; P = 0.040; χ2 test).

