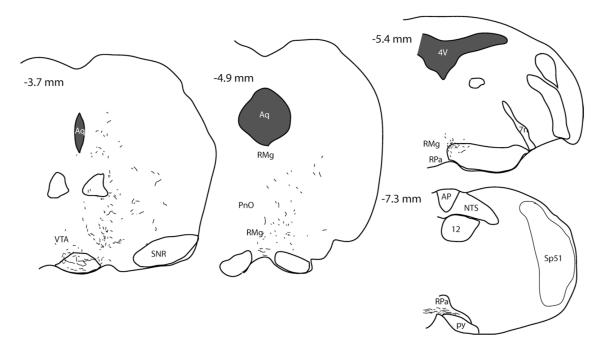
Figure 10.
Distribution of DMH projections in the male DIO mouse. Computer-assisted line drawings illustrate the distribution of BDA immunoreactive fibers in the mouse receiving a BDA injection into the DMH. The line drawings represent a single case with a BDA injection in the DMH of a DIO mouse. Brain levels are indicated in the upper left corner of each representative section (according to the mouse brain atlas Franklin and Paxinos, 1997). The injection site is indicated by the black shading labeled IS.


