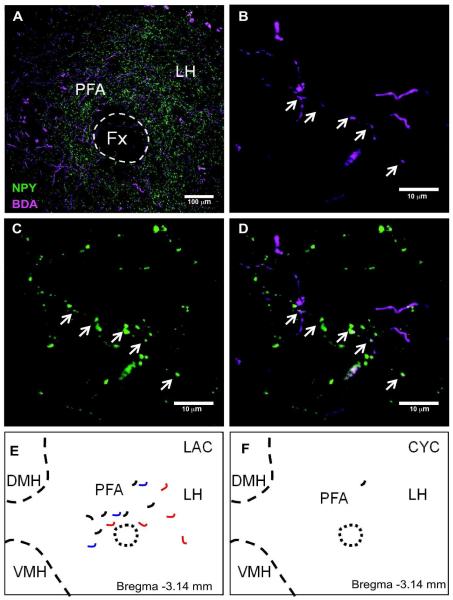
Figure 5. DMH-NPY projections to the LH in lactating rats.
(A) 20x confocal image showing BDA (magenta) and NPY (green) fiber distribution in the LH. (B) BDA fiber distribution in 40x confocal image. Arrows indicate the co-localized fiber. (C) NPY fiber distribution in 40x confocal image. (D) Overlay 40x confocal image showing BDA/NPY co-localized fiber indicated by arrows. Schematic drawing showing the distribution of BDA fibers co-localized with NPY in the LH of lactating (E) and cycling (F) rats. Projections from 3 different cases with injections limited to the DMH are represented in different colors (red, blue and black).

