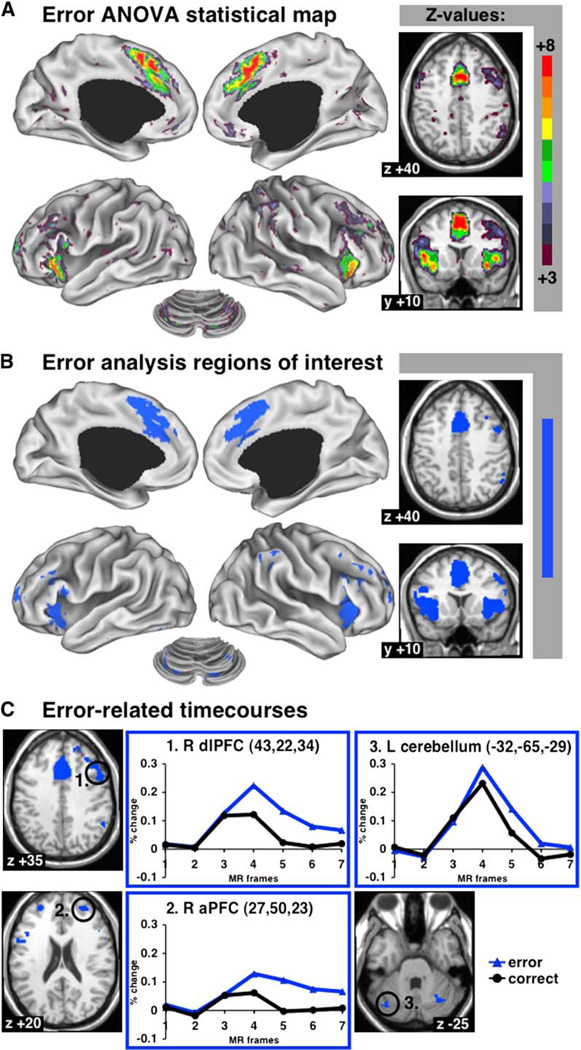
Figure 6. Error-Related Activity.
(A) Statistical map showing regions with differences in trial-related activity between correct and error trials (ANOVA).
(B) Regions of interest for error-related activity.
(C) Regionwise error-related data in representative regions of interest (responses averaged across voxels). Percent BOLD signal change displayed on y axis; MR frames (TR) displayed on×axis.

