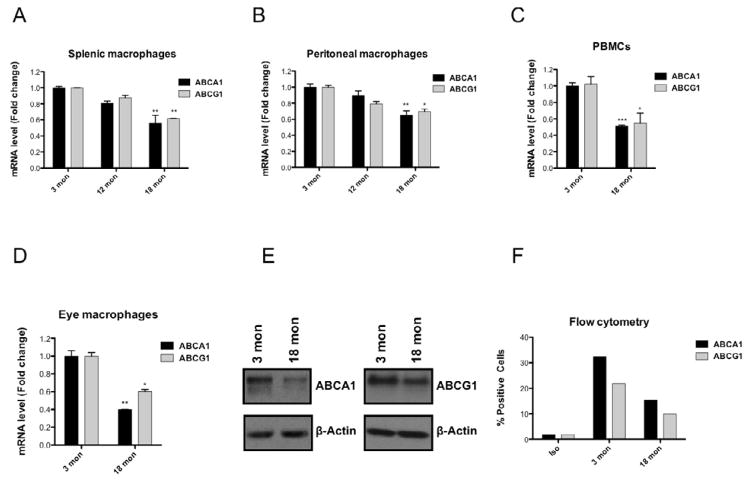
Figure 1. ABCA1 and ABCG1 expression is altered in senescent macrophages.
Quantitative mRNA analysis of ABCA1 and ABCG1 in splenic (A), peritoneal (B) macrophages and PBMCs (C) isolated from 3, 12 or 18 months old mice. (D) CNV was induced in 3 or 18 months old mice and eye macrophages harvested by laser microdissection were analyzed for ABCA1 and ABCG1 expression by qPCR. (E) Whole cell lysate of peritoneal macrophages of 3 or 18 months old mice were subjected to immunoblot analysis with antibodies against ABCA1, ABCG1 or β-Actin. (F) Relative flow cytometry profiles of ABCA1 and ABCG1 in peritoneal macrophages isolated from 3 or 18 months old mice. Iso = negative isotype control. Values are expressed as mean + SE (A–D). Statistically significant difference *P<0.05, **P<0.01, ***P<0.001.

