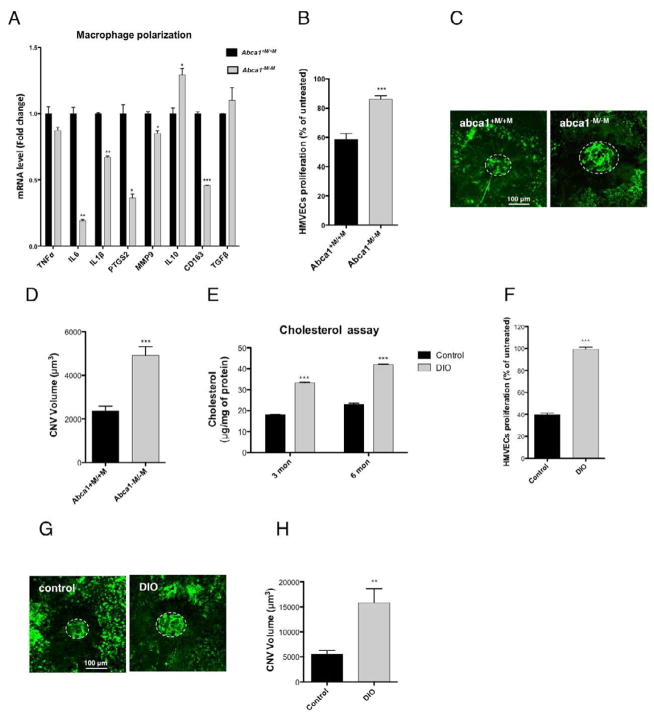
Figure 3. Macrophage ability to regulate vascular proliferation is altered by Abca1 deletion or cholesterol-rich diet.
(A) Quantitative mRNA analysis of M1 (TNFα, IL6, ILlβ, PTGS2, CCL2 and MMP9) and M2 (IL10, CD163 and TGFβ) markers in wt (Abca1+M/+M) and ABCA1-deficient (Abca1−M/−M) peritoneal macrophages. (B) HMVECs proliferation when co-cultured with Abca1+M/+M or Abca1−M/−M macrophages. (C) Abca1+M/+M or Abca1−M/−M mice were perfused with FITC-dextran (green) 7 days after laser injury and CNV was examined by confocal microscopy. Representative CNV photographs are shown, scale bar; 100 μm. (D) Quantification of CNV (white circle) demonstrated a significant increase of CNV volume in Abca1−M/−M mice compared to wt mice. (E) Quantification of relative cholesterol content demonstrated a higher accumulation in macrophages from DIO mice at both 3 and 6 months of age as compared to controls. (F) Measurement of proliferation of HMVECs after incubation with DIO or control macrophages. Representative illustration (G) and quantification of CNV (white circle) volume (H) demonstrated an inability of DIO macrophages to inhibit CNV as compared to controls. Values are expressed as mean + SE. Statistically significant difference **P<0.01, ***P<0.001.

