Fig. 3.

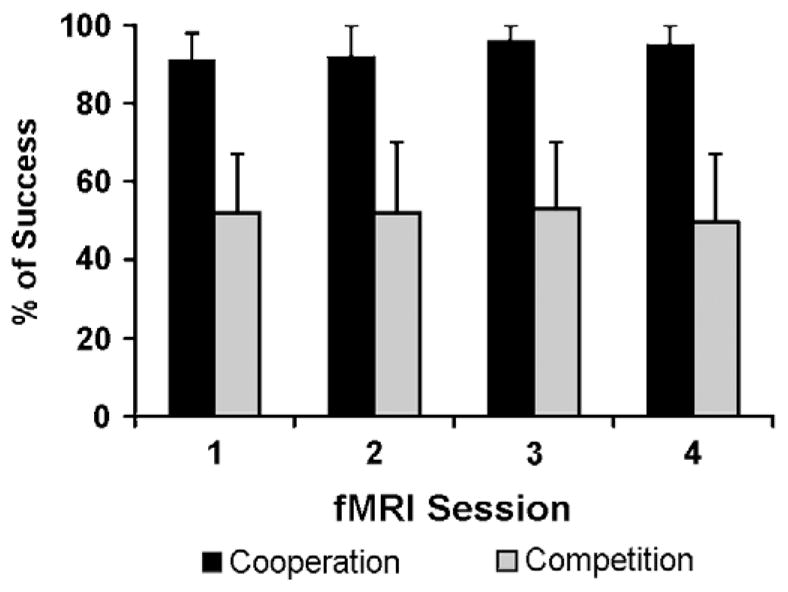
Histograms showing the mean percentage of success and standard deviations of participants at achieving the target pattern in cooperation and competition trials across the four fMRI sessions.

Histograms showing the mean percentage of success and standard deviations of participants at achieving the target pattern in cooperation and competition trials across the four fMRI sessions.