

Abstract
MicroRNAs regulate the expression of many genes and subsequently control various cellular processes, such as the immune response to viral infections mediated by type I interferon (IFN). In this study, the expression pattern of two interferon-related microRNAs, miR-146a and miR-155, was examined in healthy and HCV-genotype-4-infected peripheral blood mononuclear cells (PBMCs) using qRT-PCR. In contrast to other viral infections, the expression pattern was similar in both healthy and infected PBMCs. This could be attributed to attenuation of IFN pathway by HCV, which was assessed by investigating the expression of MxA, an interferon-stimulated gene, that showed lower expression in HCV-infected PBMCs. To determine the site of interference of HCV in the IFN pathway, expression of both microRNAs was examined following stimulation of PBMCs with IFN-α2a, an activator of the JAK/STAT pathway as well as with imiquimod, a toll-like receptor-7 (TLR-7) agonist that promotes interferon release. IFN stimulation induced the expression of miR-146a and miR-155 in HCV-infected and healthy PBMCs. Stimulation with imiquimod led to a down-regulation of both microRNAs in infected PBMCs, while it increased their expression in healthy PBMCs, indicating that HCV might interfere with miR-146a and miR-155 expression at sites upstream of interferon release, specifically in the TLR-7 pathway. The pattern of expression of both miR-146a and miR-155 was very similar with a strong positive correlation, but showed no correlation to the patients’ clinical or histopathological parameters or response to treatment. In conclusion, HCV infection might repress the induction of miR-146a and miR-155 by interfering with TLR-7 signaling.
Keywords: HCV, PBMCs, miR-146a, miR-155, Interferon, TLR-7
Abbreviations: miR, microRNA; PBMCs, peripheral blood mononuclear cells; IFN, interferon; TLR, toll-like receptor
Highlights
▸ Repressed induction of miR-146a and miR-155 in PBMCs of HCV-infected patients. ▸ A strong positive correlation exists between expression of miR-146a and miR-155. ▸ TLR-7 activation suppresses miR-146a and miR-155 in PBMCs of HCV-infected patients. ▸ JAK/STAT pathway activation induces miR-146a and miR-155 in HCV infection.
1. Introduction
Various microRNAs are now being investigated in hepatitis C virus infection with the most popular one being miR-122 for its reported specificity to liver tissue [1]. miR-122 was found to interact with HCV RNA enhancing its replication [2], despite that, it showed aberrant expression in HCV infected liver tissues [3]. miR-122 was also reported to be a possible predictor of response to interferon treatment, where non-responders (NRs) showed lower pre-treatment miR-122 expression compared to sustained virologic responders (SVRs) [4]. Several other microRNAs have also been identified to be possible predictors of response in HCV infection, such as miR-27b, miR-422b and miR-378, which showed lower expression in NRs compared to complete early virologic responders (cEVRs), while the expression of miR-34b, miR-145, miR-143, miR-652 and miR-18a was significantly higher in NRs than in SVRs [5]. The effect of IFN-β, a component of the innate antiviral immune response, on microRNA expression in Huh7 cells was previously investigated, where the expression of eight microRNAs with sequence complementarity to the HCV genome of the six genotypes was induced upon treatment with IFN-β. These microRNAs are miR-1, miR-30, miR-128, miR-196, miR-296, miR-351, miR-431 and miR-448. Five of them (miR-196, miR-296, miR-351, miR-431 and miR-448) showed substantial attenuation of viral replication after being induced by IFN [6]. miR-146a and miR-155 are also associated with the IFN pathway, but they were not among those investigated in this study. However, they were examined in a non-HCV infection in other studies, where murine macrophages infected with Vesicular Stomatitis Virus (VSV) showed an up-regulation of both microRNAs [7, 8]. The up-regulation of miR-146a and miR-155 in response to VSV infection occurred via a RIG-I/NF-κB dependent pathway [7, 8]. Expression of miR-146a and miR-155 is also induced in response to interferon and TLR-7 agonist, imiquimod, in various cell types [9, 10]. miR-146a suppresses the production of type I IFNs by targeting and inhibiting interleukin 1 receptor associated kinase (IRAK) 1 and 2 and tumor necrosis factor (TNF)-associated factor 6 (TRAF6) [11], which are adaptor molecules recruited upon activation of TLRs [12]. Moreover, it suppresses signal transducer and activator of transcription 1 (STAT1), which is a crucial element in the JAK/STAT pathway; thus, it acts as a negative feedback regulator of IFN signaling pathways [9]. miR-155 targets suppressor of cytokine signaling protein 1 (SOCS1), an inhibitor of the JAK/STAT pathway, leading to enhanced activation of type I IFN signaling, hence potentiating the antiviral effects of IFN [8], which indicates that miR-155 acts as a positive feedback regulator of the innate immune system (Fig. 1). This reveals the paradoxical association between miR-155 and miR-146a and host immune responses. Besides VSV, other viral infections also induced the expression of miR-155 and miR-146a in different cell types. Infection of primary human B-cells with Epstein–Barr virus (EBV) led to an up-regulation of miR-155 [13], as for miR-146a, its expression was induced in response to infection of human primary neural cells with herpes simplex virus type 1 (HSV-1) [14]. Most of the studies that investigated the role of microRNAs in HCV infection focused mainly on the expression and role of microRNAs in liver tissues or hepatocellular carcinoma cell lines. However, it has been reported that HCV infects peripheral blood mononuclear cells (PBMCs) and replicates within them making these cells act as a reservoir for the virus [15]. This makes PBMCs an important target for investigation in HCV infection. Taking the advantage that limited data are available about the expression of miR-146a and miR-155 especially in genotype 4 HCV infections, which is the major genotype in Egypt [16], our study aimed at examining the expression profile of miR-146a and miR-155 in the PBMCs of HCV genotype 4 infected patients compared to healthy controls. We were also interested in elucidating the effect of the TLR-7 agonist, imiquimod, which induces endogenous interferon release, as well as the impact of exogenously added IFN-α2a on the expression of miR-146a and miR-155.
Fig. 1.

Host immune response to viral infection (Interferon Signaling Pathways). HCV RNA is recognized by the RNA-helicase, retinoic acid inducible gene I (RIG-I). This interaction recruits IPS-1 activating a signaling cascade with a final activation of interferon regulatory factor 3 and 7 (IRF3 & IRF7). IRF 3 & 7 induce IFN-α production [25]. Viral RNA can also be sensed by toll-like receptor 7 (TLR-7), which recruits TRAF6, IRAK1 and IRAK4, subsequently activating IRF-7 and inducing IFN-α production [12]. Released IFN binds to its receptor, interferon-α-receptor (IFNAR), leading to phosphorylation and activation of janus kinase 1 (JAK1) and tyrosine kinase 2 (Tyk2). Both kinases activate STAT 1 & 2, which form a complex with IRF9 and induce the expression of the ISG, MxA [26]. The JAK/STAT pathway is regulated by SOCS1, which inhibits STAT1 activation [27]. RIG-I and TLR-7 pathways as well as IFN induce the expression of miR-146a and miR-155 [7–9]. MiR-146a targets and inhibits IRAK1, TRAF6 and STAT1, suppressing interferon release and the JAK/STAT pathway [9, 11], while miR-155 inhibits SOCS1, enhancing the JAK/STAT pathway [8].
2. Results
2.1. Expression pattern of miR-146a and miR-155 in HCV infected and healthy PBMCs
Pools of HCV infected and healthy PBMCs were prepared and cultured in 24-well plates. The expression of miR-146a and miR-155 in the pooled PBMCs was examined using qRT-PCR. miR-146a showed similar expression in patients (1.864 ± 0.3426) and healthy controls (1.238 ± 0.1675) (P = 0.5714) (Fig. 2A). The same was observed for miR-155, where no difference in its expression was found in patients (1.379 ± 0.195) compared to healthy controls (1.040 ± 0.1106) (P = 0.2295) (Fig. 2B). In order to exclude any bias that can occur from pooling of the PBMCs, expression pattern of miR-146a and miR-155 was investigated and compared between the PBMCs of 20 individual patients and 10 healthy controls without pooling. As with pooled PBMCs no difference in the expression of miR-146a was observed in HCV infected patients (1.568 ± 0.3651) when compared to healthy controls (1.481 ± 0.3232) (P = 0.7414) (Fig. 2A). The same results were obtained with miR-155, where patients (2.096 ± 0.3734) and controls (1.349 ± 0.2926) (P = 0.2619) showed similar expression pattern (Fig. 2B).
Fig. 2.

Expression pattern of miR-146a and miR-155 in HCV infected and healthy PBMCs. miR-146a and miR-155 expression was quantified in pooled and individual PBMCs of HCV infected patients and healthy controls using qRT-PCR. Expression of miR-146a (A) and miR-155 (B) did not differ between patients and controls, neither in pooled nor in individual PBMCs. Results are expressed as mean of relative quantitation (RQ = 2−ΔΔCT) ± standard error of the mean (SEM).
2.2. Viral genotype and correlation between microRNA expression and clinical parameters of patients
Genotyping revealed that all 20 patients were infected with HCV genotype 4. The clinical data of the patients were collected (Table 1) and analyzed for the presence of any correlation between the patients’ age, liver enzymes, fibrotic stage or viral load and the expression of miR-146a and miR-155. MicroRNA expression showed no correlation to the different clinical, biochemical and histopathological parameters (Table 2). Moreover, the baseline expression of miR-146a and miR-155 before treatment did not correlate to the response of the patients to the standard interferon/ribavirin therapy.
Table 1.
Patients’ clinical data.
| Patients | Age | Gender | Liver enzymes (IU/L) | Fibrotic Stage | Viral Load (IU/ml) | Genotype | Response to therapy (R or NR)* | |
|---|---|---|---|---|---|---|---|---|
| ALT* (9–40 IU/L) | AST* (10–35 IU/L) | |||||||
| P1 | 46 | F | 88 | 30 | F4 | 3.64 × 10³ | 4 | NR |
| P2 | 42 | M | 60 | 38 | F1 | 9.80 × 10³ | 4 | R |
| P3 | 25 | M | 36 | 31 | F2 | 3.913 × 10⁵ | 4 | R |
| P4 | 45 | F | 53 | 60 | F3 – F4 | 1.308 × 10⁶ | 4 | NR |
| P5 | 20 | M | 19 | 29 | F0 | 2.47 × 10⁴ | 4 | n/a |
| P6 | 50 | F | 88 | 83 | F0 | 7.10 × 10³ | 4 | n/a |
| P7 | 37 | F | 33 | 24 | F1 | 2.00 × 10⁵ | 4 | R |
| P8 | 37 | M | 61 | 73 | F4 | 7.10 × 10⁴ | 4 | R |
| P9 | 29 | M | 62 | 73 | F2 | 6.48 × 10⁵ | 4 | R |
| P10 | 34 | M | 17 | 21 | F1 | 3.06 × 10⁶ | 4 | R |
| P11 | 46 | F | 42 | 26 | F1 | 1.14 × 10⁶ | 4 | R |
| P12 | 45 | M | 149 | 73 | F3 | 5.47 × 10⁶ | 4 | NR |
| P13 | 33 | F | 126 | 158 | F3 | 1.99 × 10⁵ | 4 | R |
| P14 | 33 | F | 28 | 26 | F2 | 3.42 × 10⁴ | 4 | NR |
| P15 | 45 | F | 59 | 60 | F3 | 2.62 × 10⁴ | 4 | R |
| P16 | 59 | M | 152 | 116 | F4 | 4.28 × 10³ | 4 | n/a |
| P17 | 44 | M | 80 | 61 | F3 | 3.54 × 10⁴ | 4 | R |
| P18 | 55 | F | 45 | 54 | F3 | 2.83 × 10⁶ | 4 | R |
| P19 | 48 | M | 45 | 68 | F1 | 1.60 × 10⁷ | 4 | R |
| P20 | 39 | M | 57 | 73 | F2 | 6.48 × 10⁵ | 4 | NR |
Abbreviations: ALT = alanine aminotransferase; AST = aspartate aminotransferase; NR = non-responder; R = responder; n/a = response not available since patient dropped out of therapy due to non-compliance.
Table 2.
Correlation between microRNA expression profiles and patients’ clinical parameters. The table represents the correlation between miR-146a and miR-155 and the clinical and histopathological parameters of the HCV infected patients (n = 20). r Value represents the Spearman's rank correlation coefficient; P < 0.05 indicates statistical significance.
| miR-146a | miR-155 | |
|---|---|---|
| Age | r = 0.2473 | r = 0.1463 |
| P = 0.2932 | P = 0.5384 | |
| ALT | r = −0.0775 | r = 0.0481 |
| P = 0.7454 | P = 0.8402 | |
| AST | r = 0.0506 | r = 0.0710 |
| P = 0.8322 | P = 0.7661 | |
| Fibrotic stage | r = 0.2271 | r = 0.3028 |
| P = 0.3356 | P = 0.1944 | |
| Viral load | r = 0.0541 | r = −0.0323 |
| P = 0.8206 | P = 0.8923 |
2.3. Expression pattern of MxA in PBMCs of HCV infected patients compared to healthy controls
Baseline expression of orthomyxovirus resistance gene (MxA), an interferon stimulated gene (ISG), was measured in pooled PBMCs of HCV infected patients and compared to its expression in healthy controls to assess the activity of the interferon pathway in these patients. MxA expression was lower in HCV infected patients (0.6740 ± 0.1110) compared to healthy controls (1.000 ± 0.02100) (P = 0.0286*) (Fig. 3A).
Fig. 3.
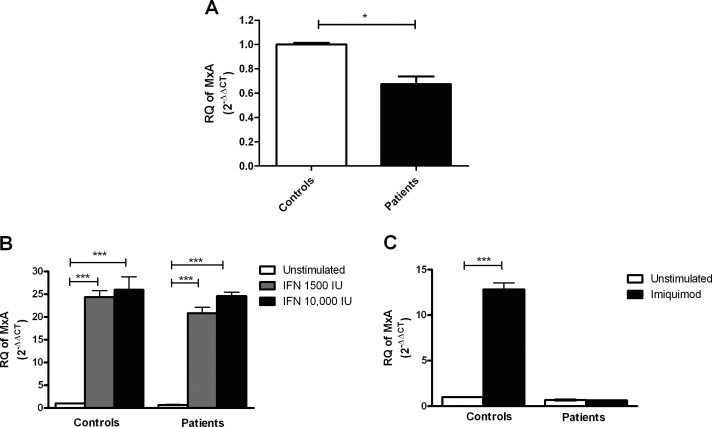
Effect of interferon-α2a and imiquimod on the expression of MxA in HCV infected and healthy PBMCs. HCV infected and healthy PBMCs were cultured in a 24-well plate and were either left untreated or stimulated with 1500 IU/ml, 10 000 IU/ml of IFN-α2a for 6 h or with 1 μg/ml of imiquimod for 24 h, followed by quantification of MxA using qRT-PCR. (A) No difference in MxA expression was observed in untreated PBMCs of HCV infected patients compared to healthy volunteers. (B) Both doses of IFN, 1500 IU/ml and 10 000 IU/ml induced the expression of MxA significantly in patients (P < 0.0001***) as well as in healthy volunteers (P < 0.0001***). (C) In healthy volunteers imiquimod stimulation led to an up-regulation of MxA compared to the untreated cells (P < 0.0001***), while it did not affect its expression in patients compared to the corresponding untreated PBMCs. Results are expressed as mean of relative quantitation (RQ =2−ΔΔCT) ± standard error of the mean (SEM). Stars indicate degree of significance.
2.4. Dose–response curve of interferon-α2a
A dose–response experiment was performed to determine the dose of IFN that would induce miR-155 the most, which would be used in the following experiments. Healthy PBMCs were stimulated with four different IFN doses, 1500 IU/ml, 3000 IU/ml, 6000 IU/ml and 10 000 IU/ml for 6 h, followed by quantification of miR-155. Surprisingly the lowest IFN dose, 1500 IU/ml, showed the highest induction of miR-155 with a mean fold increase of 2.5 (P = 0.0061**). 3000 IU/ml and 6000 IU/ml of IFN showed no change in the expression of miR-155. miR-155 exhibited a mean fold increase of 2.15 (P = 0.0061**) after stimulation with 10 000 IU/ml (Fig. 4A). According to this curve, 1500 IU/ml of IFN showed highest induction of miR-155 followed by 10 000 IU/ml, hence these were the doses used to conduct the following experiments.
Fig. 4.
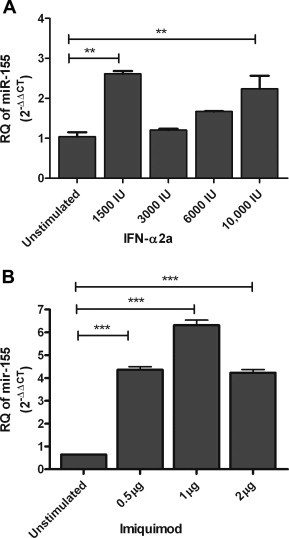
Dose–response curves of interferon and imiquimod. (A) Healthy PBMCs were stimulated with four different IFN doses, 1500 IU/ml, 3000 IU/ml, 6000 IU/ml and 10 000 IU/ml for 6 h, followed by quantification of miR-155. 1500 IU/ml of IFN showed the highest induction of miR-155 (P = 0.0061**).3000 IU/ml and 6000 IU/ml of IFN did induce miR-155 expression significantly. 10 000 IU/ml increased the expression of miR-155 compared to the untreated cells (P = 0.0061**). (B) Healthy PBMCs were stimulated with 0.5 μg/ml, 1 μg/ml and 2 μg/ml of imiquimod for 24 h, followed by quantification of miR-155. One microgram per milliliter of imiquimod showed the highest induction of miR-155 (P < 0.0001***), followed by 0.5 μg/ml (P < 0.0001***) and 2 μg/ml of imiquimod (P < 0.0001***) compared to the untreated PBMCs. Results are expressed as mean of relative quantitation (RQ = 2−ΔΔCT) ± standard error of the mean (SEM). Stars indicate the degree of significance.
2.5. Effect of interferon-α2a on the expression of miR-146a, miR-155 and MxA in HCV infected and healthy PBMCs
Stimulation of pooled PBMCs with 1500 IU/ml of IFN-α2a led to a significant up-regulation of both miR-146a and miR-155 in patients with a mean fold increase of 3.24 (P = 0.0357*) and 2.31 (P = 0.007**), respectively, as well as in healthy controls with a mean fold increase of 1.74 (P < 0.0001***) and 2.51 (P < 0.0061**), respectively, when compared to their corresponding untreated cells. Stimulation of HCV infected PBMCs with the higher IFN-α2a dose (10 000 IU/ml) led to a significant down-regulation of miR-146a and miR-155 with a mean fold decrease of −2.55 (P = 0.007**) and −2.04 (P = 0.0266*), respectively, compared to the corresponding untreated PBMCs. However, in healthy controls no significant difference was observed in the expression of miR-146a upon treatment with the higher IFN dose, while miR-155 expression was increased with a mean fold change of 2.15 (P = 0.0061**) (Fig. 5A and B). The same experiment was repeated on PBMCs of 6 individual patients to validate that the observed effects of IFN stimulation on microRNA expression is not affected by pooling of PBMCs. Stimulation of PBMCs from individual patients with 1500 IU/ml of IFN induced the expression of miR-146a and miR-155 with a mean fold increase of 2.6 (P = 0.0253*) and 2.39 (P = 0.0053**), respectively. PBMCs stimulated with 10 000 IU/ml of IFN showed a marked decrease in miR-146a and miR-155 expression compared to untreated cells with a mean fold change of −2.6 (P = 0.017*) and −1.55 (P = 0.0103*), respectively (Fig. 5A and B). These data show that individual and pooled PBMCs show the same pattern of microRNA expression in response to IFN stimulation, confirming that pooling of PBMCs does not interfere with the expression of microRNAs.
Fig. 5.
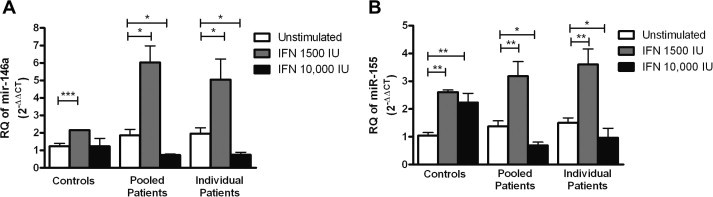
Effect of interferon-α2a on the expression of miR-146a and miR-155 in HCV infected and healthy PBMCs. PBMCs from healthy volunteers and HCV infected patients were cultured in a 24-well plate and were either left untreated or stimulated with 1500 IU/ml or 10 000 IU/ml of IFN-α2a for 6 h. (A) Stimulation of PBMCs with 1500 IU/ml of IFN led to a significant up-regulation of miR-146a in both pooled and individual PBMCs of patients (P = 0.0357*) and (P = 0.0253*), respectively as well as controls (P < 0.0001***). 10 000 IU/ml of IFN-α2a led to a significant down-regulation in pooled and individual patients (P = 0.035*) and (0.017*), but did not affect its expression in controls compared to the corresponding untreated cells. (B) Stimulation of PBMCs with 1500 IU/ml of IFN induced the expression of miR-155 in both pooled and individual patients (P = 0.007**) and (P = 0.0053**), respectively, as well as controls (P = 0.0061**). 10 000 IU/ml of IFN suppressed the expression of miR-155 in pooled (P = 0.0266*) and individual (P = 0.0103*) patients, but induced its expression in controls (P = 0.0061**) compared to the untreated cells. Results are expressed as mean of relative quantitation (RQ = 2−ΔΔCT) ± standard error of the mean (SEM). Stars indicate degree of significance.
MxA expression was measured after stimulation with the two interferon doses as a positive control, to validate that the used doses did activate the JAK/STAT pathway. Stimulation with both 1500 IU/ml and 10 000 IU/ml induced the expression of MxA in patients by 30.95 folds (P < 0.0001***) and 36.5 folds (P < 0.0001***), respectively, as well as in healthy volunteers by 24.3 folds (P < 0.0001***) and 25.97 folds (P < 0.0001***), respectively (Fig. 3B).
2.6. Dose–response curve of imiquimod
To determine the dose of imiquimod that shows the highest induction of the investigated microRNAs, a dose–response curve was conducted by stimulating healthy PBMCs with three different imiquimod doses, 0.5 μg/ml, 1 μg/ml and 2 μg/ml for 24 h, followed by quantification of miR-155. miR-155 showed a mean fold increase of 6.77 (P < 0.0001***) following stimulation with 0.5 μg/ml of imiquimod. A mean fold increase of 9.82 (P < 0.0001***) was observed in response to stimulation with 1 μg/ml of imiquimod. Two microgram per milliliter of imiquimod increased the expression of miR-155 by 6.57 folds (P < 0.0001***) (Fig. 4B). The highest induction of miR-155 was observed with 1 μg/ml of imiquimod, thus this was the dose used in the following experiments.
2.7. Effect of imiquimod on the expression of miR-146a, miR-155 and MxA in HCV infected and healthy PBMCs
Expression of miR-146a and miR-155 was measured after stimulation of HCV infected and healthy PBMCs with the TLR-7 agonist, imiquimod. In healthy controls stimulation with imiquimod significantly induced the expression of miR-146a and miR-155 with a mean fold increase of 2.4 (P < 0.0001***) and 4.77 (P = 0.0061**), respectively, compared to the unstimulated PBMCs. However, stimulation of HCV infected PBMCs with imiquimod suppressed the expression of miR-146a and miR-155 with a mean fold decrease of −2.61 (P = 0.0159*) and −2.42 (P = 0.036*), respectively, compared to the untreated PBMCs (Fig. 6A and B). To exclude any bias that could occur from pooling of PBMCs the same experiment was repeated using PBMCs of 6 individual patients, where stimulation with 1 μg/ml of imiquimod significantly suppressed the expression of miR-146a with a mean fold decrease of −2.00 (P = 0.037*) and miR-155 with a mean fold change of −2.55 (P = 0.001**) compared to unstimulated PBMCs (Fig. 6A and B). Relative expression of MxA was determined following stimulation of PBMCs with imiquimod as a positive control and to investigate whether the variation in the microRNA expression between patients and healthy controls was also accompanied by a variation in MxA expression. In healthy volunteers imiquimod stimulation led to an up-regulation of MxA with a mean fold increase of 12.84 (P < 0.0001***), while it did not affect its expression in patients (Fig. 3C).
Fig. 6.

Effect of imiquimod on miR-146a and miR-155 expression in HCV infected and healthy PBMCs. PBMCs were cultured in a 24-well plate and stimulated with 1μg/ml imiquimod for 24 h. (A) In healthy PBMCs stimulation with imiquimod induced the expression of miR-146a significantly relative to the untreated controls (P < 0.0001***). Stimulation of HCV infected PBMCs with imiquimod suppressed the expression of miR-146a compared to the untreated cells in both pooled (P = 0.0159*) and individual (P = 0.037*) PBMCs. (B) In healthy PBMCs, stimulation with imiquimod induced the expression of miR-155 compared to the untreated controls (P = 0.0061**). miR-155 was significantly down-regulated in response to imiquimod stimulation of both pooled (P = 0.036*) and individual (P= 0.001**) HCV infected PBMCs. Results are expressed as mean of relative quantitation (RQ = 2−ΔΔCT) ± standard error of the mean (SEM). Stars indicate degree of significance.
2.8. Correlation analysis between miR-146a and miR-155
Both miR-146a and miR-155 are interferon related microRNAs with antagonizing actions, despite that they showed very similar expression behavior in the untreated PBMCs as well as in response to stimulation with various drugs. This shows that there is a very close association in the regulation of these microRNAs, making the performance of a correlation analysis between the expression of both microRNAs necessary to confirm this association. Interestingly a strong positive correlation was observed between miR-146a and miR-155 in non-pooled PBMCs of the individual patients and healthy controls (Spearman r = 0.8962, P < 0.0001***) and (Spearman r = 0.6930, P = 0.0306*), respectively (Fig. 7 A and B).
Fig. 7.

Correlation analysis between miR-146a and miR-155 in HCV infected and healthy PBMCs. A positive correlation was observed in the expression pattern of miR-146a and miR-155 in both (A) healthy controls (Spearman r = 0.6930) (P = 0.0306*) and (B) HCV infected patients (Spearman r = 0.8962) (P < 0.0001***).
3. Discussion
miR-146a and miR-155 are among the epigenetic regulators of type I IFN-pathway, a representative for host antiviral innate immune response [7, 8]. Consequently, investigation of the role of these microRNAs in HCV infection could reveal new findings that might help in understanding its molecular pathogenesis. This study aimed for the first time at investigating the expression behavior of miR-146a and miR-155 in the PBMCs of HCV genotype 4 infected patients. PBMCs were chosen for investigation, because hepatitis C virus is capable of infecting and replicating within these cells, making them circulating carriers for the virus [17, 18]. miR-155 has previously shown a positive correlation between the expression of its precursor gene, BIC, and the persistence of HCV RNA in serum and PBMCs of non-genotype 4 infected patients after end of therapy [19]. In addition, miR-155 and BIC showed a positive correlation with HCV replication in PBMCs of HCV infected patients [20]. We were concerned with studying the expression of miR-146a and miR-155 in PBMCs of patients chronically infected with HCV genotype 4 compared to healthy controls. No significant difference in the relative expression of miR-146a and miR-155 was observed between pooled PBMCs of the two groups (Fig. 2A and B). That was further confirmed by examining the expression pattern of both microRNAs in PBMCs of individual patients and controls, where expression of the two microRNAs was similar in both groups (Fig. 2A and B), which demonstrates that pooling of PBMCs does not affect the expression pattern of these microRNAs. The expression of miR-146a and miR-155 showed no correlation, neither with the patients’ clinical and histopathological parameters (Table 2), nor with the response of the patients to therapy. Contrary to our results, VSV infected murine macrophages showed an induction of miR-146a and miR-155 expression via a RIG-I dependent pathway [7, 8]. On one hand, a reason for this difference could be that the studies conducted by Hou and colleagues used murine macrophages rather than human PBMCs for their investigation [7, 8]. On the other hand, these findings could be due to the fact that HCV is capable of evading host immune response by using its NS3/4A protease to cleave the adaptor protein interferon β promoter stimulator 1 (IPS-1) [21], which is recruited upon activation of RIG-I [22], hence preventing the activation of this pathway, the induction of miR-146a or miR-155 as well as interferon release. To assess the integrity of the interferon pathway in HCV infected PBMCs, we measured the expression of MxA, which is a sensitive marker for any minute amounts of interferon [23]. We found a down-regulation in MxA expression in patients compared to healthy controls (Fig. 3A), which might indicate a functional inhibition in the pathway that might hinder the induction of miR-146a and miR-155. It was interesting to locate whether the site of functional attenuation of interferon pathway is upstream or downstream of IFN release. Therefore, the expression of miR-146a and miR-155 was examined following stimulation of HCV infected and healthy PBMCs with IFN-α2a. After performing a dose–response experiment on healthy PBMCs we chose two doses of IFN, 1500 IU/ml and 10 000 IU/ml that showed the highest induction of miR-155 (Fig. 4A). The stimulations were performed on pooled PBMCs and PBMCs of individual patients to validate that the observed changes in microRNA expression in response to interferon is not affected by pooling of PBMCs. Stimulation with 1500 IU/ml of IFN-α2a led to a significant up-regulation of miR-146a and miR-155 in PBMCs of controls and both pooled and individual patients, however the induction was more pronounced in patients (Fig. 5A and B). That is in concordance with the results obtained in other studies, where stimulation of healthy PBMCs and pDCs with type I IFN induced the expression of miR-146a and miR-155, respectively [9, 10]. An interesting phenomenon was observed, where PBMCs stimulated with a higher IFN-α2a dose (10 000 IU/ml), showed a significant down-regulation of miR-146a and miR-155 in infected pooled and individual PBMCs compared to the untreated cells (Fig. 5A and B). To examine whether this biphasic effect in microRNA expression is also accompanied by the same biphasic response in MxA expression, we investigated the expression of MxA after stimulation with 1500 IU/ml and 10 000 IU/ml of IFN. Unlike the case with microRNAs, both doses increased the expression of MxA to almost the same levels (Fig. 3B). Our data suggest that the defect in the interferon pathway is not downstream of interferon release, i.e. not in the JAK/STAT pathway. Therefore, we aimed at checking for defects in TLR-7 signaling, as a representative for signaling pathways upstream of interferon release and JAK/STAT pathway activation. Accordingly, the expression of miR-146a and miR-155 was examined following stimulation of PBMCs of patients and controls with a synthetic TLR-7 agonist, imiquimod, for 24 h. To determine the most effective imiquimod dose, a dose–response experiment was performed and showed that 1 μg/ml showed the highest induction of miR-155 in healthy PBMCs compared to 0.5 μg/ml and 2 μg/ml (Fig. 4B). miR-146a and miR-155 expression was suppressed in response to stimulation with 1 μg/ml of imiquimod in pooled and individual HCV infected PBMCs; while in healthy PBMCs both microRNAs were up-regulated (Fig. 6A and B). The results observed in healthy PBMCs for miR-146a and miR-155 are consistent with previously reported findings showing that stimulation of PBMCs or pDCs with imiquimod led to an up-regulation of both microRNAs [9, 10]. The suppression of both microRNAs observed in HCV infected PBMCs imply that HCV infection might be interfering in one way or another with the pathways inducing the expression of these microRNAs and that this interference is upstream of interferon release and the JAK/STAT pathway, more specifically in TLR-7 signaling. For further confirmation and to exclude that the inhibitory effect imposed on microRNA expression in response to imiquimod is a mimic of the higher IFN dose, the expression of MxA was investigated following stimulation of PBMCs with imiquimod. Contrary to stimulation with 10 000 IU/ml of IFN, imiquimod did not induce the expression of MxA in HCV infected PBMCs (Fig. 3C). This strengthens the suggestion that HCV infection does interfere with TLR-7 signaling and hence represses activation of the IFN cascade and subsequently the expression of miR-146a and miR-155, while stimulation with IFN bypasses this interference and induces both microRNAs. Despite their paradoxical impact on IFN pathway, a very interesting observation found in our study was the strong positive correlation in expression behavior of miR-146a and miR-155 (Fig. 7A and B).
In conclusion, miR-146a and miR-155 are two interferon-related microRNAs that are stimulated by TLR-7 and interferon signaling pathways. Expression of miR-146a and miR-155 did not differ between HCV infected and healthy PBMCs, even though both microRNAs showed an up-regulation in response to other viral infections, such as VSV, EBV and HSV-1. This might imply that HCV infection represses the induction of these two microRNAs. By tracking the repression site, we suggest that it lies in TLR-7 signaling pathway and hence upstream of interferon release, rather than in the JAK/STAT pathway.
4. Patients and methods
4.1. Study subjects
A total of 20 untreated patients chronically infected with HCV genotype 4 were included in this study. The mean age is 40 years with a range between 20 and 59. HCV infection was diagnosed in all patients by the presence of anti-HCV antibodies and HCV RNA in the serum. All patients had a liver biopsy performed and the histological findings were classified according to Metavir scoring system. All patients were negative for hepatitis B surface antigen. Patients were diagnosed and followed up after treatment with weekly injections of pegIFN-α2a and daily oral doses of ribavirin at Al Kasr Al Ainy School of Medicine, Cairo University. A total of 10 healthy volunteers with a mean age of 40 years and a range between 23 and 56 were included in this study. Healthy volunteers were blood donors that were all negative for HCV, HBV and HIV infection. All patients and healthy volunteers gave their written informed consent. All experiments were performed in compliance with the guidelines of the institutional review board (IRB) of Al Kasr Al Ainy School of Medicine in Cairo University and in accordance with the ethical standards of the declaration of Helsinki.
4.2. Sample handling
Four milliliter of peripheral venous blood were collected in the presence of an anticoagulant (EDTA) from healthy controls and patients for isolation of PBMCs. In addition, 3 ml blood samples were collected from the patients for serum separation for determination of viral genotype. The blood samples were taken before starting interferon treatment. All samples were processed on the same day and within few hours after collection.
4.3. Isolation of peripheral blood mononuclear cells
PBMCs were isolated using Ficoll density gradient centrifugation method. Briefly, peripheral blood was diluted in equal volume of wash mix (RPMI 94%, FBS 5%, penicillin/streptomycin 1%). Diluted blood (2 ml) was carefully layered on 3 ml Ficoll reagent, followed by 30 min centrifugation at 1000 rpm. The buffy layer containing the PBMCs was collected and washed three times with wash mix. PBMCs were suspended in 1 ml freeze mix (wash mix, FBS 30%, DMSO 10%) and immediately frozen at −80 °C until use. An average of 8 million cells were isolated from each patient.
4.4. Serum separation and genotyping
Serum was separated by centrifugation of the blood samples and was collected and frozen at −80 °C until use. Serum was used for determination of the viral genotype. Genotyping was performed at the National Cancer Institute, using VERSANT® HCV Genotype 2.0 Assay (LiPa, Siemens Healthcare Diagnostics, USA) according to the manufacturer's instructions. Briefly, the 5′-UTR of the virus is amplified with biotinylated primers. Biotin-labeled PCR products are reverse hybridized to specific probes attached to nitrocellulose strips and then incubated with a chromogen. Results are developed in a purple precipitate that forms a line on the strip. The HCV genotype is inferred based on the patterns of hybridizing bands, using the line probe assay interpretation chart [24].
4.5. Cell culture and stimulation
Two different pools were prepared from the HCV infected PBMCs of the 20 patients and a third pool was prepared from the PBMCs of the 10 healthy controls by suspending the cells of the untreated HCV infected patients or those of healthy controls in culture medium (89% RPMI supplemented with l-glutamine, 1% penicillin/streptomycin, 10% FBS). PBMCs from each pool as well as non-pooled PBMCs from 6 individual patients were cultured overnight in a 24-well plate at a concentration of 1 × 10⁶ cells/ml/well. PBMCs were either left untreated, stimulated with 1500 IU/ml, 3000 IU/ml, 6000 IU/ml or 10 000 IU/ml of interferon α2a (Reiferon, Minapharm, Egypt) for 6 h or stimulated with 0.5 μg/ml, 1 μg/ml or 2 μg/ml of imiquimod R837 (Enzo Life Sciences, Germany) for 24 h. All experiments were done in duplicates.
4.6. RNA processing
MicroRNAs and messenger RNAs (mRNAs) were extracted from PBMCs using mirVanaTM miRNA Isolation Kit (Ambion, USA) according to the manufacturer's instructions. miR-146a and miR-155 as well as the housekeeping gene RNU6B were reverse transcribed into single stranded complimentary DNA (cDNA) using TaqMan microRNA reverse transcription kit (Applied Biosystems, USA). mRNAs were reverse transcribed using the high-capacity cDNA reverse transcription kit (Qiagen, Germany) following manufacturer's instructions.
4.7. Real time-polymerase chain reaction (PCR)
The relative expression of miR-146a and miR-155 were quantified using real time-quantitative polymerase chain reaction (ABI 7000, Applied Biosystems, Singapore) using TaqMan microRNA assay (Applied Biosystems, USA). The amount of miR-146a and miR-155 was calculated relative to the amount of the housekeeping gene RNU6B present in the same sample. The mRNA expression level of the studied gene, MxA, was quantified using TaqMan gene expression assays (Applied Biosystems, USA). The amount of MxA expression was calculated relative to the amount of mRNA expression of the housekeeping gene glyceraldehyde 3-phosphate dehydrogenase (GAPDH) in the same sample. Reactions were run in duplicates.
4.8. Statistical analysis
Gene expression is expressed in relative quantitation (RQ = 2−ΔΔCT). Results were expressed as mean ± standard error of the mean (SEM). Data were analyzed using Prism 5 software, version 5.00 (GraphPad Software, San Diego, CA). Mann––Whitney U test was used to draw comparisons between groups. Spearman test was used for correlation studies. P values less than 0.05 were considered statistically significant.
Acknowledgment
This work was supported by the Science and Technology Development Fund (STDF) grant 1785. We would like to acknowledge Dr. Jan Rohde from Rhein-Minapharm Company for providing us with interferon-α2a (Reiferon). All authors have read the journal's policy and there are no conflicts of interests to declare.
References
- 1.Chang J, Guo JT, Jiang D, Guo H, Taylor JM. Liver-specific microRNA miR-122 enhances the replication of hepatitis C virus in nonhepatic cells. J. Virol. 2008;82:8215–8223. doi: 10.1128/JVI.02575-07. [DOI] [PMC free article] [PubMed] [Google Scholar]
- 2.Jopling CL, Yi M, Lancaster AM, Lemon SM, Sarnow P. Modulation of hepatitis C virus RNA abundance by a liver-specific MicroRNA. Science. 2005;309:1577–1581. doi: 10.1126/science.1113329. [DOI] [PubMed] [Google Scholar]
- 3.Marquez RT, Bandyopadhyay S, Wendlandt EB, Keck K, Hoffer BA. Correlation between microRNA expression levels and clinical parameters associated with chronic hepatitis C viral infection in humans. Lab Invest. 2010;90:1727–1736. doi: 10.1038/labinvest.2010.126. [DOI] [PubMed] [Google Scholar]
- 4.Sarasin-Filipowicz M, Krol J, Markiewicz I, Heim MH, Filipowicz W. Decreased levels of microRNA miR-122 in individuals with hepatitis C responding poorly to interferon therapy. Nat. Med. 2009;15:31–33. doi: 10.1038/nm.1902. [DOI] [PubMed] [Google Scholar]
- 5.Murakami Y, Tanaka M, Toyoda H, Hayashi K, Kuroda M. Hepatic microRNA expression is associated with the response to interferon treatment of chronic hepatitis C. BMC Med. Genomics. 2010;3:48. doi: 10.1186/1755-8794-3-48. [DOI] [PMC free article] [PubMed] [Google Scholar]
- 6.Pedersen IM, Cheng G, Wieland S, Volinia S, Croce CM. Interferon modulation of cellular microRNAs as an antiviral mechanism. Nature. 2007;449:919–922. doi: 10.1038/nature06205. [DOI] [PMC free article] [PubMed] [Google Scholar]
- 7.Hou J, Wang P, Lin L, Liu X, Ma F. MicroRNA-146a feedback inhibits RIG-I-dependent Type I IFN production in macrophages by targeting TRAF6, IRAK1, and IRAK2. J. Immunol. 2009;183:2150–2158. doi: 10.4049/jimmunol.0900707. [DOI] [PubMed] [Google Scholar]
- 8.Wang P, Hou J, Lin L, Wang C, Liu X. Inducible microRNA-155 feedback promotes type I IFN signaling in antiviral innate immunity by targeting suppressor of cytokine signaling 1. J. Immunol. 2010;185:6226–6233. doi: 10.4049/jimmunol.1000491. [DOI] [PubMed] [Google Scholar]
- 9.Tang Y, Luo X, Cui H, Ni X, Yuan M. MicroRNA-146A contributes to abnormal activation of the type I interferon pathway in human lupus by targeting the key signaling proteins. Arthritis Rheum. 2009;60:1065–1075. doi: 10.1002/art.24436. [DOI] [PubMed] [Google Scholar]
- 10.Zhou H, Huang X, Cui H, Luo X, Tang Y. miR-155 and its star-form partner miR-155* cooperatively regulate type I interferon production by human plasmacytoid dendritic cells. Blood. 2010;116:5885–5894. doi: 10.1182/blood-2010-04-280156. [DOI] [PubMed] [Google Scholar]
- 11.Taganov KD, Boldin MP, Chang KJ, Baltimore D. NF-kappaB-dependent induction of microRNA miR-146, an inhibitor targeted to signaling proteins of innate immune responses. Proc. Natl. Acad. Sci. USA. 2006;103:12481–12486. doi: 10.1073/pnas.0605298103. [DOI] [PMC free article] [PubMed] [Google Scholar]
- 12.Kawai T, Akira S. Toll-like receptor downstream signaling. Arthritis Res. Ther. 2005;7:12–19. doi: 10.1186/ar1469. [DOI] [PMC free article] [PubMed] [Google Scholar]
- 13.Linnstaedt SD, Gottwein E, Skalsky RL, Luftig MA, Cullen BR. Virally induced cellular microRNA miR-155 plays a key role in B-cell immortalization by Epstein-Barr virus. J. Virol. 2010;84:11670–11678. doi: 10.1128/JVI.01248-10. [DOI] [PMC free article] [PubMed] [Google Scholar]
- 14.Hill JM, Zhao Y, Clement C, Neumann DM, Lukiw WJ. HSV-1 infection of human brain cells induces miRNA-146a and Alzheimer-type inflammatory signaling. Neuroreport. 2009;20:1500–1505. doi: 10.1097/WNR.0b013e3283329c05. [DOI] [PMC free article] [PubMed] [Google Scholar]
- 15.Ito M, Masumi A, Mochida K, Kukihara H, Moriishi K. Peripheral B cells may serve as a reservoir for persistent hepatitis C virus infection. J. Innate Immunity. 2010;2:607–617. doi: 10.1159/000317690. [DOI] [PubMed] [Google Scholar]
- 16.Nguyen MH, Keeffe EB. Prevalence and treatment of hepatitis C virus genotypes 4, 5, and 6. Clinic. Gastroenterol. Hepatol.: Official Clin. Pract. J. Amer. Gastroenterol. Assoc. 2005;3:S97–S101. doi: 10.1016/s1542-3565(05)00711-1. [DOI] [PubMed] [Google Scholar]
- 17.Zignego AL, Macchia D, Monti M, Thiers V, Mazzetti M. Infection of peripheral mononuclear blood cells by hepatitis C virus. J. Hepatol. 1992;15:382–386. doi: 10.1016/0168-8278(92)90073-x. [DOI] [PubMed] [Google Scholar]
- 18.Ito M, Masumi A, Mochida K, Kukihara H, Moriishi K. Peripheral B cells may serve as a reservoir for persistent hepatitis C virus infection. J. Innate Immunity. 2010;2:607–617. doi: 10.1159/000317690. [DOI] [PubMed] [Google Scholar]
- 19.Sidorkiewicz M, Grek M, Jozwiak B, Majda-Stanislawska E, Piekarska A. Expression of microRNA-155 precursor in peripheral blood mononuclear cells from Hepatitis C patients after antiviral treatment. Acta Virol. 2010;54:75–78. doi: 10.4149/av_2010_01_75. [DOI] [PubMed] [Google Scholar]
- 20.Grek M, Piekarska A, Bartkowiak J, Fendler W, Kuydowicz J. Coordinated increase of miRNA-155 and miRNA-196b expression correlates with the detection of the antigenomic strand of hepatitis C virus in peripheral blood mononuclear cells. Int. J. Mol. Med. 2011;28:875–880. doi: 10.3892/ijmm.2011.748. [DOI] [PubMed] [Google Scholar]
- 21.Rehermann B. Hepatitis C virus versus innate and adaptive immune responses: a tale of coevolution and coexistence. J. Clin. Invest. 2009;119:1745–1754. doi: 10.1172/JCI39133. [DOI] [PMC free article] [PubMed] [Google Scholar]
- 22.Kawai T, Takahashi K, Sato S, Coban C, Kumar H. IPS-1, an adaptor triggering RIG-I- and Mda5-mediated type I interferon induction. Nature Immunol. 2005;6:981–988. doi: 10.1038/ni1243. [DOI] [PubMed] [Google Scholar]
- 23.Roers A, Hochkeppel HK, Horisberger MA, Hovanessian A, Haller O. MxA gene expression after live virus vaccination: a sensitive marker for endogenous type I interferon. J. Infect. Diseases. 1994;169:807–813. doi: 10.1093/infdis/169.4.807. [DOI] [PubMed] [Google Scholar]
- 24.Stuyver L, Wyseur A, van Arnhem W, Hernandez F, Maertens G. Second-generation line probe assay for hepatitis C virus genotyping. J. Clin. Microbiol. 1996;34:2259–2266. doi: 10.1128/jcm.34.9.2259-2266.1996. [DOI] [PMC free article] [PubMed] [Google Scholar]
- 25.Yoneyama M.KM, Natsukawa T., Shinobu N., Imaizumi T., Miyagishi M., Taira K., Akira S., Fujita T. The RNA helicase RIG-I has an essential function in double-stranded RNA-induced innate antiviral responses. Nature Immunol. 2004;5:730–737. doi: 10.1038/ni1087. [DOI] [PubMed] [Google Scholar]
- 26.Samuel CE. Antiviral actions of interferons. Clin. Microbiol. Rev. 2001;14:778–809. doi: 10.1128/CMR.14.4.778-809.2001. table of contents. [DOI] [PMC free article] [PubMed] [Google Scholar]
- 27.Fenner JE, Starr R, Cornish AL, Zhang JG, Metcalf D. Suppressor of cytokine signaling 1 regulates the immune response to infection by a unique inhibition of type I interferon activity. Nature Immunol. 2006;7:33–39. doi: 10.1038/ni1287. [DOI] [PubMed] [Google Scholar]