Fig. 7.
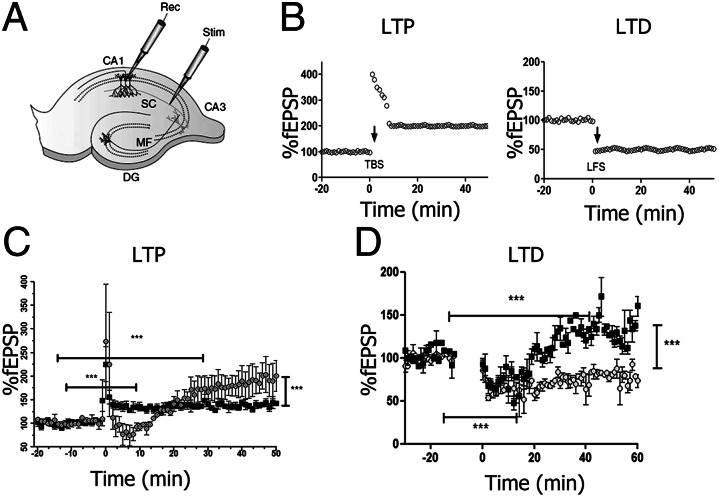
Impaired synaptic plasticity resulting from RSV infection. (A) Rat hippocampal slice preparation and typical electrode placements for studying synaptic plasticity at SC synapses onto CA1, showing the regions CA1, CA3, and the DG. DG, dentate gyrus; MF, mossy fiber; SC, Schaffer collateral; Stim, stimulating electrode; Rec, recording electrode. (B) Illustration of LTP and LTD in the CA1 region of the hippocampus. (C) LTP in the stratum radiatum of the CA1 region of hippocampus. Synaptic strength, defined as the initial slope of the fEPSP (normalized to baseline), is plotted as a function of time. Data in the graph show the LTP induction elicited by high-frequency tetanic stimulation (100 Hz stimulation for 1 s) for RSV-infected (■) or mock control ( ) rats. (D) LTD in the CA1 region of the hippocampus. Data in graph show the LTD elicited by low-frequency stimulation (5 Hz stimulation for 3 min given twice with a 3-min interval) for RSV-infected (■) or mock control (
 ) rats. (Scale bar, 0.5 mV, 10 ms.) Statistical analysis, unpaired t test; ***P < 0.0001, n = 7 slides, 4 rats for each group.

