
Fig. 2.
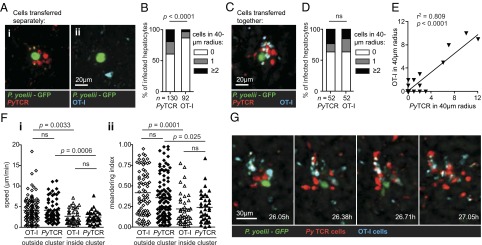
Interaction of specific and nonspecific CD8+ T cells with infected hepatocytes. (A) Labeled OT-I (9 × 10⁶) or 9 × 10⁶ labeled PyTCR cells were transferred to separate mice infected 20 h previously with 3 × 10⁵ PyGFP parasites and imaged 6 h later. Images show associations between infected hepatocytes and (i) PyTCR or (ii) OT-I cells. Images are maximal Z projections of 17 slices, each 3 μm apart. (B) Proportion of infected hepatocytes surrounded by different numbers of OT-I or PyTCR cells. P values are based on χ2 test [χ2(2) = 19.6]. (C) Experiment performed as in A, except that the OT-I and PyTCR effector CD8+ T cells were transferred together. Image is a maximal Z projection of 12 slices, each 5 μm apart, showing a cluster of OT-I and PyTCR cells surrounding an infected hepatocyte. (D) Proportion of infected hepatocytes surrounded by different numbers of OT-I or PyTCR cells; data from experiment described in C. P values are based on χ2 test [χ2(2) = 1.69]. (E) Correlation of the numbers of OT-I and PyTCR cells in clusters for all infected hepatocytes measured. (F) Speed (i) and meandering indices (ii) of OT-I and PyTCR cells within clusters or outside clusters around infected hepatocytes (cells transferred together). P values are based on Mann-Whitney U test; data pooled from five movies in two independent experiments. (G) Montage of T cell dynamics around an infected hepatocyte.