

Abstract
Mass spectrometry tools which allow for the 2-D visualization of the distribution of trace metals, metabolites, surface lipids, peptides and proteins directly from biological samples without the need for chemical tagging or antibodies are becoming increasingly useful for microbiology applications. These tools, comprised of different imaging mass spectrometry techniques, are ushering in an exciting new era of discovery by allowing for the generation of chemical hypotheses based on of the spatial mapping of atoms and molecules that can correlate to or transcend observed phenotypes. In this review, we explore the wide range of imaging mass spectrometry techniques available to microbiologists and describe their unique applications to microbiology with respect to the types of microbiology samples to be investigated.
Introduction
Despite substantial advances in the understanding of many microbial processes in recent years, the fundamental chemistry underlying these processes is often poorly characterized. For example, the intercellular communication that mediates bacterial biofilm formation, establishment of commensal microbial populations in a host, and cyanobacterial heterocyst differentiation are all driven by microbial-derived phenomena that are still weakly understood at the chemical level. Investigations into such processes are generally hindered by a lack of available tools to connect the underlying chemistry with specific microbial phenotypes. However, imaging mass spectrometry (IMS) approaches now enable us to begin to connect observations at the phenotypic level with specific changes at the chemical level1–6. IMS readily provides atomic and/or molecular information in two-dimensions and has the potential to characterize microorganisms at the molecular level in three dimensions. Although IMS was first demonstrated in the 1960's7, advances during the past 3–5 years suggest that IMS will have a substantial impact on the future of microbiology.
Imaging Mass Spectrometry – The basics
The allure of IMS is its ability to collect molecular `snapshots' of a given biological sample and superimpose this molecular information onto optical or fluorescence images. Furthermore, IMS has become even more accessible to microbiologists in recent years as a result of combining new sample preparation strategies and interfacing many different types of ionization sources with various types of mass spectrometers, resulting in a wide array of techniques offering unique approaches for specific chemical detection. The addition of a computer controlled xy-stage to the ionization source enables surface sampling of a biological specimen in a predefined motion where a mass spectrum, which represents a measurement of the local catalogue of chargeable molecules on the sample, is recorded at each sampling position and collectively creates a signature molecular map unique to each sample. After completing the 2-dimensional raster, an ion image is created by selecting a single mass from the mass spectrum and displaying its relative abundance as a false color scaling where the signal intensity at each sampling location (i.e. at each pixel in the image) is indicated by the intensity of the color within the pixel (Fig. 1). Once created, this ion image can be merged with additional masses (each represented with a different color scale) as well as superimposed onto a picture of the sample that was analyzed. This process is similar to multi-color fluorescence microscopy where one would pick the optimal wavelengths to display and the intensity of the signal in a given region is represented by brighter pixels in the false color image8. The difference between data representation of imaging mass spectrometry and fluorescence microscopy data is that while it is possible to observe as many as 8 discrete signals from one sample in fluorescence microscopy, imaging mass spectrometry data of a biological sample has the potential to contain dozens to thousands of unique signals. In addition, the resulting molecular distributions in the IMS images may hint at the function of the compounds which can be directly correlated to observed phenotypes such as compounds localized to zones of clearing in a bacterial inhibition assay having possible antibiotic properties or localization of environmental chemicals within the cell (i.e. N2 or CO2) helping to reveal the function of unknown cellular structures. Such images of the surface chemistry cannot be obtained by any other imaging method. However, IMS has only recently begun to be used in this fashion in microbiology and substantial challenges still exist with the interpretation of IMS data. Ion yields are also generally lower in IMS versus non-IMS measurements and these ion yields depend greatly on the sampling conditions. Therefore, it is crucial to recognize that while IMS may enable the formulation of a hypothesis, the molecular data still needs to be verified by other experimental means. With this review we do not aim to highlight current challenges or latest advancements in the field of IMS (for this we would like to refer the reader to many up-to-date reviews on this topic1–5,9–13). Rather we aim to inform the reader of the capabilities and characteristics of the different IMS ionization sources and the type of atomic or molecular information that can be gained from these techniques in the context of microbiological applications.
Figure 1. Overview of imaging mass spectrometry workflows.
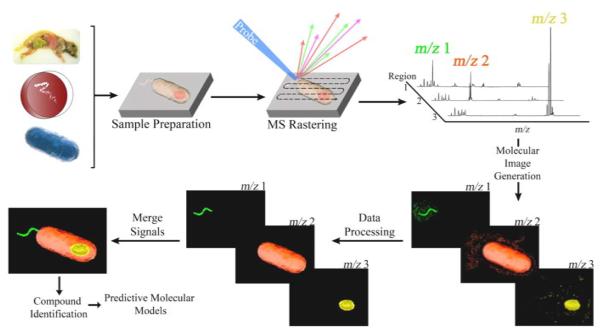
Microbial samples are prepared (i.e. cryosectioned, isolated, fixed) and mounted on a target surface after which additional preparation may be required, such as matrix application or drying. Software is then used to program a raster grid (for pulse based surface probes) or sampling path (for continuous based surface probes) across the surface of the sample. In an automated fashion, the mass spectrometer will then collect mass spectra from thousands of unique locations throughout the sample surface with each sampling location containing unique mass spectra. The collective data set is then combined into a single image where the relative intensity of individual compounds can be visualized using false color gradients. The data is then processed using software algorithms (e.g. data normalization, hot spot suppression, segmentation) in order to correct for pixel-to-pixel variability. The resulting molecular signals can then be merged with additional IMS signals or other types of data including fluorescence and optical images which can then be used to identify interesting compounds and begin building predictive models for biology.
Although a mass spectrometer is composed of many modular components (ionization source, mass analyzer, detector, etc), the choice of ionization source will have the most dramatic effect on the data obtained from IMS analysis since the unique ionization mechanism inherent in each ionization source bestows a certain chemical bias whereby certain classes of compounds will be preferentially ionized and therefore observed. In addition, the spatial resolution, time of analysis, amendable sample types and sample preparation will all be dependent on the ionization source used. For these reasons the mass spectrometer herein is treated as a generic detector that measures the weight of charged molecules based on their mass-to-charge ratio (m/z). Although many different types of ionization sources have been developed14–17, those used in microbiology IMS applications thus far have been dynamic secondary ion mass spectrometry (SIMS), static SIMS, matrix assisted laser desorption ionization (MALDI), laser desorption ionization (LDI), desorption electrospray ionization (DESI), nanospray DESI (nanoDESI) and laser ablation inductively coupled plasma (LA-ICP) with most being coupled with a range of mass analyzers (Fig. 2). It should be noted that not all mass spectrometers, especially those used for SIMS, have tandem MS (fragmentation) capabilities to aid in compound identification; however, most modern commercial instruments do have this functionality. From analysis of single cells to complex microbial communities, we will now explore the type of information that can be learned from each application using the different IMS techniques.
Figure 2. Overview of various surface scanning probes used for IMS analysis of microbial samples.

Each ion source offers unique benefits and challenges that grant each technique a unique niche in microbial research. The descriptions above represent the abilities of each ion source under typical configurations. Also note that while mounting surfaces for each source are typically conductive or non-conductive, the samples themselves can usually be conductive or insulating. Abbreviations: AP (atmospheric pressure), IP (intermediate pressure), UHV (ultra high vacuum), HV (high voltage), MS (mass spectrometer), DHB (2,5-dihydroxybenzoic acid), CHCA (α-cyano-4-hydroxycinnamic acid), UV (ultra-violet), VUV (vacuum ultra-violet), IR (infrared), TOF (time-of-flight). A. The incident angle of the primary ion beam in the Cameca NanoSIMS 50 and 50L is normal to the sample surface (as opposed to 40° as shown) B: Static SIMS is typically stated as being able to detect compounds up to 10,000 Da; however, detection intact molecules above 1,500 Da from biological samples is rarely reported due to source induced fragmentation.
Single cell and subcellular analysis
Single microbial cells occupy a wide range of sizes from the mycoplasma cell with a diameter of about 100–200 nm (one of the smallest bacteria whose genome has been sequenced18), to Thiomargarita namibiensis whose cells can grow as large as 750 μm in diameter. However, most microorganisms commonly exhibit cell sizes between 0.5 to 5μm in diameter. At the present time, only dynamic SIMS has been shown to have sufficient resolution to study individual bacteria cells with spatial resolutions below 50nm. Other methods such as static SIMS, LDI, LA-ICP, MALDI and DESI are not capable of such high resolutions with recorded resolutions for these methods currently being 0.1, 2.5, 5, 4 and 40 μm, respectively19–23; however, achieving these spatial resolutions is far from routine. The primary challenges in achieving small spatial resolutions is the large physical diameter of the probing beam itself as well as the inverse relationship between spatial resolution and ion yield. Across all ionization sources, as the area sampled by the probe becomes smaller, the number of atoms or molecules capable of being desorbed decreases therefore producing less total ion current (a.k.a. signal). In addition, each ionization source exhibits its own unique challenges and limitations that need to be taken into consideration (Fig. 2, Table 1).
Table 1.
Analytical values of merit for various surface scanning probes used for IMS analysis of microbial samples
| Mass Range (Da) | Resolution (μm) | Probing Depth (μm) | Commercialized? | Price | |
|---|---|---|---|---|---|
|
|
|||||
| Dynamic SIMS | 1–100 | 0.03–0.5 | 0.5–10 | Cameca Hiden Analytical Millbrook Instruments Physical Electronics | $300k–$2,500k |
| Static SIMS | 100–1,500 | 0.5–50 | 0.001–0.01 | ionTOF Ionoptika Physical Electronics Kore Technology | $400k–$1,500k |
| LA-ICP | 50–500 | 1–10 | 0.1–20 | Applied Spectra Gammadata Waters Thermo | $150k–$300k |
| LDI | 100–5,000 | 1–500 | 0.1–50 | Bruker Applied Biosystems Shimadzu Waters | $250k–$800k |
| MALDI | 300–50,000 | 50–500 | 0.1–20 | Bruker Applied Biosystems Shimadzu Waters | $250k–800k |
| DESI | 100–5,000 | 100–1,000 | 1–500 | Prosolia | $40–60k* |
| nanoDESI | 100–10,000 | 10–1,000 | 0.1–10 | - | $10k* |
Price for ionization source only.
Values in table are not extremes but rather approximations based on common reported literature values, input from experts in the field and personal experience.
Dynamic SIMS
SIMS imaging was invented in the 1960's and produces analyte ions from a sample surface by bombardment of that surface with high energy particles (called primary ions) which then produce secondary ions, through a process known as sputtering, which are then guided into the mass spectrometer for analysis7,24. SIMS provides trace (ppm) and ultra-trace (ppb) level elemental analysis and even limited molecular information of the sample surface. Despite being used for imaging mass spectrometry for over 40 years, the highly energetic ionization process of SIMS analysis limits it to lower mass ranges in biological imaging applications25.
SIMS techniques usually fall into two discrete categories, static and dynamic SIMS, with a third description, NanoSIMS, referring to dynamic SIMS analysis using a modern instrument design with improved ion optics allowing for sub-50nm pixel sizes, enhanced sensitivity and simultaneous detection of up to 5–7 mass signals26,27. The difference between static and dynamic SIMS is that in static SIMS the primary ion count is low enough so that each primary ion impacts an undisturbed area of the sample resulting in roughly 1% of the uppermost surface monolayer being sampled whereas dynamic SIMS floods the surface with primary ions resulting in total sampling of the upper monolayers of the surface. Additionally, samples for SIMS can be coated with a matrix similar to MALDI in order to enhance ionization and to observe a wider range of compounds28,29. SIMS instruments can also perform depth profiling experiments by etching away the sample surface with the primary ion beam in order to determine molecular distributions beneath the surface layer.
Due to the local chemical environment having large effects on ionization of each analyte, the intensity of ion signals observed using SIMS are normalized to an abundant element in surrounding environment (e.g. 12C) whose concentration is assumed constant. The resulting data is displayed as a ratio of the two molecular species in order to account for spot-to-spot intensity variability commonly observed in IMS. For example, dynamic SIMS depth profiling of Bacillus thuringiensis israelensis spores (Fig. 3A–C) showed that phosphorous (reported as a 31P−/12C− ratio) was localized to the center of the spore while chlorine (reported as a 35Cl−/12C− ratio) was found in the outer coat (Fig. 3C)30. The atomic or atomic cluster information produced by dynamic SIMS enables for creative experimental designs exploiting naturally low abundant isotopes, such as 15N and 13C, in order to provide insight into the C and N metabolism of microbes by observing changes in the ratio of elemental isotopes as a result of incorporation of 15N and 13C from labelled media31–43. The high spatial resolution of dynamic SIMS (sub-50 nm) can provide both morphological and chemical classification data for individual cells. For example, in single filaments of the nitrogen-fixing bacteria Anabaena oscillarioides, sites of new heterocyst formation could be differentiated from vegetative cells by detecting decreased amounts of nitrogen and phosphorous in the neck region of the cell (Fig. 3D)32.
Figure 3. Examples of subcellular imaging mass spectrometry.

(A–C) Dynamic SIMS imaging of a single Bacillus thuringiensis israelensis spore30. (A) SEM image of an individual spore mounted on Si wafer. (B,C) Using a Cs+ primary ion beam, depth profile analysis (B) and surface profiling analysis (C) was performed to analyze P and Cl distribution through the spore. (DI-DIV) Dynamic SIMS imaging of nitrogen fixation and metabolite exchange between neighboring Anabaena oscillarioides cells within a single filament containing a heterocyst (Het) and two vegetative cells (Veg 1,2) as seen in the SEM image (IV)32. SIMS Images show high levels of carbon (I) in throughout the filament but low levels of nitrogen (II) and phosphorous (III) in the neck region between the heterocyst and vegetative cell.
IMS of microbial monocultures
Performing imaging mass spectrometry at the subcellular level presents challenges including the requirements for an operator with a high level of expertise and costly instrumentation, which have resulted in few investigations of microbial cells. However, IMS analysis of microbial colonies several millimeters in diameter are much more common and can be performed with a wider array of ionization sources capable of providing not only atomic content but also molecular information. To date static SIMS, dynamic SIMS, MALDI, LDI, LA-ICP, LDPI and DESI-IMS have all been employed to analyze monocultures from liquid and agar media including firmicutes, actinobacteria, cyanobacteria and even fossilized archaea32,33,42–48. Owing to the numerous mass spectrometer and ionization source combinations, these imaging technologies are capable of tackling an impressive range of biological questions including how microbes fix nitrogen.
Many filamentous cyanobacteria, such as Trichodesmium, fix nitrogen from the atmosphere in order to incorporate this essential element into amino acids, nucleotide bases and many cellular metabolites. However, the mechanisms by which these cyanobacteria are able to fix nitrogen in the absence of heterocysts, the nitrogen fixing cells found in many filamentous cyanobacteria, remained a mystery. Dynamic SIMS-IMS analysis (with a sub-50nm spatial resolution) of single Trichodesmium filaments grown in the presence of 15N2 and NaH13CO3 indicated that not only was the assimilated 15N2 and 13CO2 stored in discrete storage bodies in the cell (Fig. 4A–B), but that these assimilation processes were temporally decoupled from other major metabolic processes in the filament as assimilation took place during light periods and conversion into biomass occurred during dark periods33. Similar methods using the display of 14N/15N after exposure to 15N2 suggested that active nitrogen fixation by the marine bacterium Teredinibacter turnerae is not uniformly carried out by every cell, which is in agreement with the hypothesis that even in a monoculture of microbial cells, individual cell populations are differentiated to perform specific tasks41.
Figure 4. Examples of imaging mass spectrometry on single and interacting colonies.

(A–B) Dynamic SIMS of a single Trichodesmium filament after an 8 hour incubation with 15N233. (A) Arrows indicate areas of correlation between discrete areas of nitrogen uptake observed in the dynamic SIMS image (bottom) and cyanophycin granules identified by the TEM image (top). (B) SIMS depth profile through 2 individual cells of a filament exposed to 15N2 for 8 hours. White circle indicates cyanophycin granule that does not appear in subsequent images and red circles indicate a cyanophycin granule that is resolved with increasing depth. (C) MALDI imaging of Bacillus subtilis Py79 and ΔSpo0A colonies on dried nutrient agar using Universal MALDI matrix (Sigma-Aldrich Cat. No. 50149), which is a 1:1 mixture of 2,5-dihydroxybenzoic acid and α-Cyano-4-hydroxycinnamic acid matrices59. MALDI images showed induction of the possible cannibalistic factors sporulation killing factor (SKF) and sporulation delaying protein (SDP) in strain Py79 by strain ΔSpo0A (CI: MALDI IMS images, CII: MALDI IMS images overlay with optical images). To confirm the identity of SKF as the ion at m/z 2782, an IPTG inducible promoter was placed in front of the skf gene and subsequent MALDI imaging.
Static SIMS
Static SIMS49,50, also referred to as TOF-SIMS as it is usually paired with a TOF mass analyzer, provides more gentle ionization thanks to lower primary ion yields and atomic cluster based primary ion guns, including the C60+, Au3+ and Bi3+ sources, that allow for less source induced fragmentation, thus yielding molecular information beyond 1500 Da. However, the decrease in primary ion current results in lower sensitivity which is normally compensated for by sampling a larger impact area, which in turn decreases the spatial resolution. Although spatial resolutions for static SIMS-IMS have been reported to be as good as 100 nm19, in practice typical resolutions are on the order of 1 to 5 μm. Sputtering also yields considerably less secondary ions per primary ion collision in static versus dynamic SIMS due to lower primary ion current and makes quantitative analysis more unreliable. However, despite the loss in resolution and quantitative ability, the addition of molecular information provides valuable insight into microbial metabolic processes.
As a proof-of-principle experiment to demonstrate the ability of static SIMS-IMS to detect intact molecules from a microbial sample, bacterial filaments of the soil bacteria Streptomyces coelicolor were analyzed using a C60+ primary ion beam at 2 μm lateral resolution45. Static SIMS was able to capture signals from intact and structurally robust molecules such as prodiginine, a tripyrrole, and the largely intact actinorhodin, a polyketide, which exhibited limited source induced fragmentation. These molecules were observed to be associated with the filamentous structures observed in the culture and subsequent depth analysis provided data suggesting that the blue pigment actinorhodin was primarily produced on the filament surface while the red pigment prodiginine was produced throughout the filament. Although these findings simply confirmed earlier evidence acquired using non-mass spectrometry methods, it does demonstrate the capability of such a tool to be used in detecting a variety molecular species in microbial samples in a single dataset.
When planning an IMS experiment using SIMS, it is good to keep in mind that cells typically need to be isolated and mounted on a conductive surface prior to analysis as it is not yet possible to routinely image a microbial colony directly from agar based media with static or dynamic SIMS. While this sort of sample preparation was used in the aforementioned study involving S. coelicolor as well as in another study where the antimicrobial agent chlorchexidine-digluconate was imaged using static SIMS on frozen colonies of Candida albicans51, imprinting has also been used to image the molecular composition of a microbial colony on agar media. A good example of this is a study where a single colony of the swarming bacteria B. subtilis from agar based media was imprinted onto a silicon wafer and subjected to static SIMS-IMS at a spatial resolution of 2 μm44. The lipopeptide surfactin was found to be heavily localized to the edges of the colony, which is in agreement with the role of surfactin in promoting swarming. Although this study did not describe any other molecular signals that may be present on the microbial colony, it represents an important advance for SIMS to visualize intact molecules of this size from microbial samples.
Desorption electrospray ionization IMS
Like static SIMS, DESI-IMS has currently not shown to be able to observe molecular signals from bacterial colonies directly from semi-solid agar due to the soft and absorbent nature of the growth media. However, it has been used to image colonies of B. subtilis and S. coelicolor through an imprinting technique52. DESI is an atmospheric pressure ionization technique that uses a pneumatically assisted stream of charged solvent to desorb molecules from a sample surface based on their ability to be taken up by the solvent in the time between initial impact and secondary droplet desorption53–55, which in practice essentially resembles a micro-scale power washer. Since analytes soluble in the solvent used will be preferentially desorbed and introduced into the mass spectrometer, this property can be exploited to simplify or enrich the mass spectra with specific molecular targets or classes of molecules. Although not yet applied to microbial samples, reactive imaging is also possible where a compound can be added to the spray solvent capable of reacting with the analyte of interest allowing one to monitor the product of the reaction. This is usually done to increase the ionization yield of the target analyte or to isolate a specific isomer from a family of compounds56,57.
Initial attempts to image bacterial colonies from hydrated and dried agar using DESI were hindered as a result of the pneumatic pressure required for ionization resulting in the destruction of the agar surface as well as the bacterial colony itself. Thus, similar to previous SIMS protocols44, an imprint of the colony was taken using a hydrophilic membrane52. DESI-IMS on an imprint of a single B. subtilis 3610 colony produced intact molecular ions of surfactin, plipastatin and glycerophospholipids, which were associated with the bacterial colony and were detected at a spatial resolution of 250 μm. As a result of the imprinting method, information regarding the molecules that were secreted into the surrounding growth media by B. subtilis was limited due to a substantial decrease in the efficiency of metabolite transfer to the hydrophilic membrane from the agar media when compared to the colony itself. In addition, while the imprinting approach used with DESI and SIMS lead to enrichment of specific molecules, it also lead to the absence of signals that may be observed via more direct methods. For instance, molecules such as subtilosin and cannibalistic factors can readily be detected in B. subtilis by MALDI-IMS58,59 but not with the DESI or SIMS imprints.
A recent modification of DESI, termed nanoDESI60, has shown great promise in the field of microbial research. NanoDESI is a cost-effective solution to IMS of microbial samples. NanoDESI requires no carrier gas and instead uses a nanoliter size liquid junction where surface sampling can occur. This is achieved by closely aligning a pair of fused silica capillaries at approximately 45° angles thus creating a small void between them (Fig. 2). Solvent is delivered to the junction via a nanoliter flow pump and is removed from the junction by the secondary capillary via capillary action, thus pulling the solvent (as well as desorbed analyte) to its terminal end where the solvent electrosprays into the mass spectrometer. This push-pull liquid handling mechanism at the junction creates a steady state liquid droplet that can essentially be rolled across the surface of the sample while steadily desorbing analyte based on its solubility in the solvent used. By not requiring a high pressure nebulizing gas, nanoDESI is able to image live microbial colonies growing on hydrated nutrient agar directly from the Petri dish with absolutely no sample preparation (unpublished).
When considering using DESI and other related techniques, it should be noted that these techniques are at an early stage in both their experimental and computational development when compared to MALDI or SIMS instrumentation and protocols. While these techniques will certainly continue to improve and become more established, their current state displays issues with interlaboratory data reproducibility and overall repeatability.
Matrix-assisted laser desorption ionization IMS
At present, MALDI-IMS is the most versatile in its application for the characterization of microbial monocultures such as cyanobacterial filaments, bacterial colonies and their biofilms58,59,61,62. MALDI was first used to image biological samples in the late 1990's and is described as a soft ionization technique that allows for the analysis of large intact biomolecules that would normally fragment under harsher sampling conditions63. Samples analyzed by MALDI must be uniformly coated by a chemical matrix, which is typically an organic acid capable of absorbing the UV light produced by the instruments laser (330–360 nm). During analysis, the sample surface is ablated using a UV laser, whose energy is absorbed by the matrix which then aids in desorption and ionization of analyte compounds on the surface. Although MALDI has been shown to be able to detect intact molecules as large as 1.5 million daltons64, the complex surface chemistry inherent in intact biological samples limited the observable mass range to less than 80 kDa.
MALDI has enabled the characterization of microbial colonies or filaments down to a resolution of 100 μm, although in most cases, especially when monitoring microbial metabolic exchange between colonies, a resolution of 200–300 μm is sufficient. Sample sizes for MALDI range from a few mm2 to above 2500 mm2, limited only by the size of the MALDI target plate. To analyze microbial colonies by MALDI mass spectrometry, microorganisms are grown on a 0.5–1.5 mm layer of agar for a defined period of time before they are covered with a matrix and subjected to IMS58. The addition of matrix does however produce high background signal below m/z 300 limiting the ability to detect low mass signals and appreciable pixel-to-pixel variability limits quantitative analysis. Additionally, certain agars high in salt or sugar content may prove difficult to analyze due to ion suppression or uneven matrix crystallization. Nevertheless, our laboratory has imaged more than 150 microorganisms on agar media ranging from soil bacteria, to blood pathogens, to fungi as a result of a reproducible and straightforward sample preparation protocol where a solid matrix is sprinkled through a 20–100 μm sieve directly onto the hydrated agar. This protocol has not only allowed for the comparison of metabolic output of mutants with their respective wild types, but also for the formulation of hypotheses from IMS data that have ultimately resulted in isolation and structure elucidation of novel compounds58,59,61,62. The reproducible nature of the sample preparation also allows for time course experiments in which the metabolic output of multiple samples of the same microorganism can be evaluated and compared over time58,62. MALDI based IMS also provides soft ionization enabling the detection of intact biological molecules such as jamaicamide, curacin and curazole from Lyngbya majuscalide61 and enabled the detection and subsequent mass spectrometry guided isolation of the cannibalistic factors sporulation killing factor (SKF) and the mature form of the sporulation delaying protein (SDP) from B. subtilis59.
Laser ablation inductively coupled plasma IMS
Another area of interest to biologists is the distribution of metals in biological systems. LA-ICP provides analysis of atomic distributions across the surface of a sample at the parts per million to parts per billion level and has been found to be especially useful in the detection and quantitative analysis of metal content in biological samples65. In LA-ICP, surface material is initially ablated using a UV laser where the resulting ion plume is carried into an argon plasma source via an argon or argon-helium mixture carrier gas, which can reach temperatures up to 10,000K. At these temperatures, compounds are broken up into their atomic components and ionized by removal of loosely held electrons. Therefore, LA-ICP produces atomic information (7 to 250Da) and the high ionization efficiency allows for quantitative imaging under certain circumstances. LA-ICP-IMS has been used to characterize the metal content of a bacterial colony in a spatial manner where it has shown that E. coli has the highest signal of iron, magnesium, copper and zinc in the center of the ~1.5mm wide colony46. Studying the roles of metals in a spatial and system-wide fashion is of underappreciated importance to biology66 and LA-ICP-MS, together with dynamic SIMS, are some of the very few tools with such capabilities.
Laser desorption ionization IMS
LDI functions by using a UV laser to ablate compounds from the sample surface. Unlike MALDI where an organic matrix is deposited on the surface of the sample and used to absorb and transfer the energy from the laser to the analyte to induce ionization, LDI works when the molecules of interest contain a chromophore capable of absorbing the wavelength of energy produced by the laser to assist in the desorption and ionization process. The laser energy in LDI that is required to desorb molecules is, in general, more powerful than when a matrix is used leading to increased source induced fragmentation of molecules upon desorption. An adaptation of LDI is laser desorption post ionization-mass spectrometry, or LDPI-MS67, which has been used to study antibiotics, such as rifampicin, from a biofilm of Staphylococcus epidermidis68 as well as the ERGMT quorum sensing peptide produced by B. subtilis47. This method essentially separates the desorption and ionization steps by the addition of a vacuum ultra-violet (VUV) single photon ionization synchrotron radiation source for postionization of gaseous neutral ions after the initial desorption step. As with LDI, analytes in the gaseous plume still need to be able to absorb the energy from the VUV source. However, ionization after desorption does result in more consistent signal due to minimization of effects of the local chemical environment.
IMS of two interacting organisms
In their natural setting, microorganisms do not typically exist as microbial monocultures but instead interact with other organisms through contact or the secretion of molecules that range from small molecules such as metal ions and metabolites to larger molecules such as peptides, RNA, DNA and proteins. Both MALDI58 and DESI-IMS52 have been used to observe the multiplexed nature of metabolic exchange between B. subtilis (strains Py79 and 3610), and S. coelicolor69. MALDI-IMS demonstrated that prodiginines and other metabolites were upregulated, while both the morphogen SapB and calcium dependent antibiotics (CDA) in S. coelicolor were suppressed. Negative mode DESI revealed that surfactin controls the production of actinorhodin by S. coelicolor as well as induction of bacilysocin in B. subtilis at the interface of the two colonies, which was not observed by MALDI. These results indicate that bacteria do not only secrete antibiotic type compounds, such as the lipopeptide surfactin, to kill nearby organisms but also to silence the defensive arsenal of neighboring species.
MALDI imaging was also used to determine the identity of cannibalistic factors in Bacillus subtilis59,70,71. Bacillus subtilis strains Py79 and ΔSpo0A were allowed to interact on nutrient agar followed by MALDI-imaging which revealed the cannibalistic factors SKF and SDP in strain Py79 (Fig. 4C). To confirm the identity of SKF, an IPTG inducible promoter was placed in front of the skf gene and subsequent MALDI imaging with and without IPTG. This analysis revealed that SDP and not SKF, as previously thought, possesses the greatest cannibalistic killing effect. SDP was also shown to inhibit growth of the bacterial pathogens Staphylococcus aureus and Staphylococcus epidermidis.
A creative use of IMS was demonstrated with the analysis of nitrogen fixation by anaerobic methane-oxidizing archaea and their ability to share the products with sulfate-reducing Desulfosarcina and Desulfococcus34. The microorganisms, isolated from the Eel River Basin in California, were grown under 15N2 and the resulting IMS analysis revealed that not only did the archaea fix nitrogen, but also that the fixed nitrogen is passed on to other bacteria. Since dynamic SIMS does not provide intact molecular information, it is not yet known which molecules are responsible for the transfer of the fixed nitrogen. One of the main challenges with the above analysis of communities by SIMS is that signals are correlated to undefined bacteria present in the sample. To address this challenge, additional methodologies have been developed that combine SIMS-IMS with biological probing techniques such as fluorescence in situ hybridization (FISH). In this method, one can use SIMS to detect the halogen signatures from the FISH probes and to characterize the chemical environments where specific microbes are present in the sample34,35,72–75.
IMS of microbial communities
SIMS has also been employed in the study of microbial communities. Soil was isolated from a field and fed 15N, and 13C labelled substrates to readily distinguish metabolically active organisms versus organisms that were unable to take up these substrates39. The soil was smeared onto a silicon wafer and subjected to dynamic SIMS-IMS. The resulting data showed an uneven distribution of the labels in soil that could be the result of differences in bacterial uptake, availability of the substrates, or cross-feeding and mixotrophy; although this has to be confirmed by non-IMS approaches76. Dynamic SIMS was also used in conjunction with FISH to show phylogenic identification as well as metabolic activities of a microbial community in soil74. A fluorinated probe specifically for Cytophaga-Flavobacteria following a 3-hour incubation period with 13C-labeled amino acids, suggested that the Cytophaga-Flavobacteria were metabolizing the amino acids. Lastly, FISH was performed on C. clathratiforme containing consortia that was fed 15N-ammonium and 13C-bicarbonate with 19F-labeled tyramines and subjected to dynamic SIMS analysis36. This analysis revealed that although C. clathratoforme is the most abundant species it was not the assimilator of the nitrogen and carbon.
Static SIMS imaging has been applied to imaging of lipid signatures from methanotropic microorganisms in sections of a microbial mat77. SIMS images showed spatial localizations of archaeol and related lipids. Static SIMS imaging has also been applied to microorganisms in soil samples imprinted on a Si wafer. For example, 15N assimilation in bacterial and fungal hyphae inhabiting soil was measured (Fig. 5)38. Currently IMS studies are performed on either cultured microbial communities or laboratory maintained microbial communities with none performed on communities as found in nature; a crucial area of microbiology in which IMS can be advanced.
Figure 5. Example of imaging mass spectrometry on microbial communities.
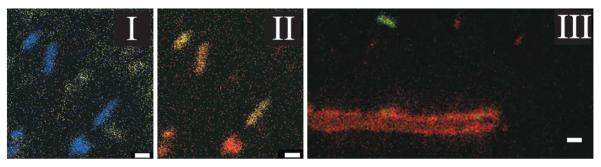
Static SIMS imaging of microbes within soil samples imprinted on a Si wafer38. Using a Ga+ primary ion gun, 15N assimilation in bacterial samples (I and II) and fungal hyphae (III) was measured. (I) The combined signal of 26CN− and 27CN− in rod shaped bacteria are shown in blue while SiO−, indiciative of inorganic soil material, is shown in yellow. (II) The combined 26CN−/27CN− signal from (I) is separated into 26CN− (red) and 27CN−(green) to show 15N uptake. (III) 15N uptake in neighboring fungal hyphae is shown with 26CN− displayed in red and 27CN− displayed in green.
IMS of complex systems
A variety of ionization sources have also been used to study host-microorganism interactions with each method providing different molecular viewpoints on these dynamic relationships. In one study, MALDI-IMS provided new insights into host response to an invasive MRSA infection in a mouse model system while LA-ICP-IMS revealed that a human copper chelating protein was involved in the defense against pathogen invasions78. In another study, dynamic SIMS was used to observe chlamydia cells invading an amoeba through the demonstration that the chlamydia cells had taken up 13C-labeled phenylalanine76. In addition, dynamic SIMS was used to show that nitrogen fixation was taking place by Teredinibacter turnerae bacteria in the gills of the shipworm Lyrodus pepedicellatus (Fig. 6A)40.
Figure 6. Examples of imaging mass spectrometry on host-microbe interactions.

Dynamic SIMS analysis of nitrogen fixation of Teredinibacter turnerae and other bacterial symbionts in the gill region of the shipworm Lyrodus pedicellatus40. The image is represented as a mosaic of 100μm × 100μm tiles using a Cs+ primary ion beam. Shipworms were exposed to 15N labeled N2 with subsequent SIMS imaging showing high levels of 15N incorporation in the gland of Deshayes and the bacteriocytes. (B) MALDI IMS analysis of the microbial symbionts inhabiting Acromyrmex echinatior leaf-cutting ants79. Left shows optical image of worker ant mounted on MALDI target plate with the red circles indicating spots of valinomycin standards. MALDI image to the right showing distribution of valinomycin (produced by Streptomyces symbionts) on the integument of the ant.
IMS has also been applied to the investigations of environmental samples and the habitats of higher organisms that are colonized by microorganisms. Examples include MALDI-IMS analysis of marine sponges61, leaf cutter ants79 and LDI-IMS of microbial derived antibiotics found in Beewolf wasp cocoons80. Marine sponges are very complex microbial environments with as much as 40% of a sponge's mass being of microbial origin. MALDI-IMS analysis of a cryosectioned sponge enabled the observation of many molecular species and confirmed a previous observation that Disedea sponges contain chemical microenvironments due to the presence of a large number of microorganisms61. DESI-IMS has also been employed to study the microbial defenses of the red alga Callophycus serratus against pathogenic microorganisms81, where it was shown that bromophycolides A and B were present in the algal tissue as well as localized to “pale patches” on the seaweed surface at concentrations sufficient enough to inhibit growth of Lindra thalassiae.
Several investigations of microbial small molecules from a minimally perturbed environmental sample have been performed. The presence of a cocktail of defensive compounds secreted from Streptomyces colonizing the exterior of a wasp cocoon was demonstrated via LDI80. Beewolf wasps cultivate Streptomyces symbionts which are transferred to the larvae, and that during cocoon development they secrete a cocktail of antibacterial molecules. This protective mixture of compounds produced by Streptomyces is transferred to the cocoon where they form a potent multi-component antimicrobial defense. Similarly, MALDI-IMS was employed to study secreted compounds of microbial symbionts located on the exoskeletons of leaf-cutting ants (Fig. 6B)79. These symbionts, Pseudonocardia and Streptomyces, were found to produce antibiotic and antifungal compounds that helped shape the microbial landscape of the ant nest and protect their primary food supply of Leucoagaricus gongylophorus from contamination. The last two studies also showcase the ability of LDI and MALDI, in contrast to SIMS and DESI applications, to tolerate imaging of non-smooth sample surfaces.
Conclusion and outlook
The current catalogue of IMS techniques represents a powerful set of tools that allow microbiologists to study the chemotypes inherent within their biological systems in ways never before possible. As each technique provides unique molecular information, researchers are presented with a variety of workflows to fit their research needs. While many IMS studies reviewed here were largely applied to proof-of-principle type experiments, IMS approaches are currently the only discovery tools that enable an investigator to formulate hypotheses regarding the chemical nature of microorganisms based on 2D and 3D atomic/molecular images. IMS is therefore providing insight into an incredibly complex, but largely invisible, molecular world and thus provides inroads into observing the multiplexed nature of spatial systems microbiology.
Box 1: Alternate Imaging Techniques.
Magnetic Resonance Imaging (MRI): an in vivo imaging technique that measures the radio frequency emissions of excited nuclei within an electromagnetic field and is mainly used to differentiate between different tissue types. MRI has been used to influence bacterial chemotaxis82, detect bacteria labeled with superparamagnetic nanoparticles83 and image areas of bacterial meningitis within the human body84.
Atomic Force Microscopy (AFM): AFM is a non-chemical specific surface imaging technique where a cantilever with a sharp metal probe is ran across the samples surface while a laser measures the upwards deflection of the tip85. This imaging technique offers picometer spatial resolution and unlike EM is capable of collecting images in open air and under liquid. Since bacteria cells do not adhere strongly to surfaces, cells typically have to be embedded and mounted before analysis.
Immunohistochemical staining (IHC): IHC is capable of detecting specific compounds (especially proteins and DNA) through the addition of a labeled substrate to the sample that will specifically bind to a discrete target compound. Depending on the label used, visualizing the antibody-antigen pair can be done through optical or fluorescence imaging. These assays are fast and sensitive but require previous knowledge of the system as each label is specific to its target.
Autoradiography: Autoradiography records the distribution of radiolabeled isotopes within a biological sample. In bacteria, this sensitive technique has been used to study metabolic pathways by using radiolabeled media; however, dynamic SIMS imaging is quickly becoming an attractive alternative to this technique. When applied to soil ecophysiology, this technique combined with FISH was able to correlate specific nutrient uptake with the identity of the microbe86. Similar experiments have been done using FISH and SIMS IMS34,35,72–75.
Bioluminescence: Bioluminescence is a naturally occurring phenomenon in certain bacteria where the breakdown of luciferin substrates by luciferase enzymes causes the self-emission of visible yellow-green light. The genes encoding these luciferase enzymes can be cloned and transferred to non-bioluminescent organisms which can then be probed by the addition of luciferin substrates to the media in order to check for gene expression (this is also called a firefly assay as firefly luciferase is commonly used). This kind of assay is limited in mammals as the light emitted from the assay is strongly absorbed by hemoglobin.
Fluorescence imaging: Fluorescence imaging is a very popular and powerful technique that can be utilized in a multitude of ways such as in fluorescence in situ hybridization (FISH), where a fluorescently labeled probe can bind to a specific DNA or RNA sequence allowing you to target your microbe of interest, and green fluorescent protein (GFP) labeling, where a reporter gene encoding GFP is inserted into the promoter region of your gene of interest allowing for the real time monitoring of gene expression within a living cell. GFP can also produce different colors of light allowing for simultaneous detection of multiple compounds.
Acknowledgements
We would like to thank Julia Laskin (PNNL) and Victoria Orphan (CalTech) for providing comments on the SIMS sections. The Dorrestein laboratory is supported by NIH grants GM094802, GM086283, AI095125 and the Beckman foundation and Jeramie Watrous is supported by the NIH MBTG (GM08326).
Glossary of Terms
- Ionization source
the portion of the mass spectrometer that produces ions from a chemical surface and introduces them into the mass analyzer
- xy-stage
a motorized platform within the ionization source, on which the sample is mounted, capable of computer controlled motion in the x-y coordinate plane
- Mass spectrum
a 2-dimensional plot of intensity versus mass to charge ratio (m/z) for all ions detected per each individual mass measurement
- False color image
a 2-dimensional display of imaging data where an ions signal intensity at a given location within the measurement area is represented by its color intensity of its representative pixel as per the color scale used
- Time-of-flight (TOF)
a mass analyzer that separates ions based on the time it takes them to traverse a defined flight path within the mass spectrometer
- Fourier-transform ion cyclotron resonance (FT-ICR)
a mass analyzer that separates ions by allowing them to maintain a circular orbit within a magnetic field at a frequency unique to the ions mass to charge ratio
- Ion traps
a mass analyzer that utilizes radio frequency (RF) oscillating electric fields to isolate and accumulate (trap) ions whose mass to charge ratio grants them a stable trajectory through the field toward the detector
- Spatial resolution
in IMS, spatial resolution refers to the lateral distance between individual mass measurements which subsequently determines the pixel size in the resulting IMS image
- Sputtering
the ionization process in SIMS where secondary ions are ejected from the sample surface as a result of a collision by highly energetic particles from the primary ion beam
References
- 1).Amstalden van Hove ER, Smith DF, Heeren RMA. A concise review of mass spectrometry imaging. J. Chromatogr. A. 2010;1217:3946–3654. doi: 10.1016/j.chroma.2010.01.033. [DOI] [PubMed] [Google Scholar]; This is an expert but concise review of some of the imaging mass spectrometry tools used describing the applications in other fields such as pathology.
- 2).Winograd N, Garrison NJ. Biological cluster mass spectrometry. Annu. Rev. Phys. Chem. 2010;61:305–322. doi: 10.1146/annurev.physchem.040808.090249. [DOI] [PMC free article] [PubMed] [Google Scholar]
- 3).Schwamborn K, Caprioli RM. Molecular imaging by mass spectrometry : looking beyond classical histology. Nat. Rev. Cancer. 2010;10:639–646. doi: 10.1038/nrc2917. [DOI] [PubMed] [Google Scholar]; This is an expert review by one of the main developers of the MALDI based imaging field describing the use of imaging mass spectrometry in cancer investigations.
- 4).McDonnell LA, Heeren RMA. Imaging mass spectrometry. Mass Spectrom. Rev. 2007;26:606–643. doi: 10.1002/mas.20124. [DOI] [PubMed] [Google Scholar]
- 5).Boxer SG, Kraft ML, Weber PK. Advances in imaging secondary ion mass spectrometry for biological samples. Annu. Rev. Biophys. 2009;38:53–74. doi: 10.1146/annurev.biophys.050708.133634. [DOI] [PubMed] [Google Scholar]
- 6).Quintana C, et al. Morphological and chemical studies of pathological human and mice brain at the subcellular level: correlation between light, electron, and NanoSIMS microscopies. Microsc Res. Techniq. 2007;70:281–295. doi: 10.1002/jemt.20403. [DOI] [PubMed] [Google Scholar]
- 7).Castaing R, Slodzian G. Microanalysis by secondary ionic emission. J. Microscopie. 1962;1:395–410. [Google Scholar]
- 8).Lacoste TD, et al. Ultrahigh-resolution multicolor colocalization of single fluorescent probes. PNAS. 2000;97:9461–9466. doi: 10.1073/pnas.170286097. [DOI] [PMC free article] [PubMed] [Google Scholar]
- 9).Watrous JD, Alexandrov T, Dorrestein PC. The evolving field of imaging mass spectrometry and its impact on future biological research. JMS. 2011;46:209–222. doi: 10.1002/jms.1876. [DOI] [PMC free article] [PubMed] [Google Scholar]
- 10).Solon EG, Schweitzer A, Stoeckli M, Prideaux B. Autoradiography, MALDI-MS, and SIMS-MS imaging in pharmaceutical discovery and development. AAPS J. 2010;12:11–26. doi: 10.1208/s12248-009-9158-4. [DOI] [PMC free article] [PubMed] [Google Scholar]
- 11).Francese S, et al. MALDI mass spectrometry imaging, from its origins up to today: the state of the art. Comb. Chem. High T. Scr. 2009;12:156–174. doi: 10.2174/138620709787315454. [DOI] [PubMed] [Google Scholar]
- 12).Heeren RMA, Smith DF, Stauber J, Kukrer-Kaletas B, MacAleese L. Imaging mass spectrometry: Hype or hope? JASMS. 2009;20:1006–1014. doi: 10.1016/j.jasms.2009.01.011. [DOI] [PubMed] [Google Scholar]; Since there are challenges with imaging mass spectrometry, this article is an important and critical review of current capabilities of imaging mass spectrometry.
- 13).Svatos A. Mass spectrometric imaging of small molecules. Trends Biotechnol. 2010;28:425–434. doi: 10.1016/j.tibtech.2010.05.005. [DOI] [PubMed] [Google Scholar]
- 14).Nemes P, Vertes A. Laser ablation electrospray ionization for atmospheric pressure, in vivo, and imaging mass spectrometry. Anal. Chem. 2007;79:8098–8106. doi: 10.1021/ac071181r. [DOI] [PubMed] [Google Scholar]
- 15).Liu Q, Xiao Y, Pagan-Miranda C, Chiu YM, He L. Metabolite imaging using matrix-enhanced surface-assisted laser desorption/ionization mass spectrometry (ME-SALDI-MS) JASMS. 2009;20:80–88. doi: 10.1016/j.jasms.2008.09.011. [DOI] [PubMed] [Google Scholar]
- 16).Liu Y, et al. Imaging mass spectrometry with a low temperature plasma probe for the analysis of works of art. Ange. Chem. 2010;49:4435–4437. doi: 10.1002/anie.200906975. [DOI] [PubMed] [Google Scholar]
- 17).Li Y, Shrestha B, Vertes A. Atmosphereic pressure infrared MALDI imaging mass spectrometry for plant metabolomics. Anal. Chem. 2008;80:407–420. doi: 10.1021/ac701703f. [DOI] [PubMed] [Google Scholar]
- 18).Fraser CM, et al. The minimal gene complement of Mycoplasma genitalium. Science. 1995;270:397–403. doi: 10.1126/science.270.5235.397. [DOI] [PubMed] [Google Scholar]
- 19).Hoshi T, Kudo M. High resolution static SIMS imaging by time of flight SIMS. Appl. Surf. Sci. 2003;203:818–824. [Google Scholar]
- 20).Bickel GA, Adams HM. Surface profiling of lithium with a laser desorption mass spectrometer microprobe. Appl. Optics. 1999;38:1488–1493. doi: 10.1364/ao.38.001488. [DOI] [PubMed] [Google Scholar]
- 21).Becker JS, et al. Bioimaging of metals by laser ablation inductively coupled plasma mass spectrometry (LA-ICP-MS) Mass Spec. Rev. 2010;29:156–175. doi: 10.1002/mas.20239. [DOI] [PubMed] [Google Scholar]
- 22).Spengler B, Hubert M. Scanning microprobe matrix-assisted laser desorption ionization (SMALDI) mass spectrometry: instrumentation for sub-micrometer resolved LDI and MALDI surface analysis. JASMS. 2002;13:735–748. doi: 10.1016/S1044-0305(02)00376-8. [DOI] [PubMed] [Google Scholar]
- 23).Kertesz V, Van Berkel GJ. Improved imaging resolution in desorption electrospray ionization mass spectrometry. Rapid. Comm. Mass. Spec. 2008;22:2639–2644. doi: 10.1002/rcm.3662. [DOI] [PubMed] [Google Scholar]
- 24).Liebl H. Ion microprobe mass analyzer. J. Appl. Phys. 1967;38:5277–5283. [Google Scholar]
- 25).Heeren RMA, et al. Why don't biologists use SIMS?: a critical evaluation of imaging MS. Appl. Surf. Sci. 2006;252:6827–6835. [Google Scholar]
- 26).Hillion F, Horreard F, Schuhmacher M. Development and characterization of the new NanoSIMS 50L. Poster for SIMS XVI. 2007 Oct; [Google Scholar]
- 27).Hillion F, et al. A new high performance instrument: the Cameca NanoSIMS 50. Proceedings of SIMS IX. 1993:254. [Google Scholar]
- 28).McDonnel LA, Heeren RMA, de Lange RPJ, Fletcher IW. Higher sensitivity secondary ion mass spectrometry of biological molecules for high resolution, chemical specific imaging. J. Am. Soc. Mass Spectrom. 2006;17:1195–1202. doi: 10.1016/j.jasms.2006.05.003. [DOI] [PubMed] [Google Scholar]
- 29).Wu KJ, Odom RW. Matrix enhanced secondary ion mass spectrometry: a method for molecular analysis on solid surfaces. Anal. Chem. 1996;68:573–582. doi: 10.1021/ac950717i. [DOI] [PubMed] [Google Scholar]
- 30).Ghosal S, et al. Imaging and 3D elemental characterization of intact bacterial spores by high resolution secondary ion mass spectrometry. Anal. Chem. 2008;80:5986–5992. doi: 10.1021/ac8006279. [DOI] [PubMed] [Google Scholar]
- 31).Pumphrey GM, Hanson BT, Chandra S, Madson EL. Dynamic secondary ion mass spectrometry imaging of microbial populations utilizing 13C-labelled substrates in pure culture and in soil. Environ. Microbiol. 2009;11:220–229. doi: 10.1111/j.1462-2920.2008.01757.x. [DOI] [PMC free article] [PubMed] [Google Scholar]
- 32).Popa R, et al. Carbon and nitrogen fixation and metabolite exchange in and between individual cells of Anabaena oscillarioides. ISME J. 2009;1:354–360. doi: 10.1038/ismej.2007.44. [DOI] [PubMed] [Google Scholar]
- 33).Finzi-Hart JA, et al. Fixation and fate of C and N in the cyanobacterium trichodesmium using nanometer-scale secondary ion mass spectrometry. PNAS. 2009;106:6345–6350. doi: 10.1073/pnas.0810547106. [DOI] [PMC free article] [PubMed] [Google Scholar]
- 34).Dekas AE, Poretsky RS, Orphan VJ. Deep-sea archaea fix and share nitrogen in methane-consuming microbial consortia. Science. 2009;326:422–426. doi: 10.1126/science.1178223. [DOI] [PubMed] [Google Scholar]; This is a terrific article that describes the use of SIMS imaging mass spectrometry to study nitrogen fixation in communities.
- 35).Orphan VJ, House CH, Hinrichs KU, McKeegan KD, DeLong EF. Methane-Consuming Archaea Revealed by Directly Coupled Isotopic and Phylogenetic Analysis. Science. 2001;293:418–419. doi: 10.1126/science.1061338. [DOI] [PubMed] [Google Scholar]
- 36).Musat N, et al. A single-cell view on the ecophysiology of anaerobic phototrophic bacteria. PNAS. 2008;105:17861–17866. doi: 10.1073/pnas.0809329105. [DOI] [PMC free article] [PubMed] [Google Scholar]
- 37).Chandra S, Pumphrey G, Abraham JM, Madsen EL. Dynamic SIMS ion microscopy imaging of individual bacterial cells for studies of isotopically labeled molecules. Appl. Surf. Sci. 2008;255:847–851. [Google Scholar]
- 38).Cliff JB, Gaspar DJ, Bottomley PJ, Myrold DD. Exploration of Inorganic C and N Assimilation by Soil Microbes with Time-of-Flight Secondary Ion Mass Spectrometry. Appl. Environ. Microb. 2002;68:4067–4073. doi: 10.1128/AEM.68.8.4067-4073.2002. [DOI] [PMC free article] [PubMed] [Google Scholar]
- 39).DeRito CM, Pumphrey GM, Madsen EL. Use of Field-Based Stable Isotope Probing To Identify Adapted Populations and Track Carbon Flow through a Phenol-Degrading Soil Microbial Community. Appl. Environ. Microb. 2005;71:7858–7865. doi: 10.1128/AEM.71.12.7858-7865.2005. [DOI] [PMC free article] [PubMed] [Google Scholar]
- 40).Lechene CP, Luyten Y, McMahon D, Distel DL. Quantitative Imaging of Nitrogen Fixation by individual bacteria within animal cells. Science. 2007;317:1563–1566. doi: 10.1126/science.1145557. [DOI] [PubMed] [Google Scholar]; This article describes the use of SIMS imaging mass spectrometry to study nitrogen fixation within an entire host and therefore highlights what the future holds for the creative use of imaging mass spectrometry in biology.
- 41).Lechene C, et al. High-resolution quantitative imaging of mammalian and bacterial cells using stable isotope mass spectrometry. J. Biol. 2006;5:20. doi: 10.1186/jbiol42. [DOI] [PMC free article] [PubMed] [Google Scholar]
- 42).Ploug H, et al. Carbon and nitrogen fluxes associated with the cyanobacterium Aphanizomenon sp. in the Baltic Sea. ISME J. 2010;4:1215–1223. doi: 10.1038/ismej.2010.53. [DOI] [PubMed] [Google Scholar]
- 43).Halm H, et al. Co-occurrence of denitrification and nitrogen fixation in an meromictic lake, Lake Cadagno (Switzerland) Environ. Microbiol. 2009;11:1945–1958. doi: 10.1111/j.1462-2920.2009.01917.x. [DOI] [PubMed] [Google Scholar]
- 44).Debois D, et al. In situ localisation and quantification of surfactins in a Bacillus subtilis swarming community by imaging mass spectrometry. Proteomics. 2008;8:3682–3691. doi: 10.1002/pmic.200701025. [DOI] [PubMed] [Google Scholar]
- 45).Vaidyanathan S, et al. Subsurface Biomolecular Imaging of Streptomyces coelicolor Using Secondary Ion Mass Spectrometry. Anal. Chem. 2008;80:1942–1951. doi: 10.1021/ac701921e. [DOI] [PubMed] [Google Scholar]; This article is highlighted because it is one of the first applications of SIMS-TOF imaging to study microbes that was able to observe some intact molecules. This is an important milestone for SIMS imaging mass spectrometry in microbiology.
- 46).Latimer J, et al. A novel method for exploring elemental composition of microbial communities: Laser ablation-inductively coupled plasma-mass spectrometry of intact bacterial colonies. J. Microbiol. Meth. 2009;79:329–335. doi: 10.1016/j.mimet.2009.10.001. [DOI] [PubMed] [Google Scholar]
- 47).Edirisinghe PD, et al. Detection of In Situ Derivatized Peptides in Microbial Biofilms by Laser Desorption 7.87 eV Postionizaton Mass Spectrometry. Anal. Chem. 2007;79:508–514. doi: 10.1021/ac0615605. [DOI] [PubMed] [Google Scholar]
- 48).Thiel V, Toporski J, Schumann G, Sjovall P, Lausmaa J. Analysis of archaeal core ether lipids using Time of Flight-Secondary Ion Mass Spectrometry (ToF-SIMS): Exploring a new prospect for the study of biomarkers in geobiology. Geobiology. 2007;5:75–83. doi: 10.1111/j.1472-4669.2006.00093.x. [DOI] [PubMed] [Google Scholar]
- 49).Benninghoven A. Analysis of submonolayers on silver by negative secondary ion emission. Phys. Stat. Sol. 1967;34:K169. [Google Scholar]
- 50).Benninghoven A. New developments in the surface analysis of solids. Anal. Phys. 1973;1:3–16. [Google Scholar]
- 51).Tyler BJ, Rangaranjan S, Moller J, Beumer A, Arlinghaus HF. TOF-SIMS imaging of chlorhexidine-digluconate transport in frozen hydrated biofilms of the fungus Candida albicans. Appl. Surf. Sci. 2006;252:6712–6715. [Google Scholar]
- 52).Watrous J, Hendricks N, Meehan M, Dorrestein PC. Capturing Bacterial Metabolic Exchange Using Thin Film Desorption Electrospray Ionization-Imaging Mass Spectrometry. Anal. Chem. 2010;82:1598–600. doi: 10.1021/ac9027388. [DOI] [PMC free article] [PubMed] [Google Scholar]; This is the first application of DESI imaging mass spectrometry to study metabolic exchange with microbial colonies.
- 53).Takats Z, Wiseman JM, Gologan B, Cooks RG. Mass spectrometry sampling under ambient conditions with desorption electrospray ionization. Science. 2004;306:471–473. doi: 10.1126/science.1104404. [DOI] [PubMed] [Google Scholar]; This is the first paper that describes the development of DESI mass spectrometry which also suggested that imaging would be feasible.
- 54).Wiseman JM, Ifa DR, Venter A, Cooks RG. Ambient molecular imaging with desorption electrospray ionization mass spectrometry. Nat. Prot. 2008;3:517–524. doi: 10.1038/nprot.2008.11. [DOI] [PubMed] [Google Scholar]
- 55).Costa AB, Cooks RG. Simulated splashes: elucidating the mechanism of desorption electrospray ionization mass spectrometry. Chem. Phys. Let. 2008;464:1–8. [Google Scholar]
- 56).Huang G, Chen H, Zhang X, Cooks RG, Ouyang Z. Rapid screening of anabolic steroids in urine by reactive desorption electrospray ionization. Anal. Chem. 2007;79:8327–8332. doi: 10.1021/ac0711079. [DOI] [PubMed] [Google Scholar]
- 57).Nyadong L, et al. Reactive desorption electrospray ionization mass spectrometry (DESI-MS) of natural products of a marine alga. Anal. Bioanal. Chem. 2009;394:245–254. doi: 10.1007/s00216-009-2674-3. [DOI] [PMC free article] [PubMed] [Google Scholar]
- 58).Yang YL, Xu Y, Straight P, Dorrestein PC. Translating metabolic exchange with imaging mass spectrometry. Nat. Chem. Biol. 2009;5:885–887. doi: 10.1038/nchembio.252. [DOI] [PMC free article] [PubMed] [Google Scholar]; This is the first paper that describes the use of imaging mass spectrometry to study the metabolic interactions between two microbes.
- 59).Liu WT, et al. Imaging mass spectrometry of intraspecies metabolic exchange revealed the cannibalistic factors of Bacillus subtilis. PNAS. 2010;107:16286–16290. doi: 10.1073/pnas.1008368107. [DOI] [PMC free article] [PubMed] [Google Scholar]; This is the first paper that describes the use of imaging mass spectrometry to discover specific factors.
- 60).Roach P, Laskin J, Laskin A. Nanospray desorption electrospray ionization: an ambient method for liquid-extraction surface sampling in mass spectrometry. Analyst. 2010;135:2233–2236. doi: 10.1039/c0an00312c. [DOI] [PubMed] [Google Scholar]; This is the paper that describes the development if nanoDESI, a tool the authors of this review believe will become a common tool to study metabolic exchange.
- 61).Esquenazi E, et al. Visualizing the spatial distribution of secondary metabolites produced by marine cyanobacteria and sponges via MALDI-TOF imaging. Mol. Biosyst. 2008;4:562–570. doi: 10.1039/b720018h. [DOI] [PMC free article] [PubMed] [Google Scholar]
- 62).Yang Y-L, Xu Y, Kersten RD, Liu W-T, Meehan MJ, Moore BS, Bandeira N, Dorrestein PC. Connecting Chemotypes and Phenotypes of Cultured Marine Microbial Assemblages by Imaging Mass Spectrometry. Angew. Chem. 2011;50:5839–5842. doi: 10.1002/anie.201101225. [DOI] [PMC free article] [PubMed] [Google Scholar]; This is the first paper that shows that imaging mass spectrometry can be used to study complex microbial interactions.
- 63).Caprioli RM, Farmer TB, Gile J. Molecular imaging of biological samples: Localization of peptides and proteins using MALDI-TOF MS. Anal. Chem. 1997;69:4751–4760. doi: 10.1021/ac970888i. [DOI] [PubMed] [Google Scholar]
- 64).Schreimer DC, Li L. Detection of high molecular weight narrow polydisperse polymers up to 1.5 million Daltons by MALDI mass spectrometry. Anal Chem. 1996;68:2721–2725. doi: 10.1021/ac960442m. [DOI] [PubMed] [Google Scholar]
- 65).Kindness A, Sekaran CN, Feldmann J. Two dimensional mapping of copper and zinc in liver sections by laser ablation-inductive coupled plasma mass spectrometry. Clin. Chem. 2003;49:1916–1923. doi: 10.1373/clinchem.2003.022046. [DOI] [PubMed] [Google Scholar]
- 66).Cvetkovic A, et al. Microbial metalloproteins are largely uncharacterized. Nature. 2010;466:779–782. doi: 10.1038/nature09265. [DOI] [PubMed] [Google Scholar]
- 67).Savina MR, Lykke KR. Microscopic chemical imaging with laser desorption mass spectrometry. Anal. Chem. 1997;69:3741–3746. [Google Scholar]
- 68).Akhmetov A, Moore JF, Gasper GL, Koin PJ, Hanley L. Laser desorption postionization for imaging MS of biological material. JMS. 2010;45:137–145. doi: 10.1002/jms.1716. [DOI] [PMC free article] [PubMed] [Google Scholar]
- 69).Straight PD, Willey JM, Kolter R. Interactions between Streptomyces coelicolor and Bacillus subtilis: Role of surfactants in raising aerial structures. J. Bacteriol. 2006;188:4918–4925. doi: 10.1128/JB.00162-06. [DOI] [PMC free article] [PubMed] [Google Scholar]
- 70).González-Pastor JE, Hobbs EC, Losick R. Cannibalism by sporulating bacteria. Science. 2003;301:510–513. doi: 10.1126/science.1086462. [DOI] [PubMed] [Google Scholar]
- 71).Ellermeier CD, Hobbs EC, Gonzalez-Pastor JE, Losick R. A three-protein signaling pathway governing immunity to a bacterial cannibalism toxin. Cell. 2006;124:549–559. doi: 10.1016/j.cell.2005.11.041. [DOI] [PubMed] [Google Scholar]
- 72).Li T, et al. Simultaneous analysis of microbial identity and function using NanoSIMS. Environ. Microbiol. 2008;10:580–588. doi: 10.1111/j.1462-2920.2007.01478.x. [DOI] [PMC free article] [PubMed] [Google Scholar]
- 73).Fike DA, Gammon CL, Ziebes W, Orphan VJ. Micron-scale mapping of sulfur cycling across the oxycline of a cyanobacterial mat: a paired nanoSIMS and CARD-FISH approach. ISME J. 2008;2:749–759. doi: 10.1038/ismej.2008.39. [DOI] [PubMed] [Google Scholar]
- 74).Behrens S, et al. Linking Microbial Phylogeny to Metabolic Activity at the Single-Cell Level by Using Enhanced Element Labeling-Catalyzed Reporter Deposition Fluorescence In Situ Hybridization (EL-FISH) and NanoSIMS. Appl. Environ. Microb. 2008;74:3143–3150. doi: 10.1128/AEM.00191-08. [DOI] [PMC free article] [PubMed] [Google Scholar]; Together with references 67 and 68, this is a series of three independent laboratories that came up with the same approach to study the metabolism of microbial cells and are able to pinpoint which cells are responsible through the use of FISH and SIMS.
- 75).Truede, et al. Consumption of methane and CO2 by methanotrophic microbial mats from gas seeps of the anoxic Black Sea. Appl. Environ. Microbiol. 2007;73:2271–2283. doi: 10.1128/AEM.02685-06. [DOI] [PMC free article] [PubMed] [Google Scholar]
- 76).Wagner M. Single-Cell Ecophysiology of Microbes as Revealed by Raman Microspectroscopy or Secondary Ion Mass Spectrometry Imaging. Annu. Rev. Microbiol. 2009;63:411–429. doi: 10.1146/annurev.micro.091208.073233. [DOI] [PubMed] [Google Scholar]; This is a nice review of the current state of SIMS.
- 77).Thiel V, et al. Biomarkers at the microscopic range: ToF-SIMS molecular imaging of Archaea-derived lipids in a microbial mat. Geobiology. 2007;5:413–417. [Google Scholar]
- 78).Corbin BD, et al. Metal chelation and inhibition of bacterial growth in tissue abscesses. Science. 2008;319:962–965. doi: 10.1126/science.1152449. [DOI] [PubMed] [Google Scholar]
- 79).Schoenian I, et al. Chemical basis of the synergism and antagonism in microbial communities in the nests of leaf-cutting ants. PNAS. 2011;108:1955–1960. doi: 10.1073/pnas.1008441108. [DOI] [PMC free article] [PubMed] [Google Scholar]; This paper describes imaging mass spectrometry directly on biological samples and was able to demonstrate the presence antibiotics produced by microbes directly from ants. This again is an article that shows what imaging mass spectrometry will be capable of in the future.
- 80).Kroiss J, et al. Symbiotic streptomycetes provide antibiotic combination prophylaxis for wasp offspring. Nat. Chem. Bio. 2010;6:261–263. doi: 10.1038/nchembio.331. [DOI] [PubMed] [Google Scholar]
- 81).Lane AL, et al. Desorption electrospray ionization mass spectrometry reveals surface-mediated antifungal chemical defense of a tropical seaweed. PNAS. 2009;106:7314–7319. doi: 10.1073/pnas.0812020106. [DOI] [PMC free article] [PubMed] [Google Scholar]
- 82).Olson MS, Ford RM, Smith JA, Fernandez EJ. Quantification of bacterial chemotaxis in porous media using magnetic resonance imaging. Environ. Sci. Technol. 2004;38:3864–3870. doi: 10.1021/es035236s. [DOI] [PubMed] [Google Scholar]
- 83).Wang J, Zhang X, Zhao D, Wang Q, Li D. Magnetic resonance imaging (MRI) in detection of Bifidobacterium longum and Clostridium novyi-NT labelled with superparamagnetic iron oxide (SPIO) nanoparticles. Nature Preceedings [Google Scholar]
- 84).Tayfun C, et al. Diagnostic value of MRI in tuberculosis meningitis. Eur. Radiol. 1996;6:380–386. doi: 10.1007/BF00180618. [DOI] [PubMed] [Google Scholar]
- 85).Dufrene YF. Atomic force microscopy: A powerful tool in microbiology. J. Bacteriol. 2002;184:5205–5213. doi: 10.1128/JB.184.19.5205-5213.2002. [DOI] [PMC free article] [PubMed] [Google Scholar]
- 86).Rogers SW, Moorman TB, Ong SK. Fluorescence in situ hybridization (FISH) and microautoradiography (MAR) applied to ecophysiology in soil. Soil Sci. Soc. Am. J. 2007;71:620–631. [Google Scholar]