
Figure 4. Chromatin accessibility and DNA methylation patterns.
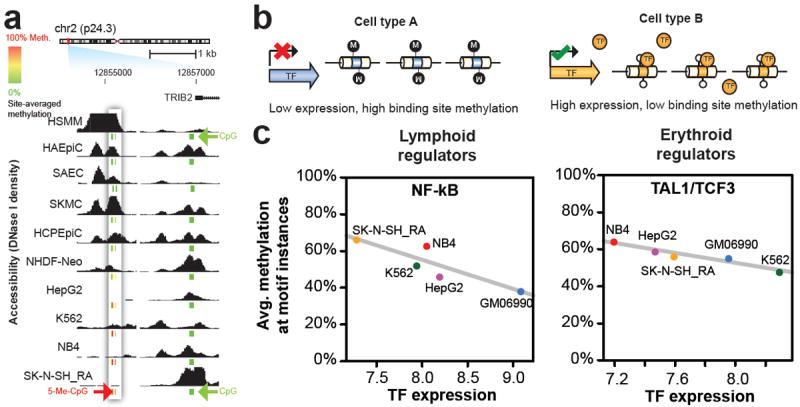
a, DNaseI sensitivity in 19 cell types with ENCODE Reduced Representation Bisulfite Sequencing data. Inset box: accessibility (y-axis) decreases quantitatively as methylation increases. Other DHSs (right) show low correlation between accessibility and methylation. CpG methylation scale: Green, 0%; yellow, 50%; red, 100%. b, Model of TF-driven methylation patterns in which methylation passively mirrors TF occupancy. c, Relationship between TF transcript levels and overall methylation at cognate recognition sequences of the same TFs. Lymphoid regulators in B-lymphoblastoid line GM06990 (left) and erythroid regulators in the erythroleukemia line K562 (right). Negative correlation indicates that site-specific DNA methylation follows TF vacation of differentially expressed TFs.