

Abstract
Perhaps more than any other “-omics” endeavor, the accuracy and level of detail obtained from mapping the major connection pathways in the living human brain with diffusion MRI depends on the capabilities of the imaging technology used. The current tools are remarkable; allowing the formation of an “image” of the water diffusion probability distribution in regions of complex crossing fibers at each of half a million voxels in the brain. Nonetheless our ability to map the connection pathways is limited by the image sensitivity and resolution, and also the contrast and resolution in encoding of the diffusion probability distribution.
The goal of our Human Connectome Project (HCP) is to address these limiting factors by re-engineering the scanner from the ground up to optimize the high b-value, high angular resolution diffusion imaging needed for sensitive and accurate mapping of the brain’s structural connections. Our efforts were directed based on the relative contributions of each scanner component. The gradient subsection was a major focus since gradient amplitude is central to determining the diffusion contrast, the amount of T2 signal loss, and the blurring of the water PDF over the course of the diffusion time. By implementing a novel 4-port drive geometry and optimizing size and linearity for the brain, we demonstrate a whole-body sized scanner with Gmax = 300mT/m on each axis capable of the sustained duty cycle needed for diffusion imaging. The system is capable of slewing the gradient at a rate of 200 T/m/s as needed for the EPI image encoding. In order to enhance the efficiency of the diffusion sequence we implemented a FOV shifting approach to Simultaneous MultiSlice (SMS) EPI capable of unaliasing 3 slices excited simultaneously with a modest g-factor penalty allowing us to diffusion encode whole brain volumes with low TR and TE. Finally we combine the multi-slice approach with a compressive sampling reconstruction to sufficiently undersample q-space to achieve a DSI scan in less than 5 minutes. To augment this accelerated imaging approach we developed a 64-channel, tight-fitting brain array coil and show its performance benefit compared to a commercial 32-channel coils at all locations in the brain for these accelerated acquisitions.
The technical challenges of developing the over-all system are discussed as well as results from SNR comparisons, ODF metrics and fiber tracking comparisons. The ultra-high gradients yielded substantial and immediate gains in the sensitivity through reduction of TE and improved signal detection and increased efficiency of the DSI or HARDI acquisition, accuracy and resolution of diffusion tractography, as defined by identification of known structure and fiber crossing.
Keywords: MRI, structural connectivity, diffusion imaging, gradient hardware, HARDI, DSI
Introduction
Following years of steady growth, diffusion MRI and fMRI have reached technological turning points in their respective mappings of human structural and functional connectivity, as have the computational tools to organize and share the resulting data. As part of the US National Institutes of Health’s Blueprint Initiative for Neuroscience Research; Human Connectome Project (HCP), the MGH-UCLA collaboration was charged pushing the frontier of extant acquisition technology with the goal of building dramatically more comprehensive and complete models of the structural Connectome than currently available. To achieve this we set out with a blank sheet of paper and asked; “what would an MR scanner optimized specifically for connectomics look like and what are the potential imaging improvements?” The result required developing and validating advances in every domain of MR technology except the magnet. First and foremost, we attempted to construct the highest performance gradient set ever attempted for human imaging. The resulting gradients utilize a peak gradient strength of 300mT/m and are capable of slewing at 200T/m/s. Although peripheral nerve stimulation (PNS) prevents the application of waveforms combining both high strength and high slew rate, the diffusion sequence requires primarily high strength alone during the diffusion encode and high slew rate at moderate Gmax (~40–50 mT/m) during the EPI readout. The goal was two fold; to shorten the TE of the spin echo diffusion, reducing signal losses from T2 processes, and to decrease the diffusion time Δ. Shortening TE has a simply characterized exponential effect on image sensitivity. The effect of the shortened diffusion time is less easily characterized but is expected to sharpen features in the water probability distribution function. Because the goal is efficient human diffusion imaging, the gradients need to perform at high duty-cycle for hours at a time without inefficient cool-down periods.
The sequence was re-examined with a goal of improving the notoriously in-efficient 2D spin echo diffusion sequence. Such 2D sequences become inefficient when TR becomes higher than the theoretical optimum; TR ≈ 1.2 T1 (about 1s for white matter at 3T), due to the number of slices needed to cover the head with 2D EPI. Thus typical diffusion acquisitions, with a TR of up to 10 seconds for a 2mm isotropic acquisition, are enormously inefficient. The nuclear magnetization spends most of its time at equilibrium waiting to be sampled. The speed up was achieved by enabling a method of exciting and reading-out multiple slices simultaneously and separating them with parallel imaging methods. Although implemented a decade ago (Larkman et al. 2001), the method was not suitable for diffusion imaging since its g-factor penalty outweighs the envisioned efficiency benefit. A significant reduction of the g-factor penalty in EPI was achieved by implementing a blipped CAIPIRHINA FOV shifting scheme, (Setsompop et al. 2012) thereby allowing a net gain in efficiency as well as an increase in the number of diffusion directions obtainable in a given scan time. Finally, the RF detection was augmented with a 64-channel brain array coil designed to increase parallel imaging performance.(Keil et al. 2012) Taken together, the expected efficiency gain is nearly an order of magnitude for high b-value diffusion (3.5x from shorter TE, 1.7x from the Rslice=3 SMS, and 1.4 fold from the RF coil).
In this paper, we describe the strategy and implementation of the MGH-UCLA Connectome scanner, our initial validation of its performance in SNR, sequence and diffusion ODF metrics, as well as a characterization of some of the concomitant problems of the methodology; such as peripheral and central nervous system stimulation, increased eddy current fields and gradient Maxwell terms.
Choice of B0 field strength
The first choice for the proposed scanner involved selecting the B0 field strength. Excellent quality EPI encoding, including high resolution single-shot, has been achieved at 7T using highly parallel arrays coils by many groups, including ours. This immediately suggests that EPI-based methods such as diffusion imaging could potentially benefit from the 2x increase in image (thermal) SNR observed in going from 3T to 7T.(Vaughan et al. 2001; Triantafyllou et al. 2005) However, several issues prompted us to develop the Connectome diffusion scanner for 3T and not 7T. Unlike the BOLD effect which experiences enhanced contrast as field strength is increased, the diffusion contrast is set only by the displacement of the water and the applied field gradient and is thus independent of B0. The desired 2 fold sensitivity increase is tempered by a slightly decreased T2, losses from imperfect flip angle settings due to the inhomogeneous transmit fields in the head at 7T and increased vibration and acoustic noise issues.
Since the WM T2 drops from 77ms at 3T to ~50ms at 7T (Cox et al. 2008) there is a rate difference; ΔR2 =7s−1 between 3T and 7T. The SNR is expected to be reduced by a factor of exp(ΔR2TE). For a typical TE used at modest b values (e.g. TE=65ms), the SNR is reduced by a factor of 1.6, losing most of the benefit of the ultra-high field. Additionally, the SE-EPI used in diffusion is vulnerable to the B1+ transmit inhomogeneities at 7T which cause the excitation to deviate from the ideal 90°, 180° flip angles and thus reduce SNR. For example the peak-to-peak flip-angle variation of about 2 fold observed for conventional “uniform” birdcage-like transmit coils leads to a 3 fold variation (loss) in signal intensity in a SE acquisition.(Wang et al. 2005) While a substantial effort in parallel transmit technology is aimed at this problem, (Setsompop et al. 2006; Alagappan et al. 2007; Setsompop et al. 2008; Setsompop et al. 2008; Zelinski et al. 2008; Zelinski et al. 2008; Zelinski et al. 2008) this further complicates the acquisition. Additional confounds at 7T stem from increased susceptibility gradients and a degraded point-spread-function of SE-EPI due to increased T2* filtering across kspace. Finally, SAR considerations at ultra-high field typically limit the number of slices that can be acquired in a given TR. SAR is a limiting factor for the modulated SMS pulses at 3T and the 4 fold SAR increase experienced at 7T would limit that methodology. Note that many of this issues (B1+ inhomogeneity, SAR, point-spread) effect mainly spin echo sequences and are relatively benign in gradient echo EPI and fMRI studies. Thus the gradient echo EPI based fMRI studies have flourished at 7T while spin echo methods, like diffusion imaging, are less common. Nonetheless, persistent work on low b-value diffusion at 7T has begun to pay off, (Mukherjee et al. 2008; Poupon et al. 2009) especially with zoomed (reduced FOV) imaging.(Heidemann et al. 2012)
Gradient design and implementation
Many previous approaches to high strength gradients have relied on asymmetric head gradient designs. These designs are appealing since the small size creates an intrinsically efficient design (high Gmax per Ampere of current) as well as reduced PNS stimulation since the shoulders and torso are outside of the main gradient field. However, the asymmetric head gradient also has several negative features. The small size exacerbates the heating problem by reducing the mass and the volume available for cooling water tubes. Similarly the design has limited ability to increase the number of layers of conductors. This is especially acute in the shoulder cut-out regions which have a high wire density and little extra space. Additionally, the design is harder to torque balance and provide effective eddy current shielding. Finally, the Maxwell terms (concomitant terms) include odd orders as well as even orders, complicating their effect on the diffusion pulse sequence. (Meier et al. 2008)
An initial symmetric gradient design based on the Siemens 7T SC72 gradient was evaluated. This design was then modified to reduce the linear FOV to 20cm dia. and to reduce the open bore space to 56cm diameter. This modified design could achieve Gmax=150mT/m and slew = 200 T/m/s per axis when driven with state-of-the-art gradient amplifiers (the Siemens Aera amplifier with 900A and 2250V per axis.) The increased thickness of the coil allowed this gradient strength to be run at a high duty cycle without cooling issues. The number of winding layers was then doubled to achieve Gmax = 300mT/m (with an accompanying 4 fold increase in inductance). To handle the increased power dissipated in the windings, the number of water cooling layers was increased 4 fold to allow full duty cycle operation. The result was a symmetric gradient design with a clear patient bore of 56cm diameter and a linearity of 6% on a 20cm dia. sphere and 17% in a 40cm dia. sphere. While similar in linearity to a head gradient, the small symmetric design’s linearity degrades more gracefully with offset from isocenter.
Going with the whole-body like symmetric coil design complicated the ability to achieve the slew rate needed for EPI. In order to achieve high Gmax the inductance of the each axis was necessarily increased 4 fold by an additional layer of windings. The result is an inductance (L≈5mH), about 4 fold higher than conventional 40mT/m gradients. During slewing, the amplifiers must overcome the back-EMF determined by L dI/dt. This would have traditionally required a 4 fold higher voltage from the gradient amplifier. Developing such a high voltage driver (8kV) would itself be a difficult undertaking with existing solid state devices and even if successful would lead to increased electrostatic discharge problems within the gradient and was not seen as a viable option. Instead, the coil was divided into 4 sections along its natural “fingerprint” pattern with each fingerprint’s primary and shield pair driven by a single amplifier. The geometry for the drive of the y axis is shown in Fig. 1. Since each amplifier now only drives a quarter of the inductance, the slew rate is similar to conventional scanners (200 T/m/s).
Fig. 1.

Gradient drive configuration for the 300mT/m Connectome gradients. Gy axis shown in cartoon form. The high inductance needed to achieve the needed gradient strength is split into 4 sections, each consisting of a “finger-print” primary coil and its associated shield. Thus the inductance of each section is comparable to a conventional whole body gradient (~1mH) and can be switched rapidly by the 2000V gradient amplifiers. Driving each axis with 4 parallel drives requires both a high degree of synchronization and a matrix style configuration of the gradient regulators needed to control overshoots.
The new architecture allows storing the calibration data for each of the 12 final amplifier stages driving the gradient coil segments. The gradient waveform is logically split and fed to four individual gradient controllers. This architecture also allows generating arbitrary field characteristics for each gradient coil axis, used to optimize eddy current compensation. The draw-back of the 4-port parallel drive is that the inductively coupled sections must be driven to produce a field time-course that matches the desired trapezoidal waveforms, e.g. free of overshoots and under-shoots. Conventionally, this is done by using a Proportional Integral Derivative (PID) controller to provides active feedback and enforce the desired waveform. The amplifier regulator architecture was extended to account for the dynamic differential control (D) of the driving signal. This allows counteracting the induced voltage in each coil segment due to mutual coupling.
Although the current 4-port design is implemented with a phase shift between the drives designed to generate gradient fields, it is interesting to note that other phase shifts could be chosen to produce either an approximately uniform field, or quadrature fields. The former might be useful for Delta Relaxation Enhanced MR (dreMR) imaging (Alford et al. 2009) and the latter for PATLOC (Hennig et al. 2008; Schultz et al. 2010; Lin et al. 2012) or O-space style encoding (Stockmann et al. 2010).
The gradient coil design was implemented and constructed together with a second-order shim set on the outer diameter. The final coil was massive, with a constructed weight of ~1400kg. It is probable that many of the successful attributes of the coil, such as its low acoustic noise and vibration (quieter than a conventional scanner) can be attributed to the increased mass and stiffness of the thick annulus.
Nerve stimulation thresholds
After successful fabrication, the gradient coil was tested for PNS at the factory using a standard threshold detection protocol in 35 healthy adult subjects (20 male 15 female). The gradient coil was energized in a laboratory setting (outside of the magnet) with the subjects supine with their head at isocenter. The PNS study was conducted according to the requirements defined by IEC 60601-2-33. chapter “51.105.1 Direct determination of the limits of the Gradient Output”. The gradients were pulsed with a train of 1, 4, 32, 64 or 128 bipolar trapezoidal gradient pulses each with a plateau time of 0.5, 1.0, 3, 5, or 7 ms. The rise time Trise was varied between 100 μs and 800 μs. The stimulation threshold was fit with the SAFE PNS model. (Hebrank et al. 2000) Figure 3 shows the nerve stimulation threshold data (value and SD) measured for the y axis. The reduced FOV of the gradient coil limits the peak B field present in the body and thus the dB/dt induced nerve stimulation is lower for the Connectome gradient than conventional gradients. This allowed us to employ a faster EPI readout than used in conventional scanners (echo-spacing = 0.62ms instead of 0.76ms for the 1.5mm resolution EPI). The worst case stimulation curves for simultaneous Gx, Gy and Gz pulses are shown in Fig. 4 as well as the hardware capabilities and the cardiac stimulation threshold in the IEC guidelines (Commission 2002). It is immediately clear that the gradients are capable of severe PNS and must be limited with a real time monitor. Thus one of the two gradient monitors is set to 80% of the SAFE PNS model threshold determined from the experimental threshold data (as shown in Fig. 3). Additionally, since the theoretically expected cardiac stimulation threshold can be lower than the PNS threshold for parts of parameter space reachable with the coil, a second monitor (based on IEC values) was implemented to prevent this event. Either monitor is capable of stopping the acquisition. With these two monitors in place, even modest PNS sensations are not observed in the scanner.
Fig. 3.

Peripheral nerve stimulation thresholds for the Gy axis of Connectome gradient compared to a conventional 45mT/m whole body gradient. The reduced linearity of the Connectome gradient (5% deviation from linear on a 20cm FOV) reduces the maximum B field excursion created by the gradient and thus lowers dB/dt and nerve stimulation. This allows an improved EPI readout. For example, the Connectome gradient could achieve an 18% reduction in the EPI echospacing (and thus image distortion) without nerve stimulation compared to the conventional gradient.
Fig. 4.

Peripheral nerve stimulation as well as cardiac thresholds for the Connectome gradient. The hardware limits can easily surpass either of these limits and therefore the system monitors the gradient waveforms and stops the scan if either limit is exceeded.
An unanticipated finding was that the increased gradient strength could induce magneto-phosphenes in the retina of subjects. This was observed as a flashing light in the peripheral visual field from as little as a single trapezoidal pulse. Although previously observed from motion in the static B0 field at 7T, and even at 3T and 1.5T (Weintraub et al. 2007) this phenomena has not, to our knowledge, previously been associated with switching gradient fields. For the studies performed, the phosphenes could be produced with gradient of >130mT/m and trapezoidal rise times of 5ms – 7ms although a careful threshold study was not performed. Magneto-phosphene induction has been previously characterized (Lovsund et al. 1980; Lovsund et al. 1980; Marg 1991) and has a peak response for fields oscillating in the 20Hz to 30Hz range, consistent with the long rise-times for which we observed them. While magneto-phosphenes are commonly encountered in Transcranial Magnetic Stimulation (TMS) and are not considered an adverse health concern (Marg 1991; Schutter et al. 2010; Taylor et al. 2010), the International Commission on Non-Ionizing Radiation Protection (ICNIRP) guidelines for occupational exposure also state that they are not considered a health risk but nonetheless exclude their production in occupational exposure. (2010) Thus non-chronic induction of magneto-phosphenes is not widely seen as a health risk. But, because magneto-phosphenes are a phenomena of the central nervous system (the retina), and because of the metabolic delicacy of the retina and the lack of literature on the risks associated with sustained stimulation, we decided to seek a conservative course that guaranteed that the applied gradients were sub-threshold for all subjects. Fortunately, they were only induced in measurements where the eyes were off isocenter in z by more than 10cm and raised above isocenter in y by a similar amount. Lowering the head coil to place the retinas close to isocenter in y and positioning the eyes at isocenter in z was found to eliminate the induction of magneto-phosphenes; none have been seen since the initial stimulation study. Nonetheless, this issue will return should the Connectome gradient be applied to non-brain applications where the eyes are farther from isocenter.
Eddy current effects and Concomitant terms (Maxwell’s terms)
Both eddy current fields and concomitant fields are increased in stronger gradients. Although careful attention was paid to the shield coil design to successfully lower the eddy current fields as expressed as a percentage of the total gradient fields, the 7.5 fold higher gradient strength yielded eddy currents that were between 2 and 3 fold higher in absolute terms. Usually the first line of defense is to use a twice refocused spin echo sequence designed to eliminate the principle eddy current time constant. (Reese et al. 2003) Unfortunately, concomitant terms makes this approach impossible (see next paragraph). Therefore, our approach was to rely on improved post-processing correction method (Andersson et al. 2012) which was sufficient for bringing the images from multiple gradient directions into alignment. This approach requires the acquisition of diffusion data with opposite gradient directions preventing partial Fourier q-space sampling schemes. We were also careful to acquire these pairs sequentially to reduce the chance for movement between the opposing directions. Note that the improved echo-spacing and in-plane parallel imaging also serve to reduce the distortion produced by a given eddy current field.
Increasing the gradient strength by 7 fold increases the unwanted concomitant “Maxwell” field terms by a factor of 49 since the effect of these components grow as the square of the ratio between the gradient fields and B0. (Bernstein et al. 2004) Since the unwanted terms are even order in space, phase accrued due to these fields does not reverse when the gradient direction is reversed. Thus a bipolar gradient pulse does not fully refocus the spins. This means that diffusion sequences which utilize a bipolar gradient for diffusion encoding (such as the eddy current mitigation scheme used in twice refocused spin echo sequences) will suffer signal loss from this mechanism. Fortunately, a standard spin echo (Stejskal-Tanner) scheme does fully refocus these terms with no signal loss. Also, the concomitant terms present in the EPI readout are similar to conventional systems since the amplitude of these gradients is only a little higher than normal.
Acoustic noise and vibrations
While a 7 fold increased gradient strength might potentially be accompanied by a similar increase in acoustic noise and vibrations, it appears that the effect of the thicker, heavier gradient, as well as increased torque and force balancing afforded by the larger volume, offset this problem. The gradient running at 300mT/m produces a lower acoustic noise than the conventional 40mT/m 3T and qualitative assessment of the vibration suggests it is also reduced.
Achieved TE and diffusion time (Δ) reductions and SNR gains
Figure 5 shows the minimum TE obtained for a standard Stejskal-Tanner spin echo diffusion sequence as a function of b value for a 2mm isotropic EPI readout (200 FOV, ¾ partial Fourier, and R=2 acceleration) as a function of maximum gradient strength. The TEmin is shown for a gradient strength of 40mT/m, 80mT/m, 100mT/m and 300mT/m. The largest reduction in TE and Δ occur for the higher b values. For Gmax = 40, 80, 100 and 300mT/m and b=10,000s/mm2, the diffusion time (Δ) was; 56.4, 38.4, 33.9, and 23.4ms The expected SNR gain scales as exp(ΔTE/T2) depends on the water T2 of the component observed. Using a WM T2=65ms, the relative SNR of Gmax = 40, 80, 100 and 300mT/m is 1, 1.7, 2.0 and 2.8 for b=10,000s/mm2 sequence. For myelin water, with an estimated T2 of 20ms, the SNR gains are phenomenal; 1, 6.0, 9.5 and 27. Figure 5 shows the measured SNR gains for WM areas bright in a b=10,000s/mm2 2mm isotropic resolution diffusion acquisition. The WM measurements are in rough agreement with that expected from the TE reduction and a WM T2 of 65ms. Figure 6 shows the diffusion weighted images for a 1.5mm isotropic resolution acquisition acquired with b=10,000s/mm2. At this in-plane resolution there is little WM structure visible in the low gradient strength acquisition.
Fig.5.
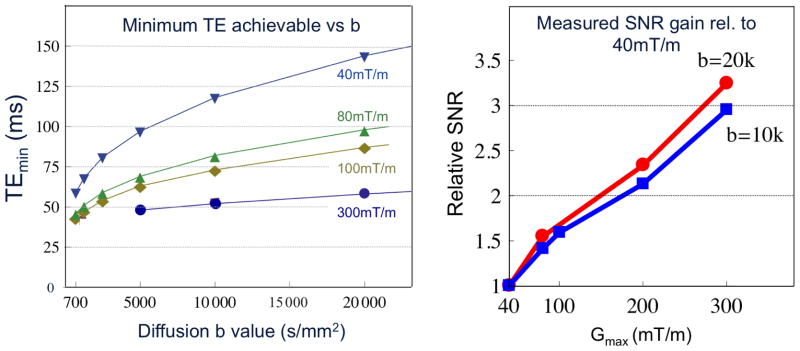
Left) Minimum TE obtained for a standard Skeskjal Tanner spin echo diffusion sequence as a function of b value as a function of maximum gradient strength. Results are for a 2mm isotropic EPI readout (200 FOV). Right) Measured SNR of the brightest sections of in vivo human white matter (where fiber orientation is orthogonal to the applied diffusion gradient) as a function of maximum gradient strength for the same acquisition at b = 10,000s/mm2 and 20,000 s/mm2. SNR is normalized to the SNR obtained with Gmax = 40mT/m. Data for 5b acquired with the 64ch brain array.
Fig. 6.
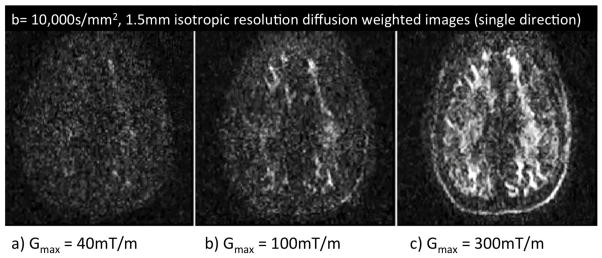
Diffusion weighted images (single direction) acquired at Gmax = 40mT/m, 100mT/m and 300mT/m with b=10,000 s/mm2 and 1.5mm isotropic resolution. Data acquired with the 64ch brain array.
RF design and implementation
Since parallel image reconstruction (both conventional in-plane and in the slice directions) was central to our acquisition strategy, we set out to create a state-of-the-art highly parallel RF brain coil. (Keil et al. 2012) The resulting 64 channel brain array is shown in Fig. 7. The array former splits into two halves and yet retains the critical overlap of the circular elements (~55–65 mm dia). The array adheres to the head shape to a degree previously not attempted. It is also mounted relatively low in the bore to keep the brain within the linear region of the gradients and move the retinas closer to isocenter. It both curves in at the occipital pole and the sides of the head. Subjects with larger heads cannot “slip out” of the coil but must open it to exit. We had some concern that this would cause anxiety, but in practice it is not noticed by the subjects. Figure 7 also shows the imaging SNR performance (both intrinsic SNR expected in unaccelerated imaging, and that from g-factor improvements) as a function of acceleration factor compared to a 32ch array of identical geometry. Due to improvements in g-factor, at R=4 there is a modest (~17%) improvement in the center of the head (whereas in unaccelerated imaging, the 32 and 64ch array perform identically). At the brain periphery the increase grows to about a factor of 1.4.
Fig. 7.

Design, implementation and testing of the 64ch brain coil for the Connectome scanner. Layout of the circular receive elements is shown on the two halfs of the former, as well as the finished coil with and without covers and its relative SNR gain compared to a sized matched 32ch array for accelerated brain imaging as measured in a peripheral, intermediate and central brain ROI.
The data size for the 64-channel coil is twice as large as the 32-channel coil. For accelerated acquisitions with GRAPPA parallel imaging reconstruction, the computation load for the kernels application is ~4x larger for the 64-channel coil. Each channel’s unaliased image is obtained from convolution operations on k-space data of 64 instead of 32 channels; resulting in a 2x increase in computation load per channel. With twice as many channels, the total increase in computation load is therefore 4x. For typical diffusion imaging with in-plane acceleration, the reconstruction for the 64-channel acquisition can be performed in real time due to the relatively long TR. However, with the TR shortening effect of simultaneous multi-slice and increased computational burden, image reconstruction does lag the image acquisition. Array coil compression algorithms (Buehrer et al. 2007) could be utilized to significantly reduce the computation load with minor SNR penalty. The diffusion models and associated tractography analysis use to calculate diffusion metric and fiber paths operate on the coil-combined diffusion images. Therefore, no additional computational cost in diffusion analysis is associated with the use of the 64-channel coil.
The noise statistics of the combined array coil image is non-Gaussian, but well understood. (Constantinides et al. 1997; Kellman et al. 2005) When accelerated imaging is added (such as the GRAPPA or SENSE or Simultaneous Multislice method), the noise becomes non-uniform in space. The effect of non-Gaussian noise and magnitude bias noise complicates the diffusion analysis. (Jones et al. 2004; Koay et al. 2009) The use of a 64 channel array can increase the degree of magnitude bias present and care was taken to use a complex weighted coil combination instead of a simple “sum of squares” combination. (Sotiropoulos et al. 2013)
Pulse sequence design and implementation
Simultaneous Multi-Slice with blipped-CAIPI FOV shift
The diffusion encoding pulses encode the water displacement in the whole brain, but are followed by the readout of only a single slice. This wastes a significant fraction of the imaging time. An alternative view is that a given spin is only sampled for a small fraction of the TR period; an inefficiency which grows with the number of 2D slices. The ultra high strength gradients allow for a significant shortening of the diffusion encoding time, while the use of parallel imaging to reduce the number of phase encoding lines acquired allows for a reduction in the EPI encoding period. Nonetheless, the combined acquisition time reduction from these two techniques is typically only ~30–40%.
3D imaging overcomes these problems by sampling every spin in every readout, but requires multi-shot readout. The latter are problematic in diffusion since even microscopic motions will cause large phase errors between segments. Simultaneous MultiSlice (SMS) imaging techniques can overcome this inefficiency by allowing for the acquisition of multiple imaging slices per acquisition period retaining the benefits of single-shot imaging. Such techniques utilize MultiBand (MB) RF pulses to excite multiple imaging slices simultaneously before each diffusion encoding and image readout. The reduction in acquisition time is directionally proportional to the number of slices that were simultaneously excited and acquired—e.g if three imaging slices were excited and acquired simultaneously then the acquisition time is reduced by a factor of three. Here we utilize the terminology used in the recent review on this method by Setsompop and Feinberg. (Feinberg et al. 2013) The RF pulses are referred to as MultiBand pulses due to their multiple pass-bands and the slice-acceleration factor as the “MB” factor. We refer to the method itself as simultaneous multi-slice as a self-descriptive name for the acquisition method and a closer tribute to Larkman’s original invention of “slices simultaneously acquired”. (Larkman et al. 2001)
Various methods have been proposed for the simultaneous acquisition of multiple imaging slices including Wideband (Weaver 1988), Simultaneous Image Refocusing (SIR) (Feinberg et al. 2002; Reese et al. 2009), and parallel imaging based techniques (Larkman et al. 2001); each of which exhibits different tradeoffs. The Wideband approach leads to large voxel tilting artifacts and is typically avoided. The SIR method provides an efficient way to encode multiple images simultaneously but at a cost of increased EPI distortion and T2* signal loss (from increased TE). Parallel imaging based SMS acquisition on the other hand does not exhibit these artifacts but incurs a significant g-factor noise amplification. If the g-factor is greater than the efficiency gain (e.g. √3 for 3 slice simultaneous acquisition) then the strategy achieves a net loss in sensitivity. Added image noise can be relatively benign in fMRI studies where physiological fluctuations dominate the noise time-series (de Zwart et al. 2004), but diffusion acquisitions have little room for additional noise. Recently, efforts have also been made to combine SIR and parallel imaging based SMS acquisition to allow for increased in slice acceleration factor with better imaging/artifact tradeoff. (Feinberg et al. 2010; Setsompop et al. 2012) This combined method has been commonly referred to as Multiplexed EPI.
New sequence developments have enabled parallel imaging based SMS-EPI acquisition to be utilized without significant noise amplification penalty. Previously, parallel imaging based SMS technique was limited by the ill-conditioning of parallel imaging reconstruction at high slice acceleration factors. The “controlled aliasing in parallel imaging results in higher acceleration” (CAIPIRINHA) technique was proposed by the Wurzburg group to mitigate this issue by introducing an in-plane image shift between the simultaneously acquired slices to increase the distance between aliasing voxels thereby making them easier to separate. (Breuer et al. 2005) This in-plane shift was achieved by modulating the phase of the magnetization excited in the individual slices for each k-space line by phase modulating each RF pulse. Since single-shot EPI uses only a single excitation pulse, creation of the FOV shift through excitation modulatoin is precluded. An alternative approach suitable to EPI was proposed based on the wideband method, but this results in the undesirable voxel tilting artifact. (Nunes et al. 2006) To accomplish controlled aliasing in EPI without this artifact, the blipped-CAIPI acquisition scheme was recently proposed. (Setsompop et al. 2012), The method is outlined in Fig. 8. Similar to the wideband approach (Nunes et al. 2006), a train of Gz gradient blips is applied simultaneously with the Gy phase encoding gradient blips of the EPI sequence. These Gz blips create a phase difference between the simultaneously acquired slices. However, unlike the wideband approach, the Gz gradient blips are designed specifically to refocus/rewind the through-slice phase accumulation periodically and overcome the voxel tilting artifact. Note that the Gz blips in this sequence are applied during the EPI read-out, after the slices have been excited simultaneously by a single multi-band RF excitation pulse. This differs from the Simultaneous Image Refocusing (SIR) technique in which the imaging slices are excited sequentially, with the excitations separated by additional Gz encoding gradient(s).
Fig. 8.

Blipped-CAIPI acquisition scheme for MB2 and FOV/2 PE shift. The additional Gz encoding gradients applied simultaneously with the standard Gy phase gradient in the EPI readout are shown on the left. Each Gz gradient blip causes a π phase change in the signal of the top imaging slice. This results in a phase modulation that is equivalent to a linear phase causing a desired FOV/2 shift as shown on the right. The reversal of every other Gz blips minimizes the accrual of intravoxel dephasing along the slice direction and the associate voxel tilting artifact.
An example of a blipped-CAIPI SMS-EPI acquisition scheme for an inter-slice FOV/2 shift along the y direction between two simultaneously excited slices (MB-2) is shown in Figure 8. The Gz encodes used in such scheme along with the signal’s phase accrual map as a function of k-space is shown on the left. The size of the Gz blips were chosen to create a phase accrual of magnitude π for the top excited slice (with the exception of the initial ‘balancing’ blip (marked in red) which was chosen to be half the size of all the other blips). In this simplified depiction, the lower slice is at isocenter and incurs no phase from the Gz blips. The equivalent unwrapped linear phase modulation for the top excited slice is shown on the right of the figure. This phase accrual as a function of ky causes the top imaging slice to shift by FOV/2 as shown in the collapsed image. While shown for the lower slice at iso-center, the relative phase shift is also applies to off-isocenter slice pairs with the same slice spacing. In this sequence, the reversal of every other Gz blip is used to avoid the accumulation of intravoxel dephasing in the slice direction, while the initial blip is used to further minimize any residual intravoxel dephasing.
Figure 9 (top) shows the retained SNR maps (1/g-factor) of the blipped-CAIPI SMS-EPI acquisition at MB factor of 3 and inter-slice image shift of FOV/2. Data was collected at 3T using a 32 channel coil array and the SNR maps were calculated using the pseudo-multiple replica method (Robson et al. 2008). For this acquisition, the retained SNR is close to 100% in most spatial locations with the 1/g average +/− standard deviation of 0.997 +/− 0.08 (compared to 0.68 +/− 0.14 for the non-blipped acquisition—not shown). The use of such acquisition scheme allows a three fold acceleration of HARDI and DSI data, while providing essentially identical SNR and diffusion information (Figure 9 middle and bottom).
Fig. 9.

Blipped-CAIPI retained SNR results for MB factor of 3 (Top) providing ~100% of the unaccelerated SNR. Middle) 3 fold accelerated q-ball. Bottom) 3 fold accelerated DSI () acquisitions. All results used the 64ch brain array.
Slice-GRAPPA reconstruction
Slice-GRAPPA (Setsompop et al. 2012) has been widely used in the image reconstruction of blipped-CAIPI acquisitions. With such technique, a separate GRAPPA-like kernel set is used to estimate the k-space data of each of the individual slices from the collapsed slice data. Thus, for a MB-3 acquisition, three separate sets of GRAPPA kernels are fitted and applied. With the standard slice-GRAPPA (Std-SG), the GRAPPA kernels are calculated by solving:
| [eq.1] |
where Si and ki are vectors of k-space signal and GRAPPA kernel for slice i, and [Asc] is the slice-collapsed convolution matrix. This optimization aims to find a kernel set that best estimates slice i from the collapsed data. However, the matrix [Asc] contains signal from all slices, and so it is possible that the signal from slices other than slice i will be used to help estimate Si; leading to signal leakage. It was previously shown (Setsompop et al. 2012) that typical aliased imaging slices tend to have sufficiently different image contrast that this signal leakage contribution is small. Nonetheless, at high slice and in-plane accelerations this may not hold, leading to significant leakage signal. Effort has been made to characterize this leakage signal using the L-factor (Moeller 2012). In diffusion imaging, the diffusion encoding gradients cause dramatic change in image contrast, when compared to the training data image (used in forming [Asc]). This causes the leakage signal to no longer contribute positively to the formation the slice image Si-- resulting in image artifact. This problem is further compounded by potentially large image phase changes due to small motions—particularly from brain pumping action and CSF motion.
Recently, the Split Slice-GRAPPA (Sp-SG) method has been proposed as a way to mitigate this signal leakage driven image artifact. With this method, the following optimization is used to calculate the GRAPPA kernels:
| [eq.2] |
where Ai is the slice i convolution matrix. Here, [eq.2] aims to find a kernel set that best matches the pass-through signal (Si′ = [Ai]ki) with the underlying signal (Si), while minimizing the leakage signal (Lj = [Aj]ki).
Figure 10 shows the leakage (Lj) and the blocked signal (Si-Si′) of imaging slice 4 in a MB-5 blipped-CAIPI acquisition (with inter-slice shift of FOV/3) from Std-SG and Sp-SG reconstructions. The underlying signal images in their relative shifted positions are also shown on the right of the figure. The data for this example was acquired using a 32 channel head coil. Significant reduction in leakage artifact was achieved by the Sp-SG methods (35% and 38% reduction in mean and max leakage). The blocked signal was also reduced, which indicates a better fidelity in representing the underlying signal from a particular slice. Note that the overall reconstruction error, defined as ||Si − [Asc]ki||2, is lowered for the Std-SG reconstruction when compared to the Sp-SG reconstruction (for the training dataset). In this particular example, the Std-SG algorithm is utilizing the leakage signal from slice 1 to make up a large part of the blocked signal component to create a better image. However, with changes in image contrast and/or phase during the actual diffusion acquisition, the leakage component from slice 1 will no longer contribute positively to the image reconstruction of slice 4, causing the Std-SG algorithm to produce significantly more image artifact.
Fig. 10.

Leaked and blocked signal of slice 4 in a MB-5 blipped-CAIPI acquisition from i) standard Slice-GRAPPA (Std-SG) and ii) Split Slice-GRAPPA (Sp-SG) reconstructions. The Sp-SG reconstruction results in a significant reduction in leaked and blocked signal artifacts.
Q-space compressed sensing
The application of compressed sensing algorithms to diffusion imaging has recently been pursued. (Lee et al. 2010; Menzel et al. 2011; Michailovich et al. 2011; Rathi et al. 2011; Tristan-Vega et al. 2011; Merlet et al. 2012) Such techniques rely on the random under-sampling of the diffusion encoding (q-space) and the utilization of sparsity based prior information to perform the diffusion reconstruction. Menzel and colleagues were the first to apply compressed sensing to Diffusion Spectrum Imaging (DSI). (Menzel et al. 2011) In their implementation, the diffusion’s probability density function (PDF) was constrained to be sparse in the total variation (TV) and Wavelet domains. Recently, trained dictionary based sparsity constrains (Bilgic et al. 2012; Gramfort et al. 2012; Merlet et al. 2012) have been shown to improve the reconstruction performance of such under-sampled acquisitions-- allowing for good reconstruction of the pdf at acceleration factor of 4 and higher.
SMS acquisition and compressed sensing q-space undersampling are complementary techniques to acceleration diffusion acquisitions. Figure 11 illustrates the combined use of these technologies in acquiring high quality DSI data in just 4 minutes on the Connectome scanner using the 64-channel coil array and the dictionary based compression scheme of Bilgic et al. 2012. A MB factor of 3 was used for the blipped-CAIPI SMS acquisition, while a 4-fold q-space random undersampling was employed along with dictionary based compressed sensing reconstruction. Together these two factors provided an overall acceleration of 12-fold. Tractography results for this acquisition are showed in Figure 11 (top). The bottom part of figure 11 provides a comparison between fully sampled 515 DSI with MB-3 and 4 fold Q-space compressed sensing (CS) DSI with MB-3. Tractography results and average FA values in 18 major white matter pathways are shown for both cases. This result illustrates the similarity in the data quality between the undersampled and fully sampled case. Nonetheless, like many compressive sampling schemes, the compressed dataset can be missing subtle information and further validation is in order.
Fig. 11.

Top) Tractography results from a 4-minute DSI scan acquired using MB-3 and 4 fold Q-space compressed sensing (CS). Bottom) Tractography results and average FA values over 18 major white matter pathways from i) fully sampled 515 DSI with MB-3 (16 minutes) and ii) 4 fold Q-space compressed sensing (CS) DSI with MB-3 (4 minutes). Good agreements of results from these two datasets can be observed. The 64 channel brain array was used.
Susceptibility distortion mitigation
The geometric image distortion induced by susceptibility gradients in the phase encode direction of EPI remains a significant problem for single shot SE-EPI based diffusion acquisitions. While the hardware advances described do not fully mitigate this problem, they reduce these distortions in two ways. Firstly, the stronger gradients allow a faster EPI readout than conventional gradients even though PNS prevents the use of the full gradient strength during the EPI readout. Nonetheless the smaller gradient linear field of view leads to higher PNS thresholds than conventional gradients. This allowed us to employ a faster EPI readout than used in conventional scanners. For example, our 1.5mm resolution EPI protocol (144×144 matrix over 200mm FOV) could achieve an echo-spacing of 0.62ms compared to 0.76ms for conventional whole body gradients. In addition to reducing induced image distortion from susceptibility and eddy current sources, this reduced the overall EPI readout and thus TE and TR.
The second hardware approach to mitigating the EPI susceptibility distortion is the 64 channel brain array. Using 64 instead of 32 channels allows higher acceleration to be performed with an acceptable g-factor. (Keil et al. 2012) Since the EPI image distortions are reduced by the acceleration factor, this can improve the quality of the imaging, for example the R=3 GRAPPA sagittal 1.5mm isotropic resolution images shown in Fig. 12 (b=0 s/mm2 images are shown from a b=10,000s/mm2 data set) are expected to have 3 fold reduced distortion compared to an unaccelerated run and an additional factor of 76/62 = 1.23 fold from the improved echo-spacing. Figure 12 shows the level of distortion obtained in single shot 1.5mm isotropic resolution SE-EPI images. The images from half the brain are shown in sagittal view.
Fig. 12.

Sagittal single shot SE-EPI dataset showing level of susceptibility induced geometric distortion present in the Connectome scanner data. This is the b=0s/mm2 data from a b=10,000s/mm2 dataset acquired with 1.5mm isotropic resolution and R=3 in-plane GRAPPA acceleration. In addition to the distortion mitigation of the R=3 GRAPPA, the data is also mitigated by the faster readout of the Connectome gradient. Slices from half the brain are shown to improve visibility.
Diffusion imaging evaluation
While the higher q-space encoding, in principle, will encode higher detail in the PDF and therefore the Orientation Distribution Function (ODF), it does so at reduced SNR due to the high b-value. We assess the benefit of the higher gradient strengths in Fig. 13 by comparing the first and second fiber uncertainty metrics in b = 10,000s/mm2 q-ball acquisitions acquired on the Connectome scanner using Gmax = 40mT/m, 100mT/m and 300mT/m. The acquisition used the single refocused spin echo squences, TR=3000ms, 20 slices, FOV = 220mm, R=3 GRAPPA, 1.5mm isotropic resolution (BW=1902Hz/px), b= 10,000s/mm2 HARDI with 160 directions and an interspersed b=0 image every 20 volumes for motion correction. Data was acquired using the 64 channel brain array. The TE values for the Gmax = 40mT/m, 100mT/m and 300mT/m scans were; 121ms, 77ms, and 57ms. HARDI reconstruction was performed using upto 4th order spherical harmonics (Descoteaux et al. 2007) with sharpening (Kezele et al. 2010) with a residual bootstrap analysis to extract the uncertainty in the first and second ODF maxima (Cohen-Adad et al. 2011). Figure 13 shows the results for the second fiber direction. Both Gmax = 100mT/m and 300mT/m do significantly better than the Gmax = 40mT/m, presumably to the improved SNR at the shorter TE. Figure 14 shows a section from a fibertracking reconstruction of these 3 data sets zooming in on a U-fiber formation in the frontal lobe. The Gmax = 40mT/m dataset misses this structure entirely (although it might have been retained if a lower spatial resolution or lower b-value was used). The Gmax = 100 mT/m dataset begins to show the U-fiber bundle, while the high gradient strength scan shows it clearly.
Fig. 13.

Residual bootstrap analysis of 95% confidence interval of the angular uncertainty of the second fiber direction in b = 10,000s/m2, 160 directions, 1.5mm isotropic resolution diffusion data. The 64ch brain array was used.
Fig. 14.

Comparison of diffusion tractography at Gmax = 40, 100 and 300 mT/m from a Q-Ball type acquisition (1.5 mm isotropic, 160 directions, b-value 10,000 s/mm2). TEs were 100 ms, 66 ms and 54ms for Gmax = 40 mT/m, 100 mT/m and 300 mT/m, respectively. Higher SNR enables better depiction of U-fibers with fewer false positives. The 64ch brain array was used.
Here the diffusion ODF was reconstructed using the spherical harmonic decomposition (Anderson 2005; Hess et al. 2006; Descoteaux et al. 2007) with sharpening (Kezele et al. 2010). Although the scope of the present article focuses on acquisition techniques, it should be noted that more recent HARDI reconstruction approaches exist, that enable more nuanced estimate of the diffusion ODF (Aganj et al. 2009; Canales-Rodriguez et al. 2009; Tristan-Vega and Westin 2011). These methods put low constraints on the original data and allow reconstructing a smooth version of the diffusion ODF when low order of decomposition is employed – as done here where maximum order 4 was used. In addition, other reconstruction methods obtain the so-called “fiber ODF”, which is a sharp version of the diffusion ODF that more closely represents the orientation of underlying axonal fibers. Such methods are based on deconvolution techniques (Tournier et al. 2004; Dell’Acqua et al. 2007; Tournier et al. 2008; Descoteaux et al. 2009), diffusion orientation transform (Ozarslan et al. 2006) and persistent angular structure (Anderson 2005). Additionally, the deconvolution step can be added to DSI sampled data. (Canales-Rodriguez et al. 2010) Further work should be conducted to assess the benefits of advanced acquisition techniques with these reconstruction methods. Tractography was performed with TrackVis (www.trackvis.org), which uses a modified version of the FACT method (Mori et al. 1999) which allows each voxel to have multiple fiber directions.
Conclusion
Gradient strength, acquisition efficiency and detection sensitivity are critical determinants of sensitivity in diffusion imaging, especially for high b-value high angular resolution acquisitions. Encouraged by the knowledge that small bore scanners with high gradient strength appeared to produce a richer structural Connectome in fixed tissue than is possible in living humans, we set out to re-engineer a clinical scanner to match the small bore capabilities. Owing to synergistic effects of gradient strength, reduced TE, increased time-efficiency, and improved structural resolution with reduced diffusion time, this technology, was expected to yield significant (5–10 fold) gains in sensitivity for high diffusion contrast white matter imaging. These gains can be translated to higher q-space encoding or increased spatial resolution and ultimately help bring in vivo assessment of the structural Connectome to its full potential. The technical aspects of the scanner are complete and have achieved their technical goals. We look forward to its application in neuroscience and clinical populations.
Fig. 2.

Photo of the completed gradient set in the bore. Note the wide (14cm) annulus of the gradients due to the decreased inner diameter (610mm) and full-sized outer diameter (890mm).
Highlights.
In this paper we describe our work to advance the sensitivity of the structural diffusion connectivity measurement. We take a critical look at MR neuroimaging technology and have attempted to redesign each subsection to maximize sensitivity of high anglular resolution diffusion acquisitions.
Highlights.
Approach for advancing the sensitivity of the diffusion connectivity measurement.
Optimization of Gmax =300mT/m gradient, RF coil and sequence.
Improved sensitivity and diffusion contrast in high quality DSI/Q Ball.
Acknowledgments
This work acknowledges funding from the National Institutes of Health, NIH Blueprint Initiative for Neuroscience Research grant U01MH093765 and National Institutes of Health grant P41EB015896. Note that the MGH-UCLA Connectome scanner is a Work in Progress. The information about this product is preliminary. The product is under development and is not commercially available in the U.S. and its future availability cannot be assured.
Footnotes
Publisher's Disclaimer: This is a PDF file of an unedited manuscript that has been accepted for publication. As a service to our customers we are providing this early version of the manuscript. The manuscript will undergo copyediting, typesetting, and review of the resulting proof before it is published in its final citable form. Please note that during the production process errors may be discovered which could affect the content, and all legal disclaimers that apply to the journal pertain.
References
- Guidelines for limiting exposure to time-varying electric and magnetic fields (1 Hz to 100 kHz) Health physics. 99(6):818–836. doi: 10.1097/HP.0b013e3181f06c86. [DOI] [PubMed] [Google Scholar]
- Aganj I, Lenglet C, Sapiro G, Yacoub E, Ugurbil K, Harel N. Multiple Q-shell ODF reconstruction in Q-ball imaging. Medical image computing and computer-assisted intervention: MICCAI … International Conference on Medical Image Computing and Computer-Assisted Intervention. 2009;12(Pt 2):423–431. doi: 10.1007/978-3-642-04271-3_52. [DOI] [PMC free article] [PubMed] [Google Scholar]
- Alagappan V, Nistler J, Adalsteinsson E, Setsompop K, Fontius U, Zelinski A, Vester M, Wiggins GC, Hebrank F, Renz W, Schmitt F, Wald LL. Degenerate mode band-pass birdcage coil for accelerated parallel excitation. Magn Reson Med. 2007;57(6):1148–1158. doi: 10.1002/mrm.21247. [DOI] [PubMed] [Google Scholar]
- Alford JK, Rutt BK, Scholl TJ, Handler WB, Chronik BA. Delta relaxation enhanced MR: improving activation-specificity of molecular probes through R1 dispersion imaging. Magnetic resonance in medicine: official journal of the Society of Magnetic Resonance in Medicine/Society of Magnetic Resonance in Medicine. 2009;61(4):796–802. doi: 10.1002/mrm.21933. [DOI] [PubMed] [Google Scholar]
- Anderson AW. Measurement of fiber orientation distributions using high angular resolution diffusion imaging. Magn Reson Med. 2005;54(5):1194–1206. doi: 10.1002/mrm.20667. [DOI] [PubMed] [Google Scholar]
- Andersson J, Xu J, Yacoub E, Auerbach E, Moeller S, Ugurbil K. A comprehensive gaussian process framework for correcting distortions and movements in diffusion images. Proc. of the ISMRM; Melbourne Australia. 2012. [Google Scholar]
- Bernstein MA, King KF, Zhou XJ. Ch. 10 Correctin gradients. Handbook of MRI pulse seqences. Amsterdam: Elsevier Academic Press; 2004. pp. 292–302. [Google Scholar]
- Bilgic B, Setsompop K, Cohen-Adad J, Yendiki A, Wald LL, Adalsteinsson E. Accelerated diffusion spectrum imaging with compressed sensing using adaptive dictionaries. Magnetic resonance in medicine: official journal of the Society of Magnetic Resonance in Medicine/Society of Magnetic Resonance in Medicine. 2012;68(6):1747–1754. doi: 10.1002/mrm.24505. [DOI] [PMC free article] [PubMed] [Google Scholar]
- Breuer FA, Blaimer M, Heidemann RM, Mueller MF, Griswold MA, Jakob PM. Controlled aliasing in parallel imaging results in higher acceleration (CAIPIRINHA) for multi-slice imaging. Magn Reson Med. 2005;53(3):684–691. doi: 10.1002/mrm.20401. [DOI] [PubMed] [Google Scholar]
- Buehrer M, Pruessmann KP, Boesiger P, Kozerke S. Array compression for MRI with large coil arrays. Magnetic resonance in medicine: official journal of the Society of Magnetic Resonance in Medicine/Society of Magnetic Resonance in Medicine. 2007;57(6):1131–1139. doi: 10.1002/mrm.21237. [DOI] [PubMed] [Google Scholar]
- Canales-Rodriguez EJ, Iturria-Medina Y, Aleman-Gomez Y, Melie-Garcia L. Deconvolution in diffusion spectrum imaging. NeuroImage. 2010;50(1):136–149. doi: 10.1016/j.neuroimage.2009.11.066. [DOI] [PubMed] [Google Scholar]
- Canales-Rodriguez EJ, Melie-Garcia L, Iturria-Medina Y. Mathematical description of q-space in spherical coordinates: exact q-ball imaging. Magn Reson Med. 2009;61(6):1350–1367. doi: 10.1002/mrm.21917. [DOI] [PubMed] [Google Scholar]
- Cohen-Adad J, Descoteaux M, Wald LL. Quality assessment of high angular resolution diffusion imaging data using bootstrap on Q-ball reconstruction. Journal of magnetic resonance imaging: JMRI. 2011;33(5):1194–1208. doi: 10.1002/jmri.22535. [DOI] [PMC free article] [PubMed] [Google Scholar]
- Commission, I. E. Particular requirements for the safety of magnetic resonance equipment for medical diagnosis. Geneva: 2002. International Standard IEC 60601-2-33 Medical electrical equipment. [Google Scholar]
- Constantinides CD, Atalar E, McVeigh ER. Signal-to-noise measurements in magnitude images from NMR phased arrays. Magn Reson Med. 1997;38(5):852–857. doi: 10.1002/mrm.1910380524. [DOI] [PMC free article] [PubMed] [Google Scholar]
- Cox E, Gowland P. Measuring T2 and T2′ in the brain at 1.5T, 3T and 7T using a hybrid gradient echo-spin echo sequence and EPI. Proceedings of the ISMRM; Toronto. 2008. [Google Scholar]
- de Zwart JA, Ledden PJ, van Gelderen P, Bodurka J, Chu R, Duyn JH. Signal-to-noise ratio and parallel imaging performance of a 16-channel receive-only brain coil array at 3.0 Tesla. Magnetic resonance in medicine: official journal of the Society of Magnetic Resonance in Medicine/Society of Magnetic Resonance in Medicine. 2004;51(1):22–26. doi: 10.1002/mrm.10678. [DOI] [PubMed] [Google Scholar]
- Dell’Acqua F, Rizzo G, Scifo P, Clarke RA, Scotti G, Fazio F. A model-based deconvolution approach to solve fiber crossing in diffusion-weighted MR imaging. IEEE transactions on bio-medical engineering. 2007;54(3):462–472. doi: 10.1109/TBME.2006.888830. [DOI] [PubMed] [Google Scholar]
- Descoteaux M, Angelino E, Fitzgibbons S, Deriche R. Regularized, fast, and robust analytical Q-ball imaging. Magn Reson Med. 2007;58(3):497–510. doi: 10.1002/mrm.21277. [DOI] [PubMed] [Google Scholar]
- Descoteaux M, Deriche R, Knösche TR, Anwander A. Deterministic and probabilistic tractography based on complex fibre orientation distributions. IEEE transactions on medical imaging. 2009;28(2):269–286. doi: 10.1109/TMI.2008.2004424. [DOI] [PubMed] [Google Scholar]
- Feinberg DA, Moeller S, Smith SM, Auerbach E, Ramanna S, Gunther M, Glasser MF, Miller KL, Ugurbil K, Yacoub E. Multiplexed echo planar imaging for sub-second whole brain FMRI and fast diffusion imaging. PloS one. 2010;5(12):e15710. doi: 10.1371/journal.pone.0015710. [DOI] [PMC free article] [PubMed] [Google Scholar]
- Feinberg DA, Reese TG, Wedeen VJ. Simultaneous echo refocusing in EPI. Magnetic resonance in medicine: official journal of the Society of Magnetic Resonance in Medicine/Society of Magnetic Resonance in Medicine. 2002;48(1):1–5. doi: 10.1002/mrm.10227. [DOI] [PubMed] [Google Scholar]
- Feinberg DA, Setsompop K. Ultra-fast MRI of the human brain with simultaneous multi-slice imaging. Journal of magnetic resonance. 2013;229:90–100. doi: 10.1016/j.jmr.2013.02.002. [DOI] [PMC free article] [PubMed] [Google Scholar]
- Gramfort A, Poupon C, Deriche R. Parametric dictionary learning for modeling EAP and ODF in diffusion MRI. Med Image Comput Comput Assist Interv. 2012;15(Pt3 3):10–17. doi: 10.1007/978-3-642-33454-2_2. [DOI] [PubMed] [Google Scholar]
- Hebrank FX, Gebhardt M. SAFE Model – a new method for predicting peripheral nerve stimulations in MRI. Proceedings of the ISMRM; Denver USA. 2000. [Google Scholar]
- Heidemann RM, Ivanov D, Trampel R, Fasano F, Meyer H, Pfeuffer J, Turner R. Isotropic submillimeter fMRI in the human brain at 7 T: combining reduced field-of-view imaging and partially parallel acquisitions. Magnetic resonance in medicine: official journal of the Society of Magnetic Resonance in Medicine/Society of Magnetic Resonance in Medicine. 2012;68(5):1506–1516. doi: 10.1002/mrm.24156. [DOI] [PubMed] [Google Scholar]
- Hennig J, Welz AM, Schultz G, Korvink J, Liu Z, Speck O, Zaitsev M. Parallel imaging in non-bijective, curvilinear magnetic field gradients: a concept study. Magma. 2008;21(1–2):5–14. doi: 10.1007/s10334-008-0105-7. [DOI] [PMC free article] [PubMed] [Google Scholar]
- Hess CP, Mukherjee P, Han ET, Xu D, Vigneron DB. Q-ball reconstruction of multimodal fiber orientations using the spherical harmonic basis. Magn Reson Med. 2006;56(1):104–117. doi: 10.1002/mrm.20931. [DOI] [PubMed] [Google Scholar]
- Jones D, Basser P. Squashing peanuts and smashing pumpkins: How noise distorts diffusion-weighted MR data. Magn Reson Med. 2004;52(5):979–993. doi: 10.1002/mrm.20283. [DOI] [PubMed] [Google Scholar]
- Keil B, Blau JN, Biber S, Hoecht P, Tountcheva V, Setsompop K, Triantafyllou C, Wald LL. A 64-channel 3T array coil for accelerated brain MRI. Magnetic resonance in medicine: official journal of the Society of Magnetic Resonance in Medicine/Society of Magnetic Resonance in Medicine. 2012 doi: 10.1002/mrm.24427. [DOI] [PMC free article] [PubMed] [Google Scholar]
- Kellman P, McVeigh ER. Image reconstruction in SNR units: a general method for SNR measurement. Magn Reson Med. 2005;54(6):1439–1447. doi: 10.1002/mrm.20713. [DOI] [PMC free article] [PubMed] [Google Scholar]
- Kezele I, Descoteaux M, Poupon C, Poupon F, Mangin JF. Spherical wavelet transform for ODF sharpening. Medical image analysis. 2010;14(3):332–342. doi: 10.1016/j.media.2010.01.002. [DOI] [PubMed] [Google Scholar]
- Koay CG, Ozarslan E, Pierpaoli C. Probabilistic Identification and Estimation of Noise (PIESNO): a self-consistent approach and its applications in MRI. Journal of magnetic resonance. 2009;199(1):94–103. doi: 10.1016/j.jmr.2009.03.005. [DOI] [PMC free article] [PubMed] [Google Scholar]
- Larkman DJ, Hajnal JV, Herlihy AH, Coutts GA, Young IR, Ehnholm G. Use of multicoil arrays for separation of signal from multiple slices simultaneously excited. J Magn Reson Imaging. 2001;13(2):313–317. doi: 10.1002/1522-2586(200102)13:2<313::aid-jmri1045>3.0.co;2-w. [DOI] [PubMed] [Google Scholar]
- Lee N, Singh M. Compressed sensing based diffusion spectrum imaging. Proc. of the ISMRM; Stockholm Sweden. 2010. [Google Scholar]
- Lin FH, Witzel T, Schultz G, Gallichan D, Kuo WJ, Wang FN, Hennig J, Zaitsev M, Belliveau JW. Reconstruction of MRI data encoded by multiple nonbijective curvilinear magnetic fields. Magnetic resonance in medicine: official journal of the Society of Magnetic Resonance in Medicine/Society of Magnetic Resonance in Medicine. 2012;68(4):1145–1156. doi: 10.1002/mrm.24115. [DOI] [PMC free article] [PubMed] [Google Scholar]
- Lovsund P, Oberg PA, Nilsson SE. Magneto- and electrophosphenes: a comparative study. Medical & biological engineering & computing. 1980;18(6):758–764. doi: 10.1007/BF02441902. [DOI] [PubMed] [Google Scholar]
- Lovsund P, Oberg PA, Nilsson SE, Reuter T. Magnetophosphenes: a quantitative analysis of thresholds. Medical & biological engineering & computing. 1980;18(3):326–334. doi: 10.1007/BF02443387. [DOI] [PubMed] [Google Scholar]
- Marg E. Magnetostimulation of vision: direct noninvasive stimulation of the retina and the visual brain. Optometry and vision science: official publication of the American Academy of Optometry. 1991;68(6):427–440. doi: 10.1097/00006324-199106000-00004. [DOI] [PubMed] [Google Scholar]
- Meier C, Zwanger M, Feiweier T, Porter D. Concomitant field terms for asymmetric gradient coils: consequences for diffusion, flow, and echo-planar imaging. Magnetic resonance in medicine: official journal of the Society of Magnetic Resonance in Medicine/Society of Magnetic Resonance in Medicine. 2008;60(1):128–134. doi: 10.1002/mrm.21615. [DOI] [PubMed] [Google Scholar]
- Menzel MI, Tan ET, Khare K, Sperl JI, King KF, Tao X, Hardy CJ, Marinelli L. Accelerated diffusion spectrum imaging in the human brain using compressed sensing. Magnetic resonance in medicine: official journal of the Society of Magnetic Resonance in Medicine/Society of Magnetic Resonance in Medicine. 2011;66(5):1226–1233. doi: 10.1002/mrm.23064. [DOI] [PubMed] [Google Scholar]
- Merlet S, Caruyer E, Deriche R. Parametric dictionary learning for modeling EAP and ODF in diffusion MRI. Med Image Comput Comput Assist Interv. 2012;15(pt2):288–296. doi: 10.1007/978-3-642-33454-2_2. [DOI] [PubMed] [Google Scholar]
- Merlet SL, Paquette M, Deriche R, Descoteaux M. Ensemble Average Propagator Reconstruction via Compressed Sensing: Discrete or Continuous Basis. Proc. of ISMRM; Melbourne Australia. 2012. [Google Scholar]
- Michailovich Y, Rathi Y, Dolui S. Spatially regularized compressed sensing for high angular resolution diffusion imaging. IEEE Trans Med Imaging. 2011;30(5):1100–1115. doi: 10.1109/TMI.2011.2142189. [DOI] [PMC free article] [PubMed] [Google Scholar]
- Moeller S. Proc. of the ISMRM; Melbourne Austrailia. 2012. [Google Scholar]
- Mori S, Crain BJ, Chacko VP, van Zijl PC. Three-dimensional tracking of axonal projections in the brain by magnetic resonance imaging. Annals of neurology. 1999;45(2):265–269. doi: 10.1002/1531-8249(199902)45:2<265::aid-ana21>3.0.co;2-3. [DOI] [PubMed] [Google Scholar]
- Mukherjee P, Hess CP, Xu D, Han ET, Kelley DA, Vigneron DB. Development and initial evaluation of 7-T q-ball imaging of the human brain. Magn Reson Imaging. 2008;26(2):171–180. doi: 10.1016/j.mri.2007.05.011. [DOI] [PMC free article] [PubMed] [Google Scholar]
- Nunes RG, Hajnal JV, Golay X, Larkman DJ. Simultaneous slice excitation and reconstruction for single-shot EPI. Proc. of ISMRM.2006. [Google Scholar]
- Ozarslan E, Shepherd TM, Vemuri BC, Blackband SJ, Mareci TH. Resolution of complex tissue microarchitecture using the diffusion orientation transform (DOT) NeuroImage. 2006;31(3):1086–1103. doi: 10.1016/j.neuroimage.2006.01.024. [DOI] [PubMed] [Google Scholar]
- Poupon C, Wiggins CJ, Descoteaux M, Freiweier T, Mangin JF, LeBihan D. Millimeter analytical Q-ball fiber density function for a better separation of fiber populations at 7T. ISMRM 2009 [Google Scholar]
- Rathi Y, Michailovich O, Setsompop K, Bouix S, Shenton ME, Westin CF. Sparse multi-shell diffusion imaging. Medical image computing and computer-assisted intervention: MICCAI … International Conference on Medical Image Computing and Computer-Assisted Intervention. 2011;14(Pt 2):58–65. doi: 10.1007/978-3-642-23629-7_8. [DOI] [PMC free article] [PubMed] [Google Scholar]
- Reese TG, Benner T, Wang R, Feinberg DA, Wedeen VJ. Halving imaging time of whole brain diffusion spectrum imaging and diffusion tractography using simultaneous image refocusing in EPI. J Magn Reson Imaging. 2009;29(3):517–522. doi: 10.1002/jmri.21497. [DOI] [PMC free article] [PubMed] [Google Scholar]
- Reese TG, Heid O, Weisskoff RM, Wedeen VJ. Reduction of eddy-current-induced distortion in diffusion MRI using a twice-refocused spin echo. Magn Reson Med. 2003;49(1):177–182. doi: 10.1002/mrm.10308. [DOI] [PubMed] [Google Scholar]
- Robson PM, Grant AK, Madhuranthakam AJ, Lattanzi R, Sodickson DK, McKenzie CA. Comprehensive quantification of signal-to-noise ratio and g-factor for image-based and k-space-based parallel imaging reconstructions. Magn Reson Med. 2008;60(4):895–907. doi: 10.1002/mrm.21728. [DOI] [PMC free article] [PubMed] [Google Scholar]
- Schultz G, Ullmann P, Lehr H, Welz AM, Hennig J, Zaitsev M. Reconstruction of MRI data encoded with arbitrarily shaped, curvilinear, nonbijective magnetic fields. Magnetic resonance in medicine: official journal of the Society of Magnetic Resonance in Medicine/Society of Magnetic Resonance in Medicine. 2010;64(5):1390–1403. doi: 10.1002/mrm.22393. [DOI] [PubMed] [Google Scholar]
- Schutter DJ, Hortensius R. Retinal origin of phosphenes to transcranial alternating current stimulation. Clinical neurophysiology: official journal of the International Federation of Clinical Neurophysiology. 2010;121(7):1080–1084. doi: 10.1016/j.clinph.2009.10.038. [DOI] [PubMed] [Google Scholar]
- Setsompop K, Alagappan V, Gagoski B, Witzel T, Polimeni J, Potthast A, Hebrank F, Fontius U, Schmitt F, Wald LL, Adalsteinsson E. Slice-selective RF pulses for in vivo B1+ inhomogeneity mitigation at 7 tesla using parallel RF excitation with a 16-element coil. Magn Reson Med. 2008;60(6):1422–1432. doi: 10.1002/mrm.21739. [DOI] [PMC free article] [PubMed] [Google Scholar]
- Setsompop K, Gagoski BA, Polimeni JR, Witzel T, Wedeen VJ, Wald LL. Blipped-controlled aliasing in parallel imaging for simultaneous multislice echo planar imaging with reduced g-factor penalty. Magnetic resonance in medicine: official journal of the Society of Magnetic Resonance in Medicine/Society of Magnetic Resonance in Medicine. 2012;67(5):1210–1224. doi: 10.1002/mrm.23097. [DOI] [PMC free article] [PubMed] [Google Scholar]
- Setsompop K, Wald LL, Alagappan V, Gagoski B, Hebrank F, Fontius U, Schmitt F, Adalsteinsson E. Parallel RF transmission with eight channels at 3 Tesla. Magn Reson Med. 2006;56(5):1163–1171. doi: 10.1002/mrm.21042. [DOI] [PubMed] [Google Scholar]
- Setsompop K, Wald LL, Alagappan V, Gagoski BA, Adalsteinsson E. Magnitude least squares optimization for parallel radio frequency excitation design demonstrated at 7 Tesla with eight channels. Magn Reson Med. 2008;59(4):908–915. doi: 10.1002/mrm.21513. [DOI] [PMC free article] [PubMed] [Google Scholar]
- Sotiropoulos SN, Moeller S, Jbabdi S, Xu J, Andersson JL, Auerbach EJ, Yacoub E, Feinberg D, Setsompop K, Wald LL, Behrens TE, Ugurbil K, Lenglet C. Effects of image reconstruction on fibre orientation mapping from multichannel diffusion MRI: Reducing the noise floor using SENSE. Magnetic resonance in medicine: official journal of the Society of Magnetic Resonance in Medicine/Society of Magnetic Resonance in Medicine. 2013 doi: 10.1002/mrm.24623. EPublished ahead of print. [DOI] [PMC free article] [PubMed] [Google Scholar]
- Stockmann JP, Ciris PA, Galiana G, Tam L, Constable RT. O-space imaging: Highly efficient parallel imaging using second-order nonlinear fields as encoding gradients with no phase encoding. Magnetic resonance in medicine: official journal of the Society of Magnetic Resonance in Medicine/Society of Magnetic Resonance in Medicine. 2010;64(2):447–456. doi: 10.1002/mrm.22425. [DOI] [PMC free article] [PubMed] [Google Scholar]
- Taylor PC, Walsh V, Eimer M. The neural signature of phosphene perception. Human brain mapping. 2010;31(9):1408–1417. doi: 10.1002/hbm.20941. [DOI] [PMC free article] [PubMed] [Google Scholar]
- Tournier JD, Calamante F, Gadian DG, Connelly A. Direct estimation of the fiber orientation density function from diffusion-weighted MRI data using spherical deconvolution. Neuroimage. 2004;23(3):1176–1185. doi: 10.1016/j.neuroimage.2004.07.037. [DOI] [PubMed] [Google Scholar]
- Tournier JD, Yeh C, Calamante F, Cho K, Connelly A, Lin C. Resolving crossing bres using constrained spherical deconvolution: Validation using diffusion-weighted imaging phantom data. NeurImage. 2008;42:617–625. doi: 10.1016/j.neuroimage.2008.05.002. [DOI] [PubMed] [Google Scholar]
- Triantafyllou C, Hoge RD, Krueger G, Wiggins CJ, Potthast A, Wiggins GC, Wald LL. Comparison of physiological noise at 1.5 T, 3 T and 7 T and optimization of fMRI acquisition parameters. Neuroimage. 2005;26(1):243–250. doi: 10.1016/j.neuroimage.2005.01.007. [DOI] [PubMed] [Google Scholar]
- Tristan-Vega A, Westin CF. Probabilistic ODF estimation from reduced HARDI data with sparse regularization. Medical image computing and computer-assisted intervention: MICCAI … International Conference on Medical Image Computing and Computer-Assisted Intervention. 2011;14(Pt 2):182–190. doi: 10.1007/978-3-642-23629-7_23. [DOI] [PMC free article] [PubMed] [Google Scholar]
- Vaughan JT, Garwood M, Collins CM, Liu W, DelaBarre L, Adriany G, Andersen P, Merkle H, Goebel R, Smith MB, Ugurbil K. 7T vs. 4T: RF power, homogeneity, and signal-to-noise comparison in head images. Magnetic resonance in medicine: official journal of the Society of Magnetic Resonance in Medicine/Society of Magnetic Resonance in Medicine. 2001;46(1):24–30. doi: 10.1002/mrm.1156. [DOI] [PubMed] [Google Scholar]
- Wang J, Qiu M, Yang QX, Smith MB, Constable RT. Measurement and correction of transmitter and receiver induced nonuniformities in vivo. Magn Reson Med. 2005;53(2):408–417. doi: 10.1002/mrm.20354. [DOI] [PubMed] [Google Scholar]
- Weaver JB. Simultaneous multislice acquisition of MR images. Magn Reson Med. 1988;8(3):275–284. doi: 10.1002/mrm.1910080305. [DOI] [PubMed] [Google Scholar]
- Weintraub MI, Khoury A, Cole SP. Biologic effects of 3 Tesla (T) MR imaging comparing traditional 1.5 T and 0.6 T in 1023 consecutive outpatients. Journal of neuroimaging: official journal of the American Society of Neuroimaging. 2007;17(3):241–245. doi: 10.1111/j.1552-6569.2007.00118.x. [DOI] [PubMed] [Google Scholar]
- Zelinski AC, Angelone LM, Goyal VK, Bonmassar G, Adalsteinsson E, Wald LL. Specific absorption rate studies of the parallel transmission of inner-volume excitations at 7T. J Magn Reson Imaging. 2008;28(4):1005–1018. doi: 10.1002/jmri.21548. [DOI] [PMC free article] [PubMed] [Google Scholar]
- Zelinski AC, Wald LL, Setsompop K, Alagappan V, Gagoski BA, Goyal VK, Adalsteinsson E. Fast slice-selective radio-frequency excitation pulses for mitigating B+1 inhomogeneity in the human brain at 7 Tesla. Magn Reson Med. 2008;59(6):1355–1364. doi: 10.1002/mrm.21585. [DOI] [PMC free article] [PubMed] [Google Scholar]
- Zelinski AC, Wald LL, Setsompop K, Goyal VK, Adalsteinsson E. Sparsity-enforced slice-selective MRI RF excitation pulse design. IEEE Trans Med Imaging. 2008;27(9):1213–1229. doi: 10.1109/TMI.2008.920605. [DOI] [PMC free article] [PubMed] [Google Scholar]