
Figure 6.
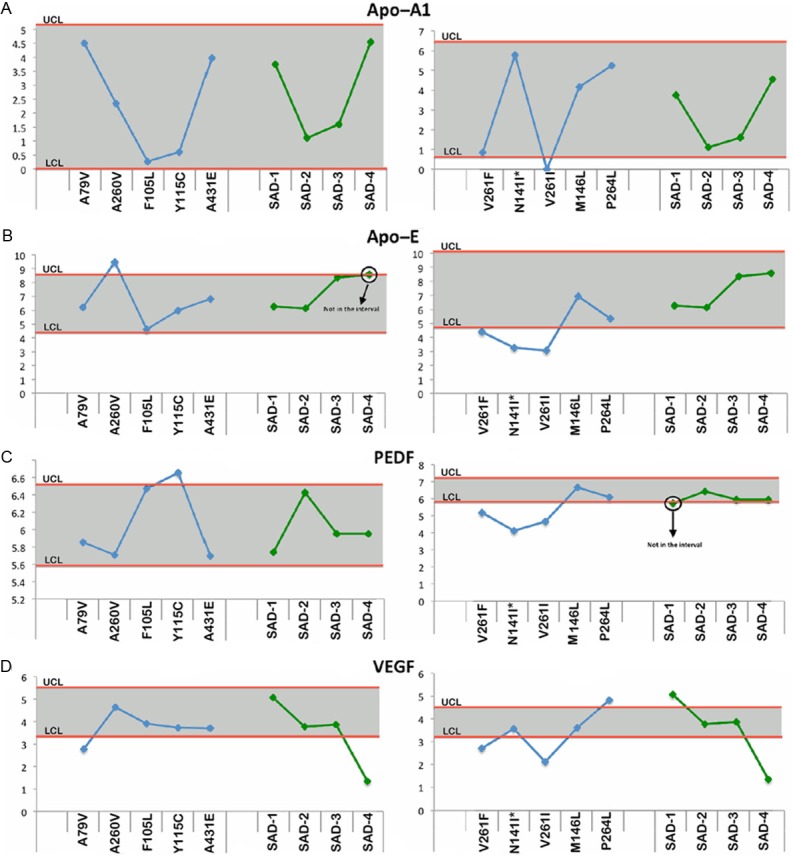
Upper and lower confidence levels (UCL and LCL) derived from Western blot densitometry analyses from non-demented control subjects. The distribution values for each of the interrogated proteins observed in each individual PSEN mutation and SAD cases #1-4 cases are shown along y-axis. A: Apolipoprotein A1 (ApoA1), B: Apolipoprotein E (ApoE), C: Pigment epithelium derived factor (PEDF) and D: Vascular endothelial growth factor (VEGF). All analyses were performed in the white matter.