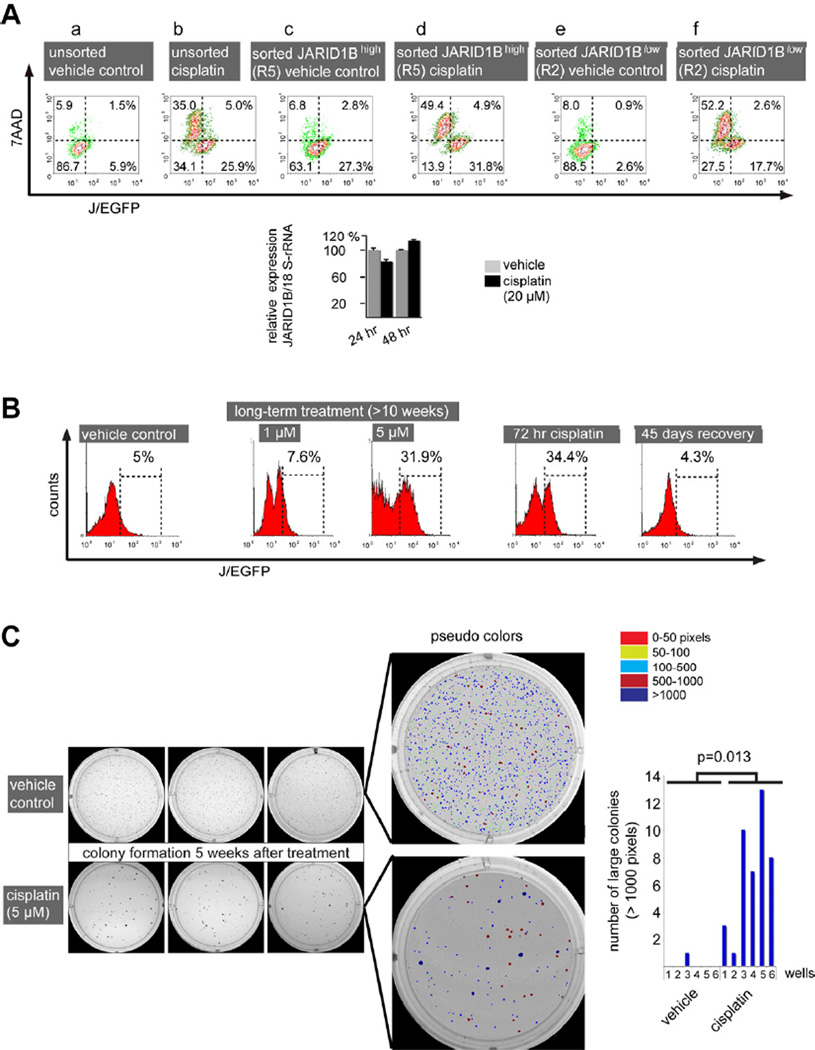
Figure 4. Dynamics of the therapy resistant JARID1Bhigh phenotype.
(A) WM3734JARID1Bprom-EGFP cells were FACS-sorted according to their J/EGFP expression and the isolated subfractions were cultured as adherent monolayers over night. After subsequent treatment for 72 hr, the frequencies of J/EGFPhigh and J/EGFPlow cells were again quantified by flow cytometry. Dead cells were detected by 7AAD staining. JARID1B mRNA expression was quantified by QPCR. (B) Flow cytometric detection of J/EGFPhigh WM3734 cells after prolonged incubation with different concentrations of cisplatin and after drug recovery. (C) Colony forming assay of WM3734 cells that underwent cytotoxic pulse treatment prior to seeding. Cells were treated for 72 hr with cisplatin or vehicle. Surviving cells were subsequently embedded into soft agar (2000 cells/well). Colony sizes and numbers were digitally quantified and color-coded with dark blue colonies representing large colonies above 1000 pixels. Shown are results from two independent experiments, each performed in triplicate. Error bars represent SD.

