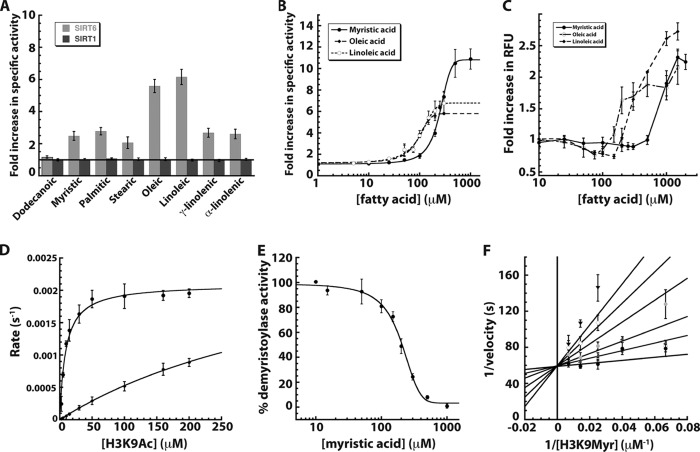
FIGURE 2.
Sirtuin activity in the presence of free fatty acids. A, -fold change in SIRT1 and SIRT6 deacetylase activity was monitored in the presence of various FFAs and compared with a reaction without fatty acid. SIRT1 (dark gray) and SIRT6 (light gray) were incubated with 70 μm H3K9Ac peptide and 0.5 mm NAD+ in the presence of 100 μm fatty acid and analyzed by HPLC. B, -fold increase in SIRT6 deacetylase activity when 70 μm H3K9ac peptide was incubated with 0.5 mm NAD+ and 0–1 mm myristic (filled circles, solid line), 0–300 μm oleic (filled diamonds, long dashed lines), and linoleic acids (open circles, short dashed lines). C, critical micelle concentration determined by DPH (5 μm) assay (23) in 20 mm potassium phosphate (pH 7.5)/6.7% DMSO in the presence of varied myristic (filled circle, solid line), oleic (open circle, dash dot line), and linoleic acids (filled diamonds, long dashed line). D, steady-state kinetic analyses of SIRT6 deacetylation of 0–200 μm H3K9Ac peptide in the presence of 2 mm NAD+ with (filled circles) and without (filled diamonds) 400 μm myristic acid. E, percentage of demyristoylase activity of SIRT6 incubated with 70 μm H3K9myr peptide, 0.5 mm NAD+, and 0–1 mm myristic acid. F, myristic acid inhibition of SIRT6 demyristoylase activity displayed in double-reciprocal format. Reactions contained 2 μm SIRT6, 0.5 mm NAD+, and varied H3K9Myr peptide in the presence of 0 (filled circles), 25 (open circles), 50 (dark gray triangles), 100 (light shaded circles), 150 (open diamonds), and 200 (inverted triangles) μm myristic acid. Data were fitted (using nonlinear least squares) to the equation for competitive inhibition and yielded a Kis of 15 ± 9 μm. Error bars represent S.D. of at least three replicates.

