
Figure 5.
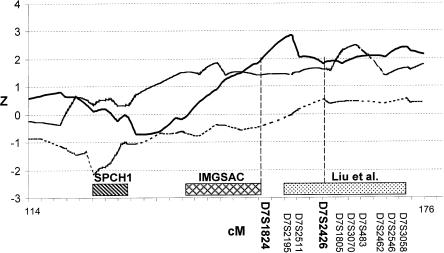
Plots of nonparametric Z scores for linkage analysis of 28 additional markers flanking the chromosome 7q region identified in the quantitative genome scan. Results for WORD (solid line), PHRASE (dotted line), and RSB (dashed line) are shown. The 10 markers included in the association analysis are listed in the figure. The rectangle with diagonal stripes represents the region identified in a family with severe speech disorder (Fisher et al. 1998); the rectangle with cross-hatches represents the autism region reported in the IMGSAC (1998) study; and the rectangle with dots represents the results of a linkage analysis using the narrow diagnosis of autism (Liu et al. 2001). The X-axis tick marks are at 2-cM intervals.