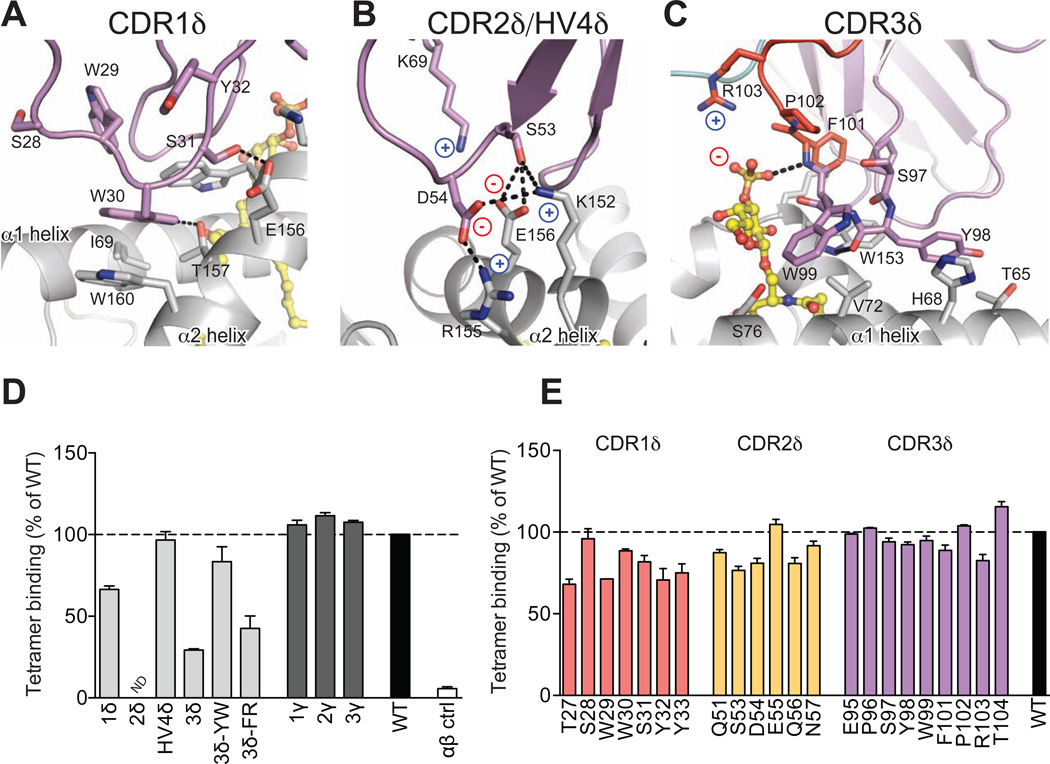
Figure 4. Analysis of DP10.7 TCR-CD1d-sulfatide contacts.
(A–C) Polar contacts are shown in dashed black lines; charges are indicated to emphasize salt-bridge contacts. CD1d shown in light grey, sulfatide in yellow, TCR germline residues in violet, non-templated in red for CDR1δ (A); CDR2δ and HV4 (B); and CDR3δ (C) contacts. (D–E) TCR mutagenesis and binding measurements were determined by plate-binding assay. ELISA plate wells were coated with WT or mutant single-chain (sc) TCRs, and binding to CD1d-sulfatide-tetramers labeled with HRP was measured by colorimetric readout (A450). Non-specific binding to BSA was subtracted and binding was calculated as a % of WT. Shown are the mean and S.E.M. of at least two independent experiments. (D) Entire CDR loops were substituted with an unrelated CDR loop sequences and binding was compared with the WT DP10.7 TCR. Double-alanine mutations of indicted CDR3δ loop residues were also analyzed. (E) Single alanine point mutations of the DP10.7 TCR δ chain were made and binding vs WT TCR was measured as above (see also Figure S3 and Table S3).

